
Обзор
Это стратегия прорывной торговли, основанная на чисто ценовом поведении, разработанная с высоким риском и доходностью 1: 5. Стратегия проводит торговлю, идентифицируя прорывы в ключевых ценовых уровнях, и в сочетании с динамикой структуры рынка устанавливает цели по остановке убытков и прибыли. Стратегия не зависит от каких-либо технических показателей и принимает торговые решения исключительно на основе ценового поведения в реальном времени.
Стратегический принцип
Основная логика стратегии включает в себя следующие ключевые части:
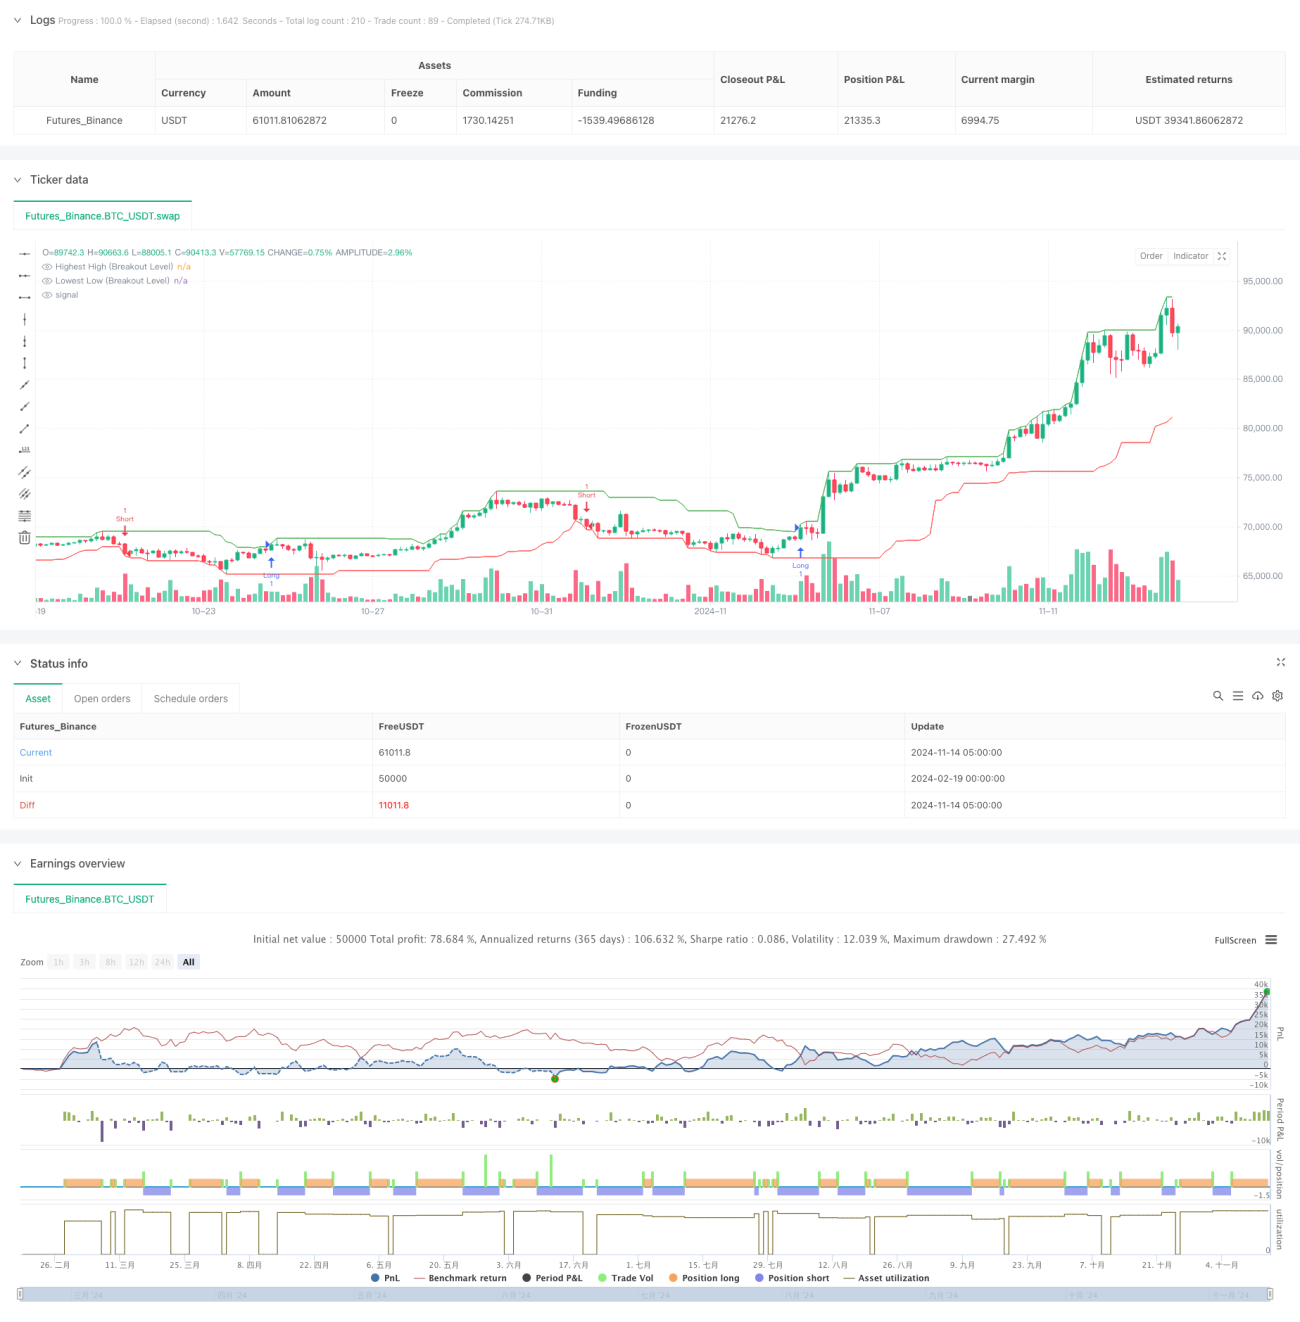
- Формирование точек отсчета прорыва путем идентификации максимальных и минимальных уровней цен за прошедший период времени
- Открытие сверхпозиции при прорыве ценового максимума, открытие свободной позиции при прорыве минимума
- Динамическая стоп-позиция, основанная на недавних колебаниях, многопозиционная стоп-позиция на низком уровне, свободная стоп-позиция на высоком уровне
- Рассчитывание целевого местоположения прибыли на основе соотношения риска и прибыли 1:5
- Установите максимальное количество транзакций в день, чтобы избежать чрезмерной торговли
Весь процесс торговли полностью основан на ценовом поведении, без использования каких-либо технических показателей в качестве отсылки.
Стратегические преимущества
- Торговля чисто ценовым поведением, избегая помех от отставания показателей
- Дизайн с высоким риском и отдачей, потенциальная прибыль от каждой сделки в 5 раз больше риска
- Динамическая стоп-стратегия, адаптирующаяся к структуре рынка
- Ясные торговые сигналы и визуальные маркировки, облегчающие совершение торгов
- Параметры легко настраиваются для адаптации к различным рыночным условиям.
- Строгий контроль риска, включая ограничение количества транзакций в день
Стратегический риск
- Частые ложные прорывы на рынке могут вызвать колебания
- Высокий риск-возвращение может привести к относительно низким шансам на победу
- Отзыв после прорыва может вызвать остановку
- Изменения в волатильности рынка могут повлиять на эффективность стратегии
- Для достижения целей прибыли требуется значительное изменение цен.
Меры по смягчению последствий:
- Использование этой стратегии на трендовых рынках
- Избегайте транзакций во время важных новостных выпусков
- Разумный размер позиции
- Регулярная проверка и оптимизация параметров
Направление оптимизации стратегии
- Добавление фильтра тренда, чтобы торговать только в направлении основного тренда
- Добавление механизма подтверждения транзакций для повышения надежности прорыва
- Риск-рентабельность, динамически скорректированная в зависимости от волатильности
- Внедрение многочасового анализа для повышения точности транзакций
- Разработка более интеллектуальных механизмов по устранению потерь, таких как отслеживание потерь
- Добавление возможности идентификации рыночной среды, адаптация к изменению параметров стратегии
Подвести итог
Это строго разработанная, логически ясная стратегия торговли ценовым поведением. С помощью высокой рисково-возмездного соотношения риска, при эффективном контроле риска, преследуется значительная прибыль. Преимущества стратегии заключаются в чистом движении цены, гибкости параметров и совершенстве управления риском.
- 1