Оценка тренда на основе многопериодной скользящей средней и стратегия перекупленности RSI

Обзор
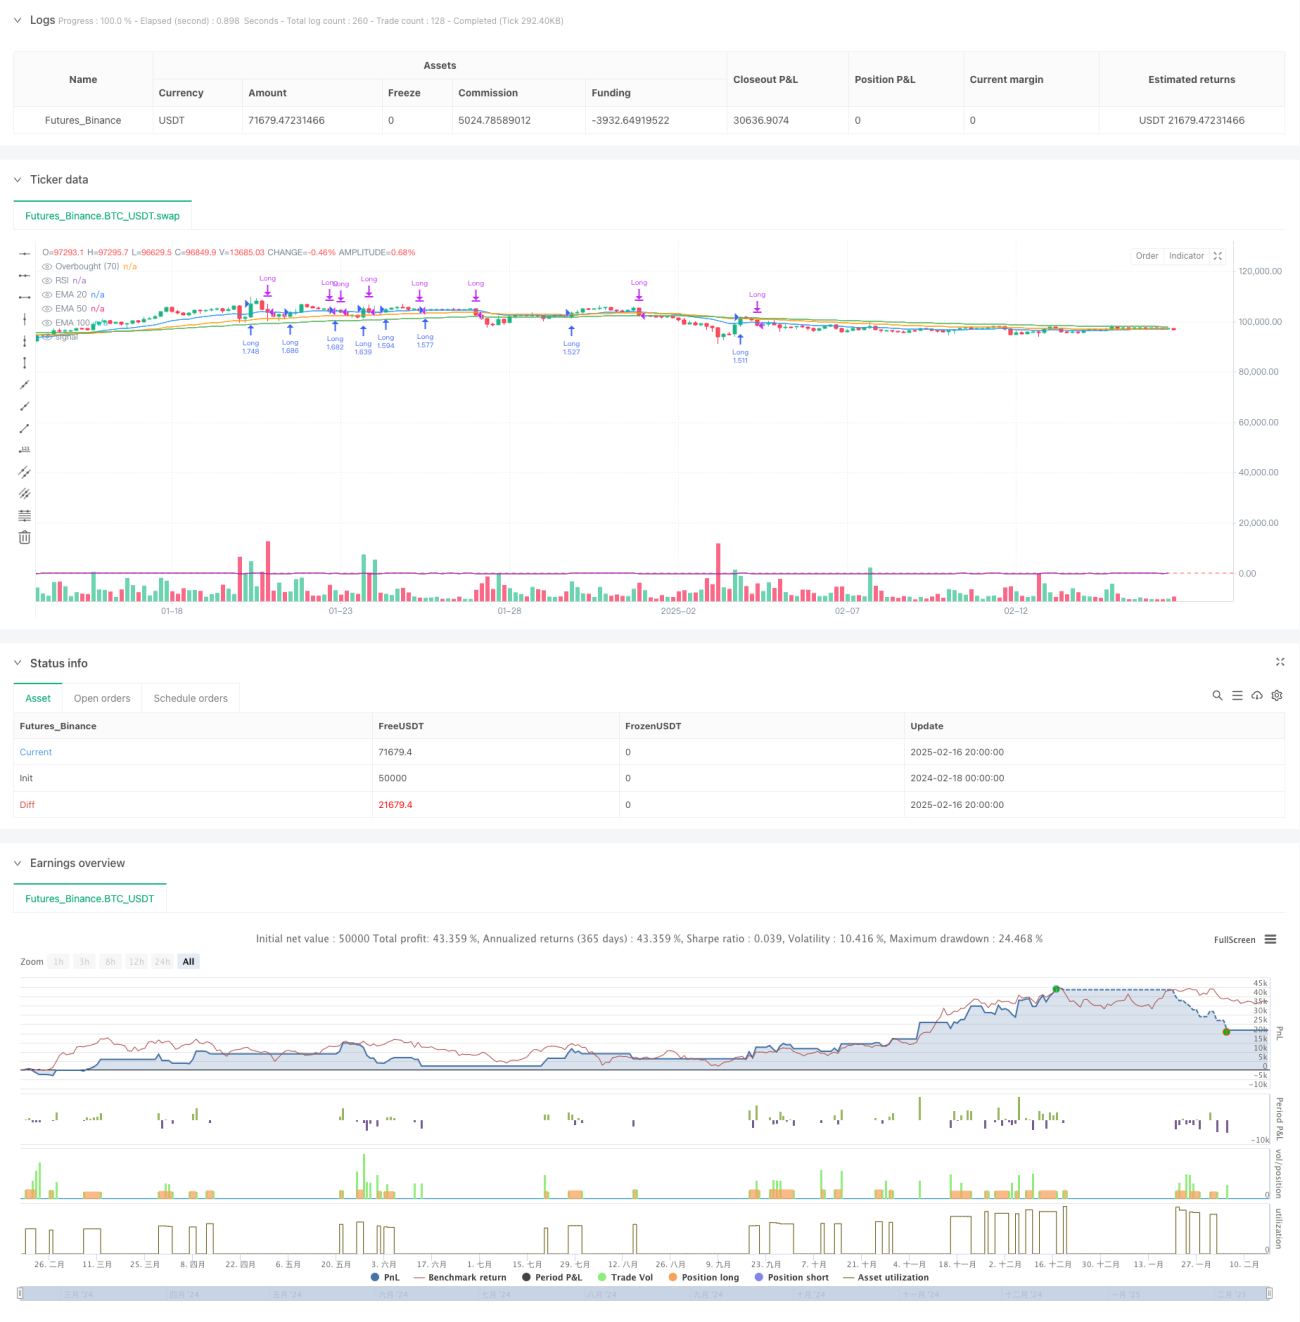
Стратегия - это система для отслеживания трендов, основанная на многоциклических скользящих средних показателях (EMA) и относительно сильных показателях (RSI). Стратегия принимает торговые решения, оценивая три цикла EMA 20, 50, 100 в сочетании с ценовым прорывом и RSI-оборотным сигналом. Стратегия применяется в основном для трендовых рынков, чтобы повысить точность торговли путем проверки нескольких технических показателей.
Стратегический принцип
Основная логика стратегии включает в себя следующие ключевые части:
- Определение тренда: оценить, находятся ли средние линии трех циклов ((20/50/100) в восходящем тренде, сравнив текущие значения EMA с значениями предыдущего цикла
- Условия входа: Сигнал покупки подается, когда цена пересекает 20-циклическую ЭМА снизу, и все три средние линии находятся в восходящем тренде
- Условия выхода: Прямая позиция, когда RSI превышает 70 (перекуп) или цена падает ниже 20-ти циклических ЭМА
- Управление позициями: процент от общей стоимости счета, используемый для хранения позиций (в размере 10%)
Стратегические преимущества
- Механизм многократного подтверждения: взаимная верификация EMA и RSI на трех различных периодах снижает риск ложных прорывов
- Тренд-трек: эффективное отслеживание среднесрочных и долгосрочных тенденций, повышение рентабельности
- Контроль риска: эффективное управление отступлением с использованием RSI-сигналов перекупа и падения средней линии в качестве условий для остановки
- Управление капиталом: используется управление процентными позициями, позволяющее автоматически корректировать объемы торгов в зависимости от размера счета
- Систематическая работа: четкие правила стратегии, которые позволяют уменьшить помехи, вызванные субъективными суждениями
Стратегический риск
- Задержка: EMA как задержка может привести к небольшим задержкам во время входа и выхода
- Риск рыночных потрясений: частое возникновение ложных сигналов на рынках с поперечным колебанием
- Риск падения: резкий рыночный скачок может привести к потере позиции стоп-лосса
- Чувствительность параметров: может потребоваться корректировка циклов EMA и значений RSI в разных рыночных условиях
- Расходы на транзакции: частые транзакции могут привести к более высоким расходам на транзакции
Направление оптимизации стратегии
- Идентификация рыночной конъюнктуры: добавление механизмов оценки состояния рынка, автоматическое снижение позиций или приостановка торговли в условиях рыночных потрясений
- Оптимизация динамических параметров: автоматическая корректировка циклов EMA и понижения RSI в зависимости от рыночных колебаний
- Оптимизация стоп-лосс: внедрение механизма отслеживания стоп-лосс для лучшей защиты прибыли
- Оптимизация входа: увеличение механизма подтверждения количества транзакций, повышение надежности прорывного сигнала
- Оптимизация управления позициями: изменение доли позиций в зависимости от динамики силы тренда и рыночной волатильности
Подвести итог
Это сложная система стратегий, объединяющая отслеживание тенденций и изменение динамики. Благодаря совместному использованию нескольких технических показателей, в то же время сохраняя стратегию простой и понятной, достигаются лучшие характеристики риска и прибыли.
/*backtest
start: 2024-02-18 00:00:00
end: 2025-02-17 00:00:00
period: 4h
basePeriod: 4h
exchanges: [{"eid":"Futures_Binance","currency":"BTC_USDT"}]
*/

//@version=5
strategy("EMA Crossover + RSI Strategy", overlay=true, initial_capital=10000, default_qty_type=strategy.percent_of_equity, default_qty_value=200)

// Calculate EMAs- 1