
1
Follow
1781
Followers
Обзор
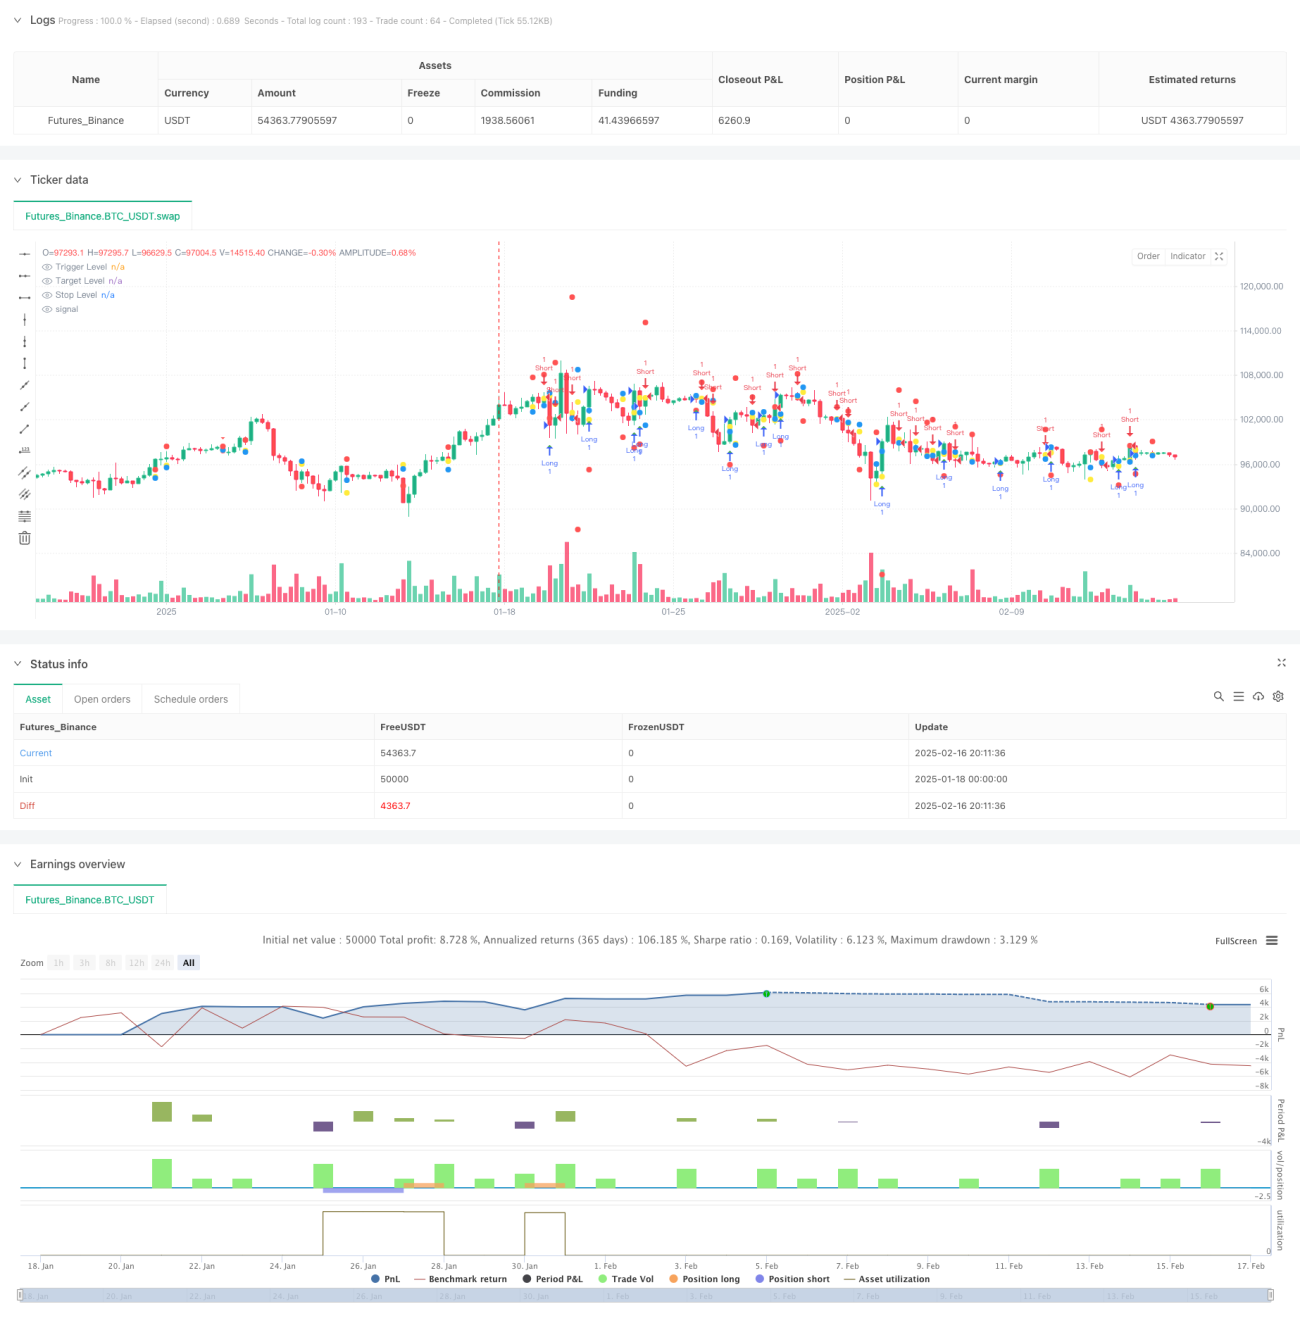
Это многочасовая торговая стратегия, основанная на теории диапазона диаграмм. Эта стратегия в основном идентифицирует потенциальные торговые возможности, анализируя диаграммные формы и ценовые диапазоны более высоких временных периодов.
Стратегический принцип
В основе стратегии лежит наблюдение за прорывами цены в предыдущие промежутки на более высоких временных периодах (по умолчанию 4 часа). В частности:
- Стратегия будет постоянно отслеживать и хранить данные о высоких и низких точках на двух предыдущих высоких временных периодах K-линии
- Когда текущая цена закрытия одной из K-линий ниже предыдущей высокой и текущая K-линия является высокой, образуется дефицитный сигнал
- Положительный сигнал формируется, когда текущая цена закрытия K-линии выше предыдущей низкой и текущая инновация K-линии ниже
- Цена входа устанавливается на высоком и низком точках, вызывающих K-линию
- Цель прибыли, установленная на соответствующем высоком и низком уровне в предыдущем периоде
- Стоп-дистанция динамически корректируется в зависимости от размера интервала
Стратегические преимущества
- Многовременный анализ дает более надежный сигнал
- Динамическая стоп-стратегия, адаптирующаяся к рыночным колебаниям
- Опциональные механизмы фильтрации объема транзакций повышают степень подтверждения транзакций
- Ясный визуальный интерфейс, включающий в себя маркировку триггерной цены, целевой цены и остановки
- Логика стратегии проста, ясна, легко понятна и реализуема
- Подходит для различных видов торговли и рыночных условий
Стратегический риск
- Частые ложные сигналы об обрыве могут возникать на рынке в период колебаний.
- Большой стоп-множитель может привести к слишком большим единовременным убыткам
- Опираясь на исторические данные о ценах, может отставать в быстро меняющихся рыночных условиях
- Влияние фундаментальных факторов не учтено
- Эффективное исполнение может быть затруднено в условиях низкой ликвидности рынка
Направление оптимизации стратегии
- Введение фильтров тренда, таких как движущиеся средние или индикаторы ADX
- Добавление дополнительных критериев оценки рыночных условий
- Оптимизация стратегии остановки убытков с возможностью внедрения мобильного остановки
- Присоединение к модулю управления объемами сделок
- Подумайте о том, чтобы добавить дополнительный анализ сочетания временных циклов.
- Введение показателей волатильности для оптимизации интервальных суждений
Подвести итог
Это целостная, логически ясная многовременная торговая стратегия. Она ищет потенциальные трендовые возможности, анализируя ценовое поведение в более высокие временные периоды, а также интегрирует механизмы управления рисками и фильтрации. Основные преимущества стратегии заключаются в ее адаптивности и масштабируемости.
Source
Pine
Strategy parameters
Related strategies
Comment
All comments (0)
No data
- 1