
Обзор
Стратегия представляет собой торговую систему для отслеживания тенденций, основанную на форматах прорыва и отставания от пояса буринского пояса. Стратегия определяет торговый сигнал, идентифицируя отставание от трех последовательных прорывов пояса буринского пояса, и в сочетании с расположением цены закрытия в сущности отставания от пояса. Система использует фиксированное соотношение риска и прибыли в размере 1:1 для управления остановками и остановками для каждой сделки.
Стратегический принцип
Основная логика стратегии основана на следующих ключевых элементах:
- Используется 20-циклическая лента Бринна в качестве основного показателя, стандартный разрыв в кратном выражении 2.0
- Условия многоголового входа: три последовательных K-линии, которые являются солнечными линиями, закрываются в верхней половине объекта
- Входное условие: три последовательных K-линии, где цена закрытия пробивается вниз, и эти три K-линии являются отрицательными, и цена закрытия находится в нижней половине объекта
- Стоп-потеря устанавливается на пределе первой линии K.
- Риск-прибыль, основанный на 1: 1 по сравнению с установкой стоп-позиции
Стратегические преимущества
- Использование многократного подтверждения механизма эффективно снижает риск ложного прорыва с помощью трех последовательных форм прорыва линии K.
- В сочетании с определением позиции цены закрытия в объекте K-линии повышается надежность подтверждения тренда
- Управление позициями с использованием фиксированного коэффициента риска-прибыли для упрощения контроля риска
- Логика стратегии ясна, проста для понимания и реализации.
- Интуитивное отображение торговых сигналов с помощью функций маркировки для облегчения обратной связи и анализа
Стратегический риск
- На нестабильных рынках могут возникать частые ложные сигналы
- Фиксированный риск-прибыль может быть недостаточно эффективным в случае сильных тенденций.
- Строгие требования к трем последовательным K-линиям могут упустить некоторые потенциальные возможности.
- Стоп-потеря установлена на пределе K-линии сигнала, стоп-потеря может быть слишком далеко при больших колебаниях
Рекомендуется управлять рисками следующим образом:
- Параметры Бринских полос в сочетании с циклическими колебаниями рынка
- Риск-рентабельность, скорректированная в соответствии с динамикой рыночных характеристик
- Добавить индикаторы подтверждения тренда
- Оптимизация методов установки стоп-позиции
Направление оптимизации стратегии
- Параметры оптимизации:
- Периоды и кратности стандартного разрыва в Брин-Бенде могут быть скорректированы в зависимости от динамики различных рыночных характеристик
- Рассмотрение требований к трем K-линиям в динамическом решении
- Оптимизация сигнала:
- Увеличение признаков тренда, таких как ADX или трендовые линии
- Введение механизма подтверждения поставок
- Рассмотреть возможность включения в качестве вспомогательного индикатора колебания
- Оптимизация управления позициями:
- Динамическая настройка риска-прибыли
- Добавление модуля управления деньгами
- Рассматривается возможность создания миротворческих складов
- Оптимизация убытков:
- Введение механизма отслеживания потерь
- Стоп-дистанция на основе ATR
- Учитывайте время.
Подвести итог
Это целостная, логически ясная стратегия отслеживания тенденций. С помощью механизма многократного подтверждения формы прорыва буринского пояса и конвейера эффективно снижается риск ложного сигнала. Фиксированная настройка риска-прибыли упрощает управление сделками, но также ограничивает гибкость стратегии.
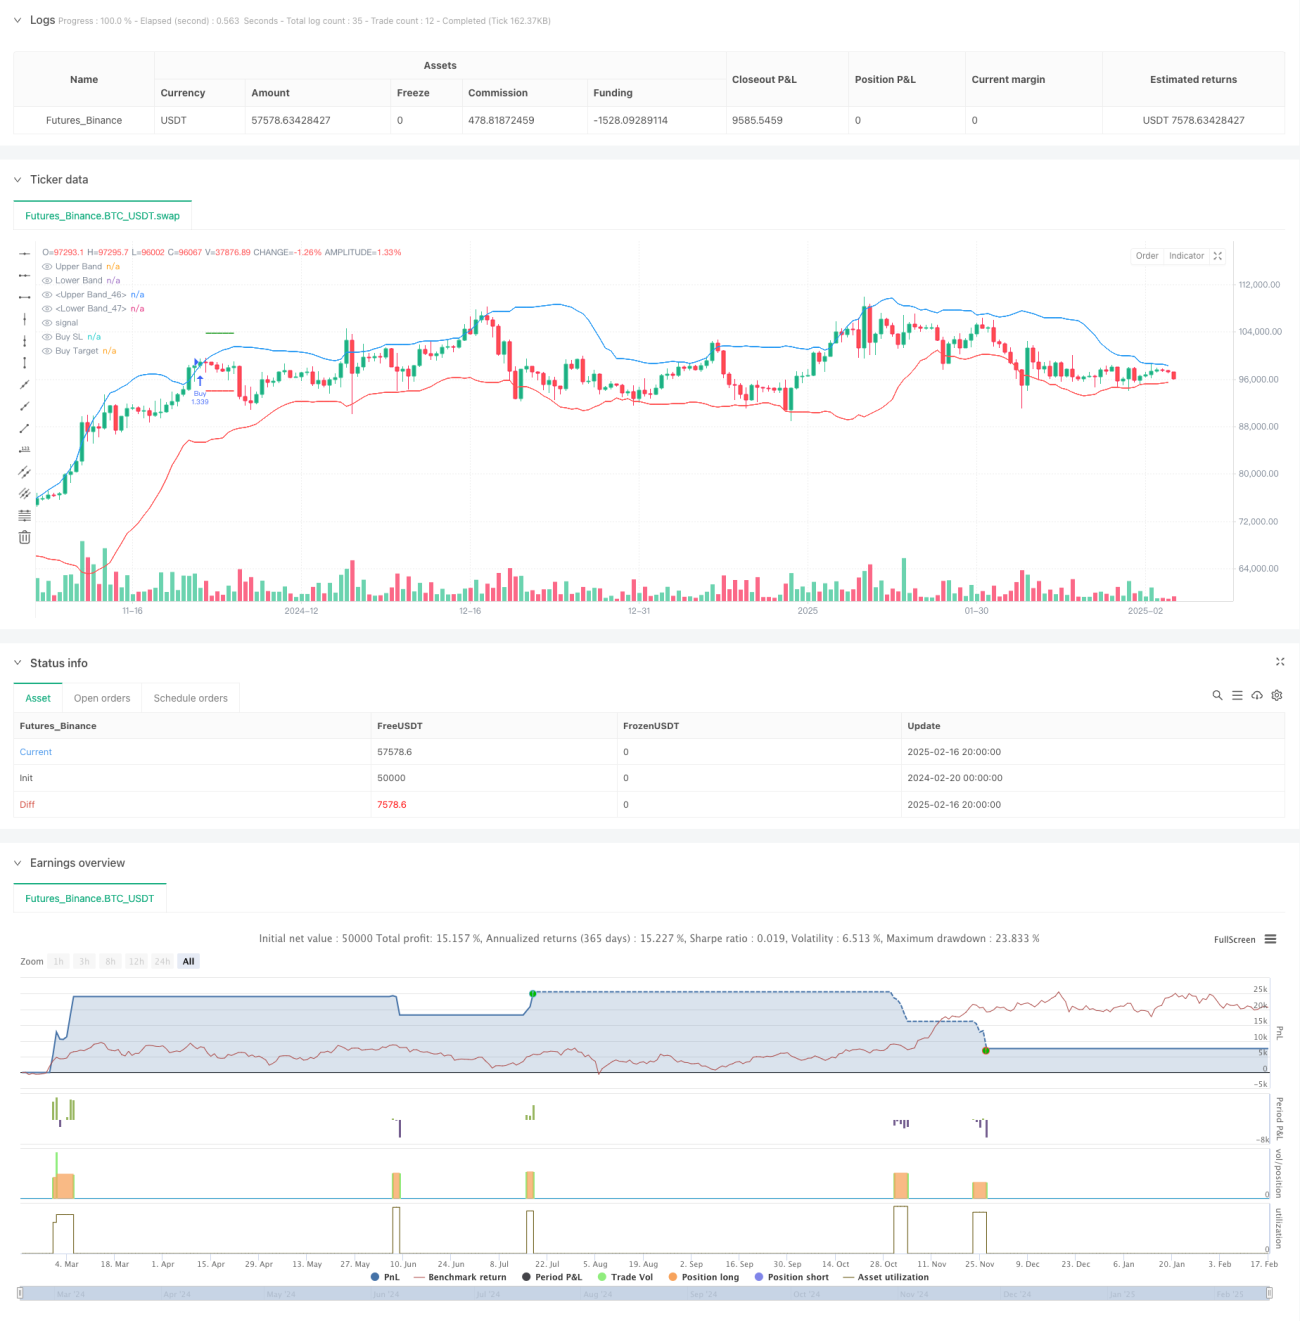
/*backtest
start: 2024-02-20 00:00:00
end: 2025-02-17 08:00:00
period: 12h
basePeriod: 12h
exchanges: [{"eid":"Futures_Binance","currency":"BTC_USDT"}]
*/

//@version=6
strategy("Bollinger Band Strategy (Close Near High/Low Relative to Half Range)", overlay=true, default_qty_type=strategy.percent_of_equity, default_qty_value=200, pyramiding=0)

// Bollinger Bands- 1