Обзор
Стратегия представляет собой комплексную торговую систему, основанную на техническом анализе, в сочетании с анализом сопротивления в зонах поддержки, графических форм и структуры рынка. Стратегия принимает торговые решения путем идентификации ключевых уровней цен, подтверждения графических сигналов и оценки общей тенденции рынка. Система использует соотношение риска и прибыли в размере 1: 3, чтобы управлять риском с помощью заранее установленных целей по остановке потерь и прибыли.
Стратегический принцип
Основная логика стратегии основана на следующих ключевых компонентах:
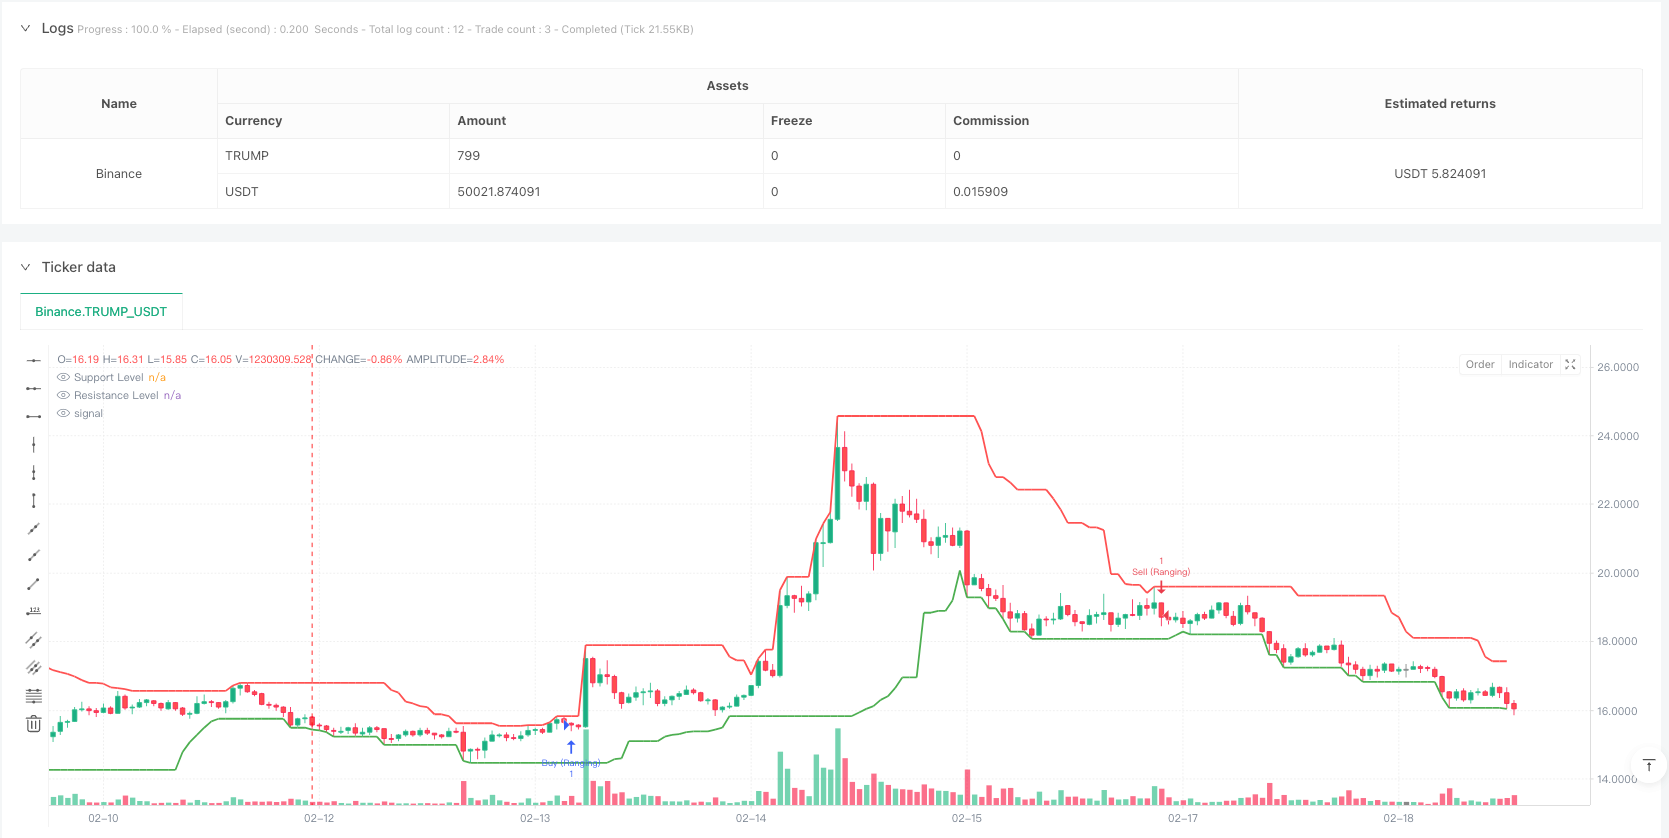
- Идентификация зоны поддержки и сопротивления - использование максимумов и минимумов за последние 20 циклов для определения ключевых уровней цен
- Подтверждение форм пота - включает в себя типичные формы, такие как поглощение пота, поглощение пота, скобные линии и линии метеоров
- Анализ структуры рынка - определение того, находится ли рынок в восходящем, нисходящем или междиапазонном состоянии, путем сравнения последовательности высоких и низких точек
- Управление рисками - установка стоп-позиций с фиксированным количеством стоп-стоп и рисково-прибыльным соотношением 1:3
Стратегия может работать в трех рыночных условиях: трендовом, промежуточном и конверсионном, но для каждого из них используется различная комбинация правил торговли.
Стратегические преимущества
- Многомерный анализ - обеспечивает более надежные торговые сигналы, объединяя уровни цен, графические формы и структуру рынка
- Адаптируемость - способность адаптироваться к различным рыночным условиям, включая тенденции и диапазоны
- Правильное управление рисками - использование фиксированного коэффициента риска-прибыли, чтобы обеспечить четкий контроль риска для каждой сделки
- Визуальная поддержка - поддержка зоны сопротивления с помощью графических знаков, чтобы помочь трейдерам понять состояние рынка
Стратегический риск
- Риск ложного прорыва - цена может быстро отступить после прорыва, создавая ложный сигнал
- Риск скольжения - в периоды сильных колебаний реальные цены могут значительно отклоняться от ожиданий
- Чувствительность параметров - выбор параметров, поддерживающих циклы сопротивления, циклы рыночной структуры и т. д., может существенно повлиять на эффективность стратегии
- Зависимость от рыночных условий - может плохо работать в условиях быстрого одностороннего движения или сильных колебаний рынка
Направление оптимизации стратегии
- Регулирование динамических параметров - цикл вычислений, автоматически корректирующий зоны поддержки и сопротивления в зависимости от рыночных колебаний
- Усиление фильтрации - добавление таких показателей, как трафик, волатильность, чтобы отфильтровать ложные прорывные сигналы
- Оптимизация стоп-лорда - реализация динамических стоп-лорда на основе ATR, повышение адаптивности к рыночным колебаниям
- Проверка часовых рамок - внедрение многоразового анализа, повышение надежности сигнала
- Оптимизация управления позициями - динамическая корректировка размеров позиций на основе волатильности рынка и силы сигналов
Подвести итог
Стратегия создает целостную торговую систему, используя в совокупности несколько инструментов технического анализа. Ее преимущества заключаются в многомерном анализе и полном управлении рисками, но в то же время она сталкивается с такими проблемами, как ложные прорывы и чувствительность к параметрам.
/*backtest
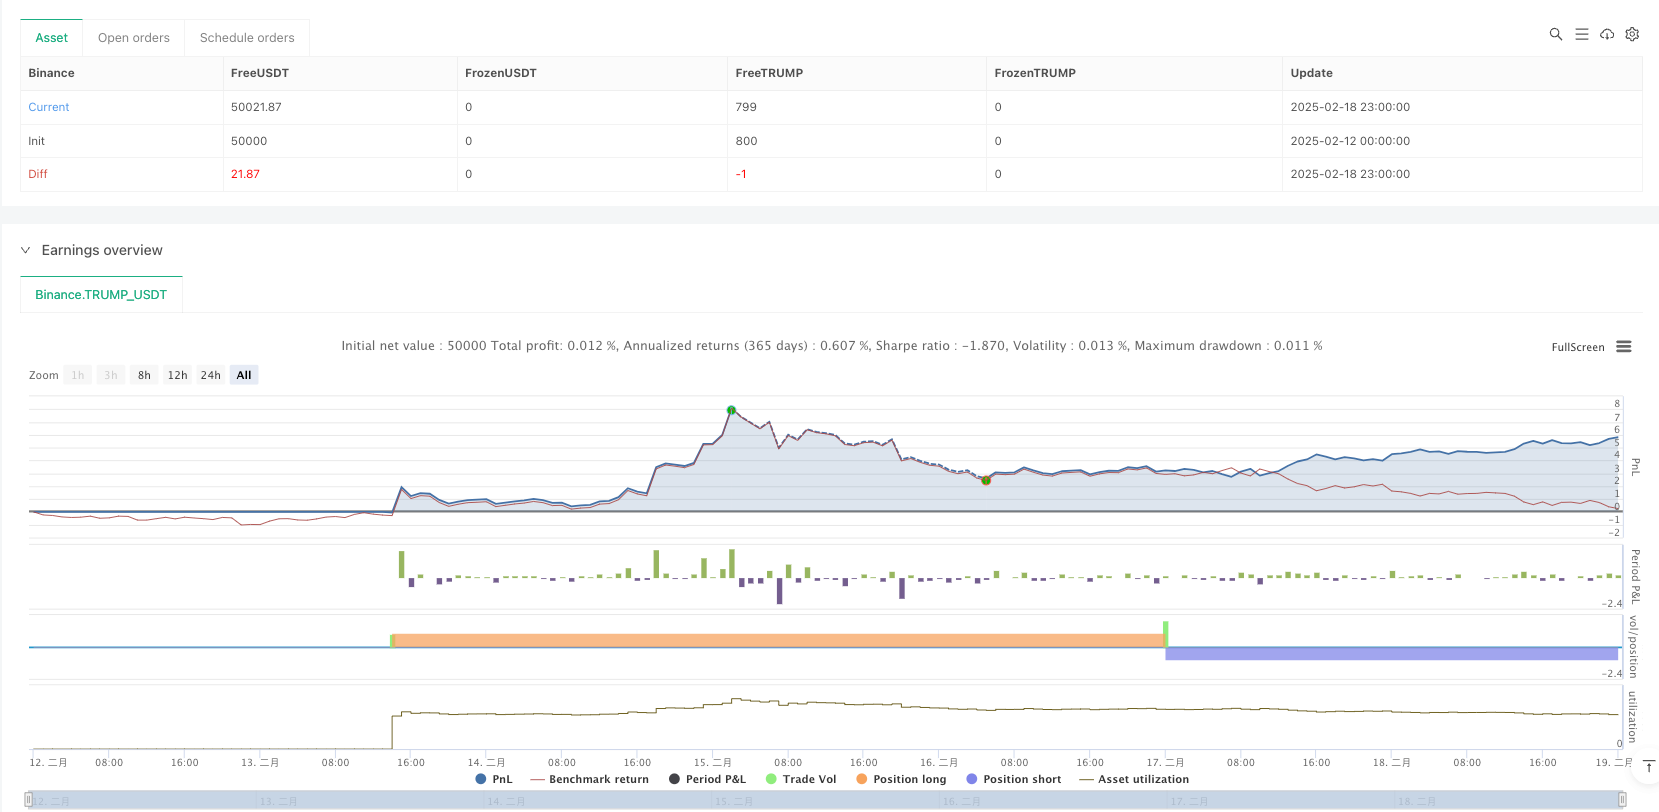
start: 2025-02-12 00:00:00
end: 2025-02-19 00:00:00
period: 1h
basePeriod: 1h
exchanges: [{"eid":"Binance","currency":"TRUMP_USDT"}]
*/
//@version=5
strategy("Support/Resistance Strategy with Candlestick Confirmation, Market Structure, and 1:3 R:R", overlay=true)
// Input parameters
supportResistancePeriod = input.int(20, title="Support/Resistance Period", minval=1)
stopLossPips = input.int(50, title="Stop Loss (in pips)", minval=1)
takeProfitRatio = input.float(3.0, title="Risk-to-Reward Ratio", minval=1.0)
structurePeriod = input.int(20, title="Market Structure Period", minval=1) // Period to determine market structure
// Function to calculate support level (lowest low in the period)
getSupportLevel() =>
ta.lowest(low, supportResistancePeriod)
// Function to calculate resistance level (highest high in the period)
getResistanceLevel() =>
ta.highest(high, supportResistancePeriod)
// Get the support and resistance levels
supportLevel = getSupportLevel()
resistanceLevel = getResistanceLevel()
// Function to detect market structure
isBullishTrend() =>
high[structurePeriod] > high[structurePeriod+1] and low[structurePeriod] > low[structurePeriod+1]
isBearishTrend() =>
high[structurePeriod] < high[structurePeriod+1] and low[structurePeriod] < low[structurePeriod+1]
isRanging() =>
not isBullishTrend() and not isBearishTrend()
// Candlestick Pattern Detection Functions
isBullishEngulfing() =>
close[1] < open[1] and close > open and close > open[1] and open < close[1]
isBearishEngulfing() =>
close[1] > open[1] and close < open and close < open[1] and open > close[1]
isDoji() =>
math.abs(close - open) <= (high - low) * 0.1
isHammer() =>
body = math.abs(close - open)
upperShadow = high - math.max(close, open)
lowerShadow = math.min(close, open) - low
body <= (high - low) * 0.3 and lowerShadow > body * 2 and upperShadow <= body * 0.5
isShootingStar() =>
body = math.abs(close - open)
upperShadow = high - math.max(close, open)
lowerShadow = math.min(close, open) - low
body <= (high - low) * 0.3 and upperShadow > body * 2 and lowerShadow <= body * 0.5
// Conditions for Buy and Sell based on candle close
buyCondition = (isBullishEngulfing() or isHammer()) and close > supportLevel
sellCondition = (isBearishEngulfing() or isShootingStar()) and close < resistanceLevel
// Define buy/sell conditions based on market structure
bullishMarket = isBullishTrend() and buyCondition
bearishMarket = isBearishTrend() and sellCondition
rangingMarket = isRanging() and (buyCondition or sellCondition)
// Calculate the Stop Loss and Take Profit Levels
longStopLoss = supportLevel - (stopLossPips * syminfo.mintick)
shortStopLoss = resistanceLevel + (stopLossPips * syminfo.mintick)
// Calculate R:R based Take Profit Levels
longTakeProfit = close + (math.abs(close - longStopLoss) * takeProfitRatio)
shortTakeProfit = close - (math.abs(close - shortStopLoss) * takeProfitRatio)
// Plotting Support and Resistance Lines
plot(supportLevel, color=color.green, linewidth=2, title="Support Level", style=plot.style_line)
plot(resistanceLevel, color=color.red, linewidth=2, title="Resistance Level", style=plot.style_line)
// Strategy: Buy on Support, Sell on Resistance with candlestick confirmation and market structure
if (bullishMarket)
strategy.entry("Buy", strategy.long, stop=longStopLoss, limit=longTakeProfit)
if (bearishMarket)
strategy.entry("Sell", strategy.short, stop=shortStopLoss, limit=shortTakeProfit)
if (rangingMarket)
if (buyCondition)
strategy.entry("Buy (Ranging)", strategy.long, stop=longStopLoss, limit=longTakeProfit)
if (sellCondition)
strategy.entry("Sell (Ranging)", strategy.short, stop=shortStopLoss, limit=shortTakeProfit)
// Optional: Highlighting the zones for support and resistance
bgcolor(close > resistanceLevel ? color.new(color.red, 90) : na, title="Resistance Zone")
bgcolor(close < supportLevel ? color.new(color.green, 90) : na, title="Support Zone")