Стратегия Momentum Trend SuperTrend и Stochastic Crossover

Обзор
Эта стратегия является системой торговли, которая сочетает в себе индикатор SuperTrend и случайный индикатор (Stochastic Oscillator). Эта стратегия использует индикатор SuperTrend для определения направления рыночной тенденции, а также использует сигнал перекупа и перепродажи случайного индикатора в качестве сигнала подтверждения сделки. Стратегия использует метод пересечения динамики, чтобы найти оптимальные моменты входа и выхода в направлении тенденции, чтобы достичь идеального сочетания слежения за тенденцией и анализа динамики.
Стратегический принцип
Основная логика стратегии основана на сочетании двух основных показателей:
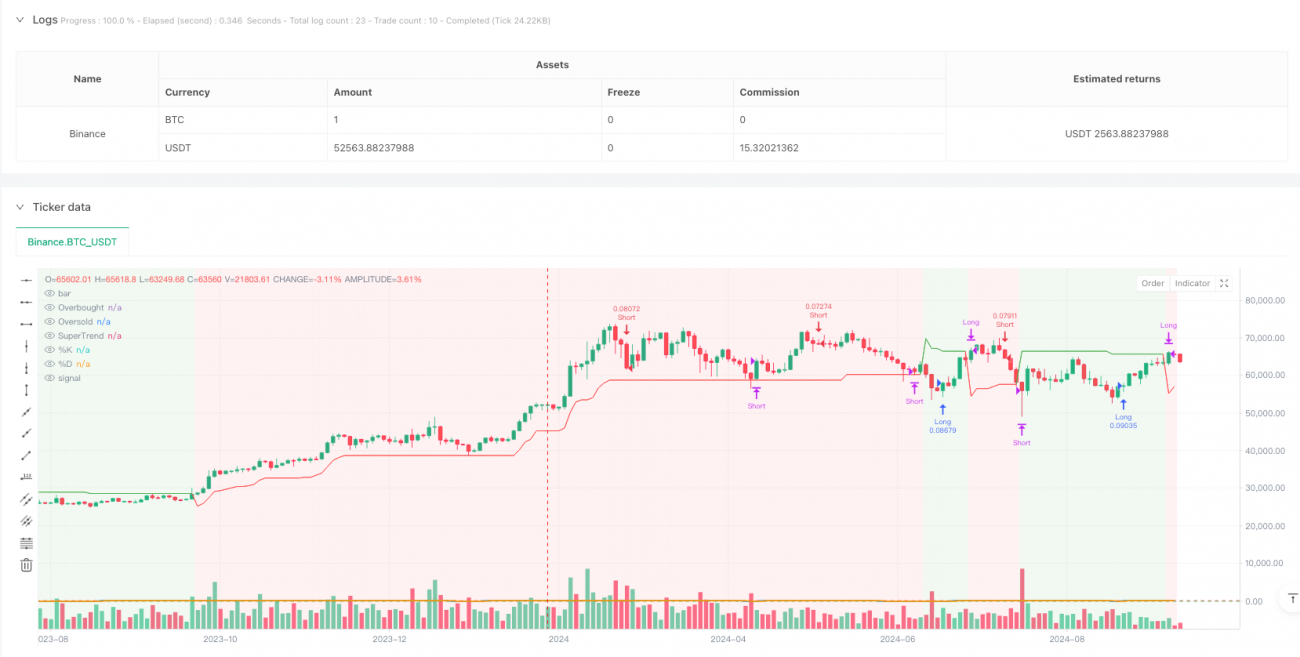
- Супертрендный индикатор: рассчитывается на основе ATR (средняя реальная волна) для определения рыночной тенденции. Когда индикаторная линия становится зеленой, она показывает тенденцию к росту, а когда она становится зеленой, она показывает тенденцию к снижению.
- Случайный индикатор: используется для идентификации состояния перекупа и перепродажи на рынке. Применяется параметровая настройка для %K-цикла 14, %D-цикла 3, уровень перекупа - 80, уровень перепродажи - 20.
Правила сделки следующие:
- Условия: СуперТренд показывает восходящий тренд (зеленый) и случайный индикатор %K линия сверху вниз через уровень перепродажи (20).
- Условия пробега: SuperTrend показывает нисходящий тренд (красный) и случайный индикатор %K сверху вниз через уровень перекупа (80).
- Условия бинарного опциона: SuperTrend переходит в нисходящий тренд, или случайный индикатор %K пересекает линию перекупа вниз
- Плоская конъюнктура: Супертенд переходит в восходящий тренд, или случайный индикатор %K пересекает линию перепродажи вверх
Стратегические преимущества
- Подтверждение тенденций: эффективное выявление основных тенденций рынка с помощью индикатора SuperTrend, чтобы снизить риск ложных прорывов
- Двигательная проверка: Двигательные сигналы в сочетании с случайными индикаторами для повышения точности и своевременности торгов
- Управление рисками: использование уровня перекупа и перепродажи в качестве ориентира для остановки убытков, обеспечивающего четкую структуру управления рисками
- Визуальные эффекты: стратегия предоставляет интуитивно понятный графический интерфейс, включающий изменения цвета трендового фона и индикаторных линий, чтобы помочь трейдерам понять состояние рынка
- Гибкость параметров: все ключевые параметры могут быть оптимизированы в соответствии с различными рыночными характеристиками
Стратегический риск
- Риск шокирующего рынка: возможны частые ложные сигналы, которые могут привести к чрезмерной торговле во время поперечной сборки
- Риск отставания: Супертенд и случайные индикаторы имеют определенную отсталость и могут упустить лучший момент входа
- Чувствительность параметров: различные параметры могут привести к значительно различным результатам сделки, которые требуют тщательного тестирования
- Зависимость от рыночной конъюнктуры: стратегия хорошо работает в условиях сильного тренда, но может работать плохо в условиях резкого колебания
- Конфликт сигналов: два показателя могут создавать противоречивые сигналы, поэтому необходимо установить четкие правила приоритета
Направление оптимизации стратегии
- Внедрение фильтра волатильности: можно добавить оценку ATR и приостановить торговлю при чрезмерной волатильности
- Оптимизация механизма подтверждения сигнала: можно рассмотреть возможность добавления вспомогательных показателей, таких как скользящая средняя, для повышения надежности сигнала
- Совершенствование механизма остановки убытков: рекомендуется добавить функцию отслеживания остановки убытков, чтобы лучше защитить полученную прибыль
- Дополнительная временная фильтрация: можно корректировать параметры стратегии или приостановить торговлю в зависимости от рыночных характеристик в разные периоды времени
- Разработка адаптивных параметров: разработка механизмов для адаптации параметров, приспособления параметров стратегии к динамике рынка
Подвести итог
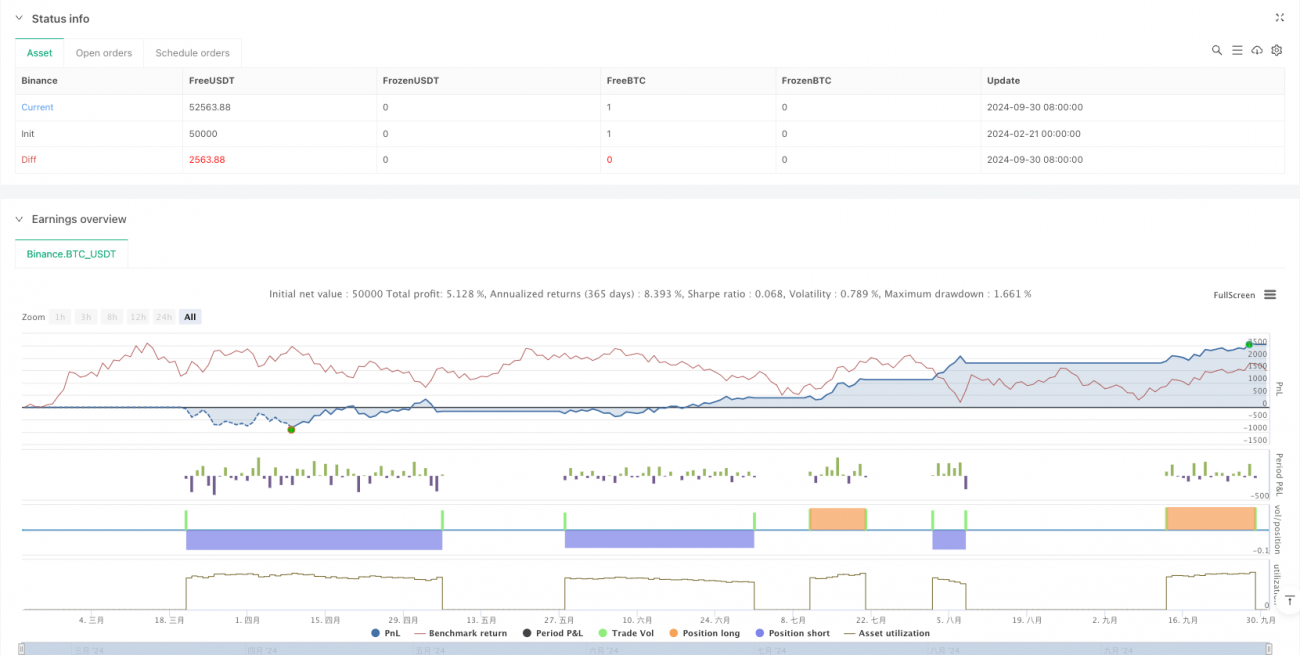
Эта стратегия, объединенная с отслеживанием тенденций и динамическим анализом, создает более полную торговую систему. Она не только обеспечивает четкие сигналы входа и выхода, но также включает в себя рамки для управления рисками и оптимизации параметров. Хотя существуют некоторые присущие риски, предоставление рекомендаций по оптимизации может дополнительно повысить стабильность и адаптацию стратегии.
/*backtest
start: 2024-02-21 00:00:00
end: 2024-10-01 00:00:00
period: 2d
basePeriod: 2d
exchanges: [{"eid":"Binance","currency":"BTC_USDT"}]
*/

//@version=5
strategy("SuperTrend + Stochastic Strategy", overlay=true, default_qty_type=strategy.percent_of_equity, default_qty_value=10)

// SuperTrend Settings- 1