Динамическая адаптивная многопериодная стратегия отслеживания тренда и разворота шока

Обзор
Стратегия представляет собой комплексную торговую систему, которая сочетает в себе отслеживание тенденций и торговлю в интервалах, идентификацию состояния рынка с помощью графиков в облаке Ichimoku, подтверждение динамики MACD и RSI сверхпокупки и перепродажи, а также использование ATR для динамического управления убытками. Стратегия способна улавливать трендовые возможности в трендовых рынках, искать возможности для обратного пути в волатильных рынках, обладает большой адаптивностью и гибкостью.
Стратегический принцип
Стратегия использует многоуровневый механизм подтверждения сигнала:
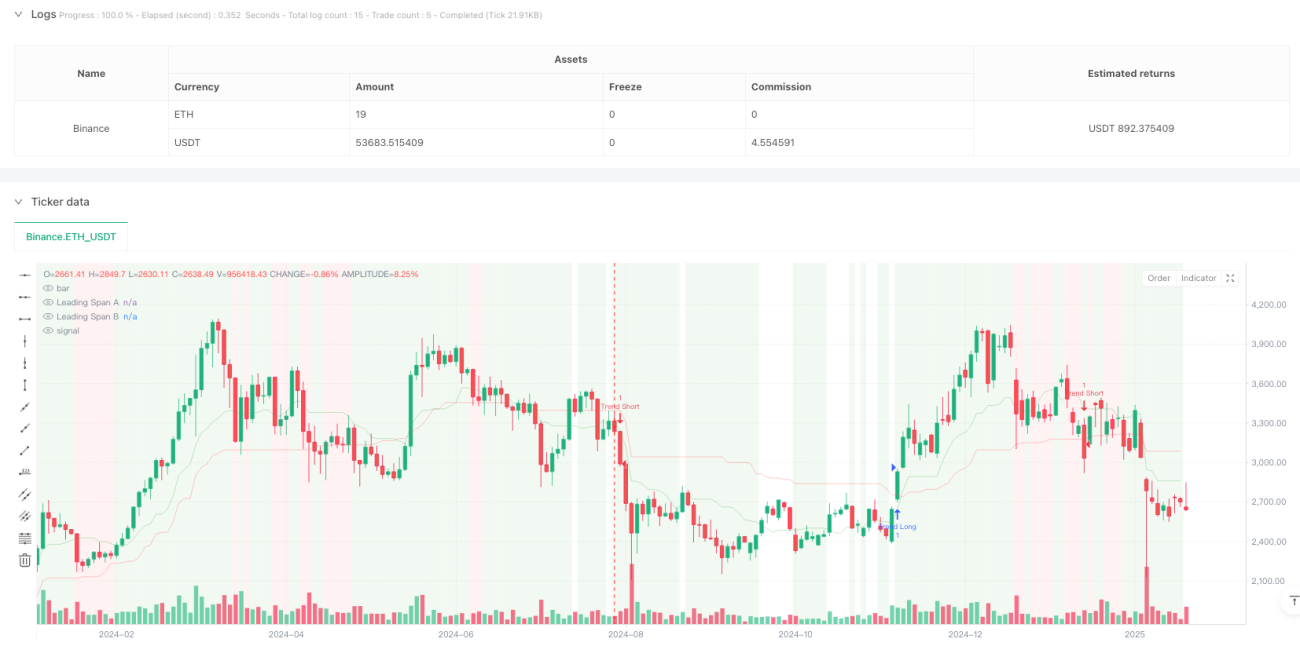
- Используя график облаков Ичимоку в качестве основной основы для определения состояния рынка, можно определить, находится ли рынок в состоянии тренда или колебания по отношению к цене и облаку.
- В трендовых рынках, когда цена находится выше облака и RSI > 55, MACD-постная диаграмма положительная, вход сделан сверх; когда цена находится ниже облака и RSI < 45, MACD-постная диаграмма отрицательная, вход сделан с нуля
- В волатильных рынках, когда RSI < 30 и случайный RSI < 20, искать больше возможностей; когда RSI > 70 и случайный RSI > 80, искать возможности дефляции
- Управление рисками с использованием динамического стоп-лоста на основе ATR, стоп-дистанция в 2 раза больше ATR
Стратегические преимущества
- Рыночная адаптивность: способность автоматически корректировать торговую стратегию в зависимости от различных рыночных условий, повышая стабильность стратегии
- Высокая надежность сигнала: применение механизма проверки с использованием нескольких показателей, снижает влияние ложных сигналов
- Управление рисками: с помощью ATR динамическая остановка убытков позволяет эффективно управлять рисками и обеспечить полный рост прибыли
- Хорошая визуализация: обозначение состояния рынка с помощью цветового фона, что позволяет трейдерам интуитивно понимать рыночную обстановку
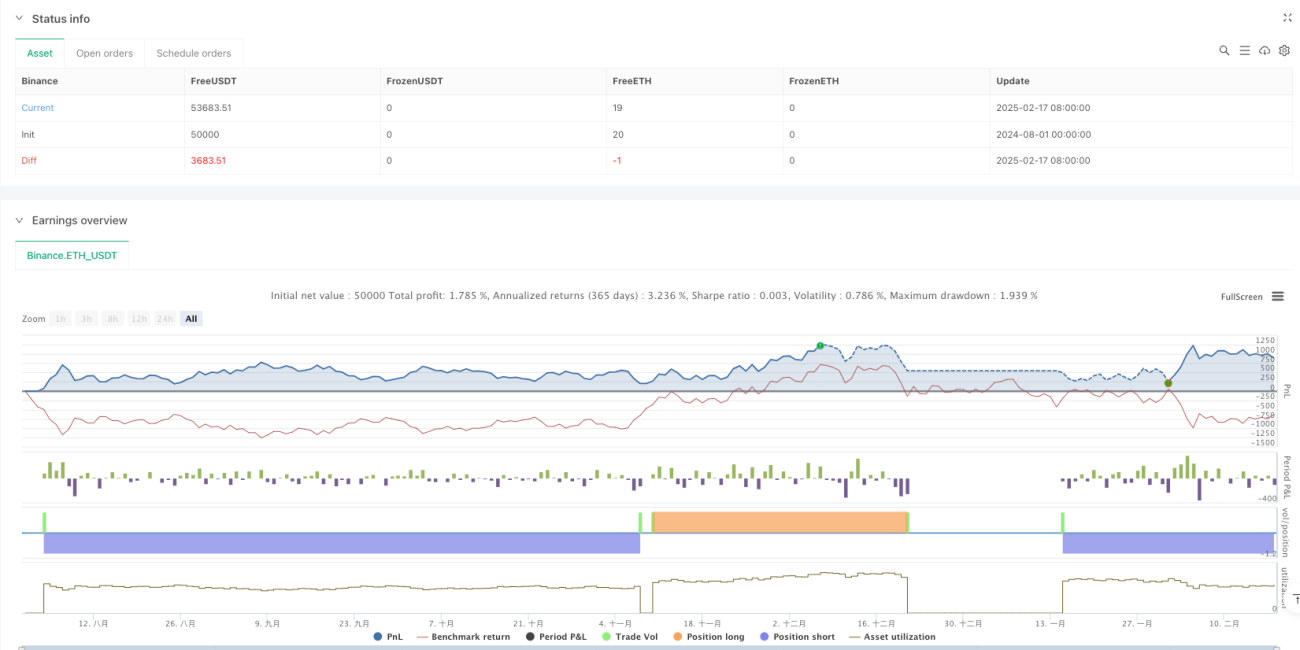
- Высокий временной цикл: с коэффициентом прибыли 2.159 на солнечном цикле, чистая прибыль достигла 10.71%
Стратегический риск
- Низкий уровень успеваемости: по всем временным периодам успеваемость ниже 40%, требуется большая психологическая выносливость
- Низкий временной цикл: 430 транзакций в 4-часовом цикле, низкая эффективность
- Сигнальная отсталость: возможно упущенные рыночные возможности из-за использования многомерной верификации
- Трудность оптимизации параметров: комбинация нескольких показателей увеличивает сложность оптимизации стратегии
Направление оптимизации стратегии
- Оптимизация фильтрации сигналов: можно повысить коэффициент выигрыша, скорректируя порог показателей
- Приспособность к временному циклу: рекомендуется использовать в основном в солнечных и более высоких циклах, параметры могут быть скорректированы в соответствии с различными рыночными характеристиками
- Оптимизация стоп-лосса: можно рассмотреть возможность корректировки ATR в зависимости от динамики различных рыночных условий
- Оптимизация времени входа: можно добавить подтверждение количества или подтверждение формы цены для повышения точности входа
- Оптимизация управления позицией: может быть разработана динамическая система управления позицией на основе силы сигнала
Подвести итог
Эта стратегия является разумно разработанной, логически четкой и интегрированной торговой системой, благодаря совместному использованию нескольких индикаторов, которая позволяет разумно идентифицировать состояние рынка и точно улавливать торговые возможности. Хотя в низких временных периодах есть некоторые проблемы, она превосходно работает в более высоких временных периодах, таких как дневная линия.
- 1