Стратегия торговли биткоинами по кросс-циклическому тренду, основанная на многоуровневой EMA и динамической потенциальной силе RSI

Обзор
Стратегия представляет собой торговую систему для отслеживания тенденций, основанную на кросс-циклическом анализе, которая сочетает в себе среднюю линию EMA на уровне орбитальной и дневной линии и индикатор RSI для идентификации тенденций и динамики рынка. Стратегия определяет торговые возможности с помощью согласованности тенденций в течение нескольких временных рамок и управляет рисками с помощью динамических остановок на основе ATR.
Стратегический принцип
Основная логика стратегии основана на следующих ключевых элементах:
- Использование EMA на уровне круговой линии в качестве основного фильтра тенденций, в сочетании с отношением к цене закрытия дневной линии к круговой EMA, чтобы определить состояние рынка
- Низкие значения, определяемые динамикой корректировки тренда по показателю ATR, повышают адаптивность стратегии
- Интеграция динамического индикатора RSI в качестве дополнительного условия фильтрации торгов
- Стропинг-система для отслеживания убытков на основе 7-дневного минимума и ATR
- Когда появляются предупреждающие сигналы о чрезмерном росте, стратегия приостанавливает открытие позиции, чтобы избежать риска
Стратегические преимущества
- Анализ нескольких временных рамок дает более полный взгляд на рынок и позволяет эффективно отфильтровывать ложные прорывы.
- Динамический стоп-механизм адаптируется к рыночной волатильности и обеспечивает гибкий контроль риска
- RSI динамический фильтр помогает подтвердить силу тренда и улучшить входную форму
- Система включает в себя раннее предупреждение о чрезмерной зависимости, чтобы избежать риска отмены
- Параметры стратегии адаптируемы для оптимизации в зависимости от различных рыночных условий
Стратегический риск
- Частые входы и выходы на криптовалютных рынках могут привести к увеличению стоимости торгов
- Сделки с 100%-ным капиталом имеют высокий риск вывода
- Зависимость от технических индикаторов может привести к несвоевременному реагированию на рыночные сбои
- Анализ нескольких временных рамок может вызвать противоречивые сигналы на разных уровнях.
- Следование за потерями может быть вызвано преждевременно при сильных колебаниях
Направление оптимизации стратегии
- Внедрение фильтров волатильности для уменьшения частоты торгов во время низкой волатильности
- Добавление системы управления позициями, изменение доли позиций в зависимости от динамики рынка
- Интеграция базовых показателей, предоставляющих дополнительные оценки рыночной ситуации
- Оптимизация параметров стоп-лосса для лучшего отслеживания различных этапов рынка
- Анализ объемов сделок для повышения точности определения тенденций
Подвести итог
Это целостная, логически ясная стратегия отслеживания тенденций. Стратегия может лучше улавливать основные тенденции с помощью анализа нескольких временных рамок и фильтрации динамических показателей. Хотя существуют некоторые присущие риски, в стратегии все еще есть большой простор для улучшения путем оптимизации параметров и добавления дополнительных показателей. Рекомендуется проводить полное отслеживание перед торговлей в реальном времени и корректировать параметры в соответствии с конкретной рыночной обстановкой.
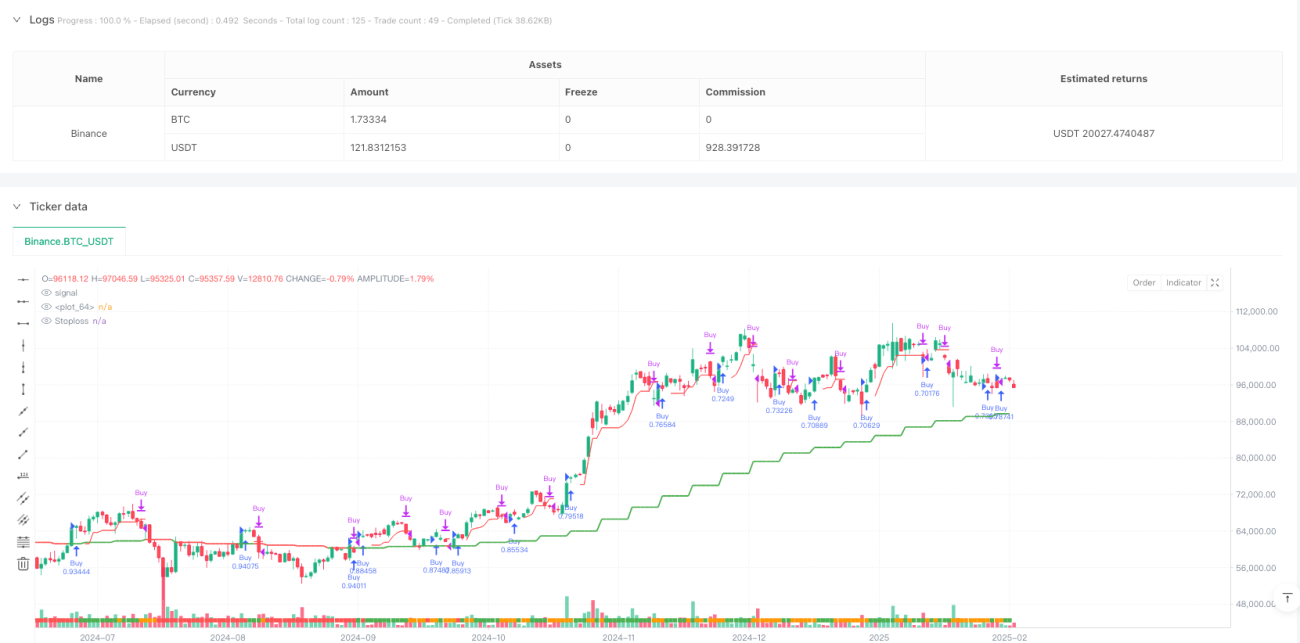
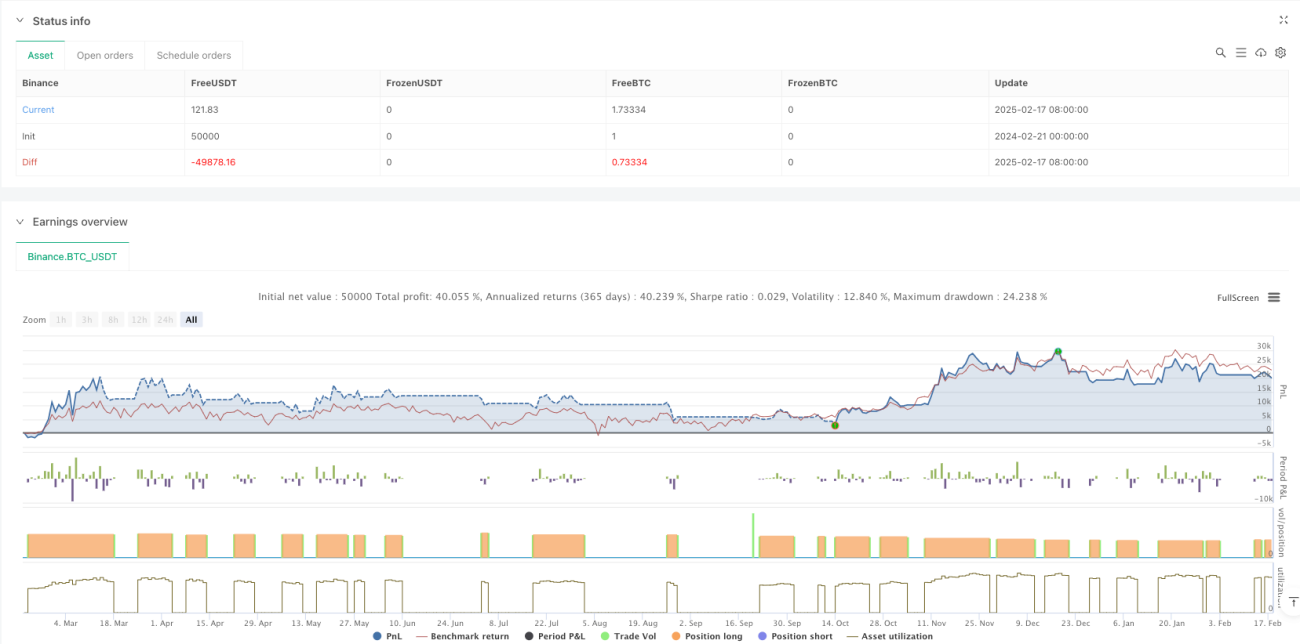
/*backtest
start: 2024-02-21 00:00:00
end: 2025-02-18 08:00:00
period: 1d
basePeriod: 1d
exchanges: [{"eid":"Binance","currency":"BTC_USDT"}]
*/

// @version=6
strategy("Bitcoin Regime Filter Strategy",         // Strategy name
     overlay=true,                                 // The strategy will be drawn directly on the price chart
initial_capital=10000, // Initial capital of 10000 USD- 1