
Обзор
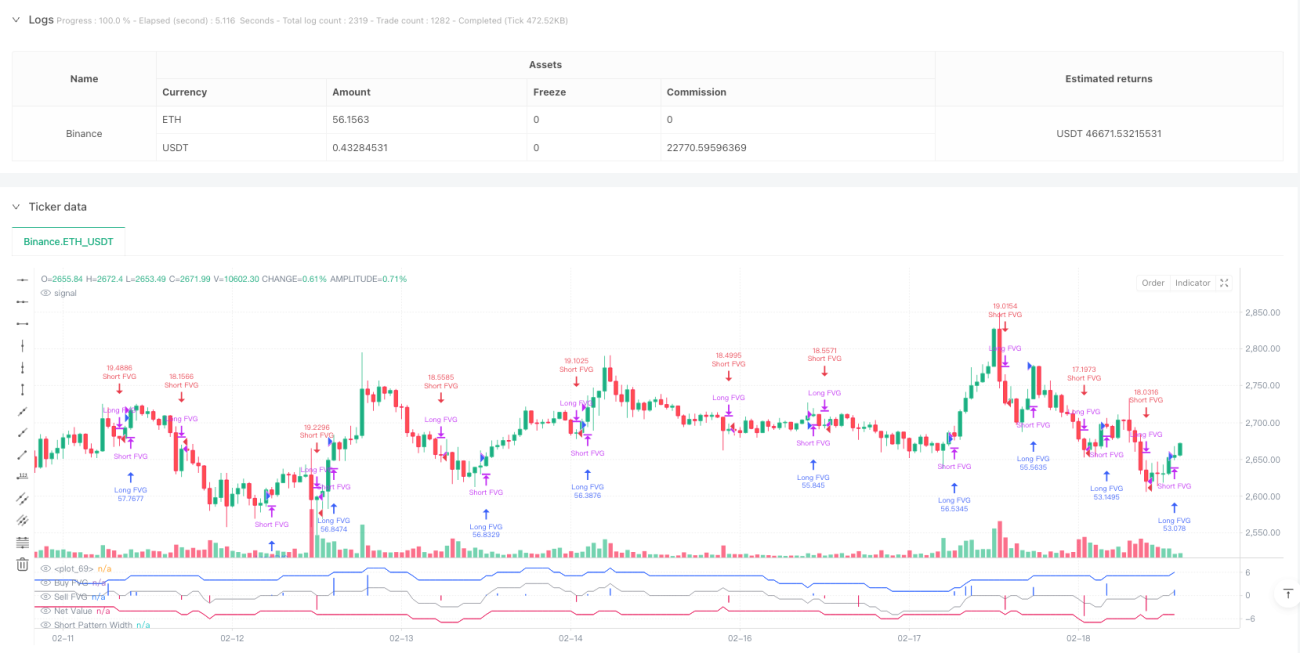
Эта стратегия является инновационной системой торговли, основанной на пробеле справедливой стоимости (FVG), которая захватывает потенциальные торговые возможности, идентифицируя ценовые разрывы и аномальные объемы торгов на рынке. Эта стратегия, в сочетании с механизмом динамического учета и унифицированной обработкой, не только позволяет точно идентифицировать сигналы купли-продажи, но и помогает трейдерам лучше понять структуру рынка с помощью визуальной демонстрации.
Стратегический принцип
В основе стратегии лежит выявление потенциальных торговых возможностей путем мониторинга ценовых пробелов между последовательными K-линиями. В частности:
- Условие формирования BFVG заключается в том, что минимальная цена текущей K-линии выше максимальной цены до двух K-линий
- Условие формирования FVG (SFVG) состоит в том, что максимальная цена текущей линии K ниже минимальной цены до двух линий K
- Стратегия вводит механизм верификации, основанный на объеме сделок и размере пробелов, и только FVG, удовлетворяющие условиям верификации, могут инициировать торговый сигнал
- Используйте динамическое окно подсчета 50 циклов для подсчета количества многомерных FVG
- Преобразование ширины отверстий в более интуитивно понятные показатели с помощью унификации
Стратегические преимущества
- Система имеет хорошо продуманный механизм проверки сигнала, чтобы повысить качество сигнала с помощью двойного подтверждения объема сделок и ширины пробелов
- Динамическое окно счета позволяет эффективно отслеживать изменения рыночных тенденций
- Унификация позволяет сравнивать сигналы разных периодов
- Стратегия имеет автоматическую функцию управления позициями, которая автоматически устраняет обратные позиции перед открытием новых позиций
- Отличная визуализация, которая помогает трейдерам понять состояние рынка
Стратегический риск
- Сигналы FVG могут создавать ложные сигналы на высоко волатильных рынках
- Фиксированные параметры проверки могут не применяться во всех рыночных условиях
- Не установленные механизмы остановки и остановки, которые могут привести к большему отступлению
- Частые транзакции могут привести к более высоким транзакционным затратам
Рекомендуется управлять этими рисками путем установления соответствующих стоп-позиций и внедрения фильтров рыночной среды.
Направление оптимизации стратегии
- Введение механизмов адаптивной корректировки параметров, позволяющих стратегии лучше адаптироваться к различным рыночным условиям
- Добавление фильтра на тренды, чтобы торговать только в одном направлении в сильных трендах
- Проектирование более сложных систем управления складом, включая строительство складов по партиям и динамическое остановку потерь
- Оптимизация частоты транзакций с учетом затрат на транзакции
- Повышение надежности сигнала в сочетании с другими техническими показателями
Подвести итог
Это инновационная торговая стратегия, основанная на ценовой структуре, для захвата рыночных возможностей путем интеллектуального выявления и проверки пробелов в справедливой стоимости. Концепция стратегии ясна, методы ее реализации профессиональны и обладают хорошей масштабируемостью.
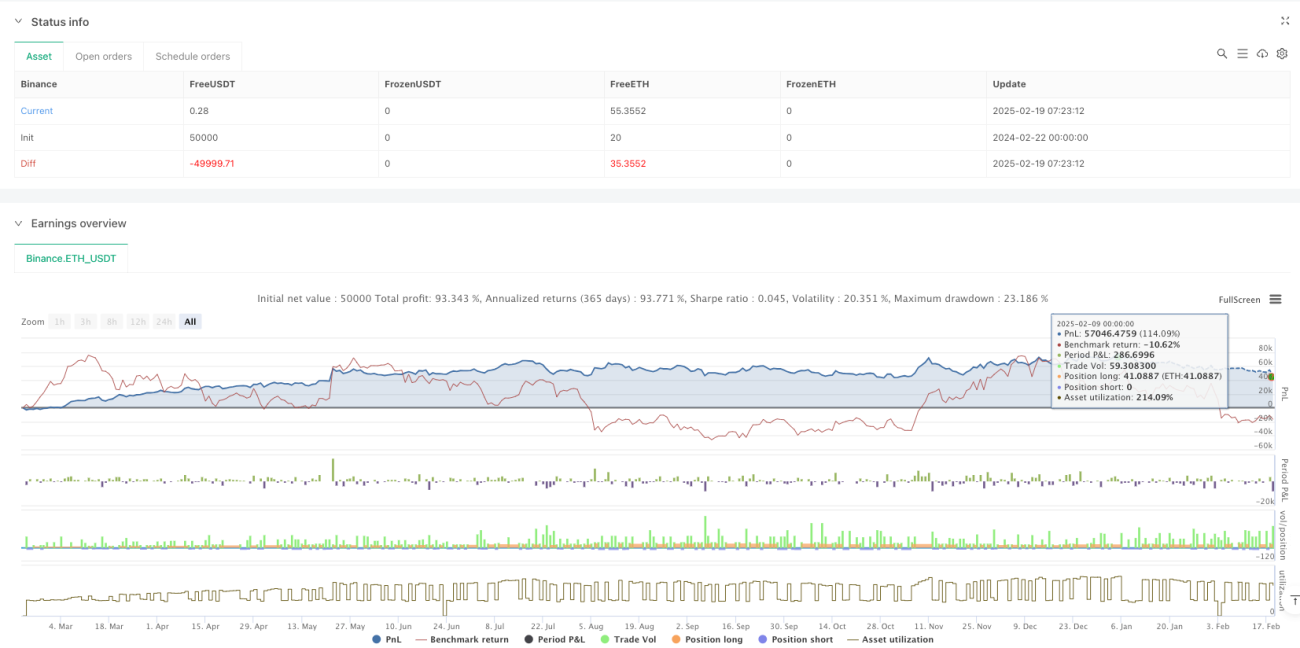
/*backtest
start: 2024-02-22 00:00:00
end: 2025-02-19 08:00:00
period: 1h
basePeriod: 1h
exchanges: [{"eid":"Binance","currency":"ETH_USDT"}]
*/

// ----------------------------------------------------------------------------
// This Pine Script™ code is subject to the terms of the Mozilla Public License
// 2.0 at https://mozilla.org/MPL/2.0/
// © OmegaTools- 1