Количественная торговая стратегия Triple Strike, основанная на множественных моделях K-линии

TLS ECS K-LINE MA PATTERN Trend momentum
Дата создания: 2025-02-21 11:00:33 Последнее изменение: 2025-02-27 17:12:20
Копировать: 1 Количество просмотров: 382
2
Подписаться
319
Подписчики

Количественная торговая стратегия Triple Strike, основанная на множественных моделях K-линии Количественная торговая стратегия Triple Strike, основанная на множественных моделях K-линии

Обзор

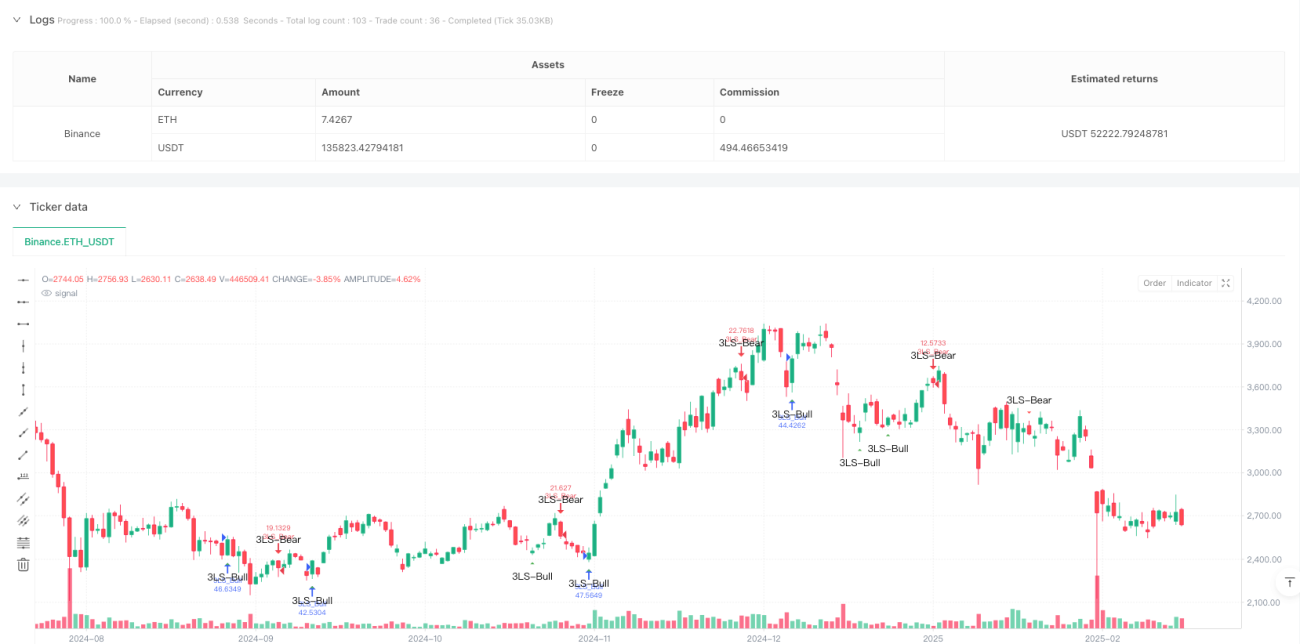
Это количественная торговая стратегия, основанная на трёхлинейной забастовке и поглощающей модели. Стратегия используется для принятия торговых решений в сочетании с несколькими техническими показателями, чтобы захватить рыночные трендовые переломы, идентифицировав три последовательных K-линейных формы. Стратегия разработала полную систему распознавания сигналов и механизм контроля риска, а также предлагает высоко настраиваемые параметры.

Стратегический принцип

Основная логика стратегии основана на двух основных K-линейных формах:

  1. Тройная ударная форма: для определения обратной K-линии, следующей за тремя последовательными одинаковыми K-линиями, используется обратная тенденция. Позитивная форма состоит из трех последовательных понижающихся красных K-линий, сопровождаемых более крупной зеленой поглощающей K-линией. Позитивная форма состоит из трех последовательных повышающихся зеленых K-линий, сопровождаемых более крупной красной поглощающей K-линией.
  2. Поглощающие формы: отдельные большие поглощающие K-линии также служат в качестве вспомогательного сигнала. Стратегия идентифицирует поглощающие формы, рассчитывая текущую K-линию и сравнивая ее с размерами объектов предыдущих K-линий.

Стратегические преимущества

  1. Точность распознавания сигнала: стратегия использует строгие математические расчеты для определения формы K-линии, чтобы гарантировать качество сигнала с помощью фильтрации с множеством условий.
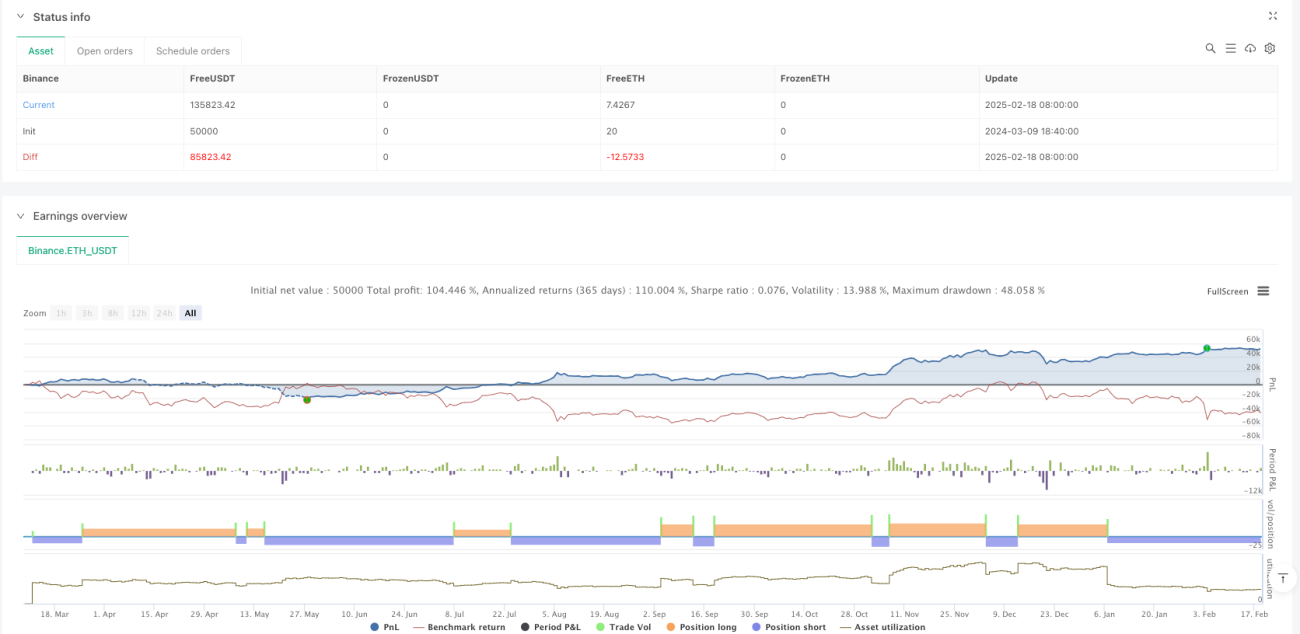
  2. Управление рисками: установлены параметры риска, такие как первоначальный капитал, доля позиций и запрет на повторное вхождение.
  3. Настраиваемость высоты: предоставляет богатые параметры, которые можно оптимизировать в соответствии с различными рыночными особенностями и потребностями торговли.
  4. Визуальная поддержка: предоставляет четкие графические маркировки и подсказки для удобства анализа и мониторинга.

Стратегический риск

  1. В зависимости от рыночной конъюнктуры: может быть слишком много ложных сигналов на колеблющихся рынках.
  2. Влияние скольжения: входные точки крупных поглощенных K-линий могут быть затронуты более крупным скольжением.
  3. Риск задержки: идентификация формы требует выполнения нескольких K-линий и может пропустить оптимальный момент входа.

Направление оптимизации стратегии

  1. Введение показателя трафика: для фильтрации качества сигнала в сочетании с изменениями трафика.
  2. Оптимизация стоп-установок: динамическая коррекция стоп-позиции на основе ATR или волатильности.
  3. Добавление фильтрации тенденций: добавление системы равномерных оценок общей тенденции.
  4. Улучшение механизмов выхода: создание более гибких условий для получения прибыли.

Подвести итог

Стратегия использует систематизированный метод технического анализа, чтобы захватить важные рыночные переломные моменты, имеет сильную теоретическую основу и практическую ценность. С помощью оптимизации параметров и совершенствования контроля риска она может быть важной частью здоровой торговой системы. Модульная конструкция стратегии также обеспечивает хорошую основу для дальнейшей оптимизации.

Overview

This is a quantitative trading strategy based on Three Line Strike and Engulfing patterns. The strategy captures market turning points by identifying breakthrough reversal candlesticks following three consecutive candles, combining multiple technical indicators for trading decisions. It features a complete signal detection system and risk control mechanism, with highly customizable parameter settings.

Strategy Principle

The core logic is based on two main candlestick patterns:

  1. Three Line Strike Pattern: Identifies trend reversals through three consecutive same-direction candles followed by a reversal candle. Bullish pattern consists of three consecutive red candles followed by a large green engulfing candle; bearish pattern consists of three consecutive green candles followed by a large red engulfing candle.
  2. Engulfing Pattern: Large single engulfing candles serve as auxiliary signals. The strategy identifies engulfing patterns by comparing the body size of current and previous candles.

Strategy Advantages

  1. Precise Signal Identification: Uses strict mathematical calculations to judge candlestick patterns, ensuring signal quality through multiple condition filtering.
  2. Comprehensive Risk Control: Includes risk parameters like initial capital and position sizing, with pyramiding prevention.
  3. Highly Customizable: Offers rich parameter settings for optimization according to different market characteristics and trading needs.
  4. Visual Support: Provides clear graphical markers and alert messages for analysis and monitoring.

Strategy Risks

  1. Market Environment Dependency: May generate excessive false signals in ranging markets.
  2. Slippage Impact: Entry points for large engulfing candles may be subject to significant slippage.
  3. Delay Risk: Pattern recognition requires multiple candles, potentially missing optimal entry points.

Optimization Directions

  1. Incorporate Volume Indicators: Filter signal quality by combining volume changes.
  2. Optimize Stop Loss Settings: Dynamically adjust stop loss positions based on ATR or volatility.
  3. Add Trend Filtering: Implement moving average systems to judge overall trend.
  4. Improve Exit Mechanism: Design more flexible profit-taking conditions.

Summary

The strategy captures important market turning points through systematic technical analysis, with strong theoretical foundation and practical value. Through parameter optimization and risk control refinement, it can serve as an important component of a robust trading system. The modular design also provides a good foundation for further optimization.

Исходный код стратегии
/*backtest
start: 2024-03-09 18:40:00
end: 2025-02-19 08:00:00
period: 1d
basePeriod: 1d
exchanges: [{"eid":"Binance","currency":"ETH_USDT"}]
*/

// Copyright ...
// Based on the TMA Overlay by Arty, converted to a simple strategy example.
// Pine Script v5

//@version=5
strategy(title='3 Line Strike [TTF] - Strategy',
     shorttitle='3LS Strategy [TTF]',
     overlay=true,
     initial_capital=100000,
     default_qty_type=strategy.percent_of_equity,
     default_qty_value=100,
     pyramiding=0)

// -----------------------------------------------------------------------------
//                               INPUTS
// -----------------------------------------------------------------------------

//
// ### 3 Line Strike
//
showBear3LS = input.bool(title='Show Bearish 3 Line Strike', defval=true, group='3 Line Strike',
     tooltip="Bearish 3 Line Strike (3LS-Bear) = 3 green candles followed by a large red candle (engulfing).")
showBull3LS = input.bool(title='Show Bullish 3 Line Strike', defval=true, group='3 Line Strike',
     tooltip="Bullish 3 Line Strike (3LS-Bull) = 3 red candles followed by a large green candle (engulfing).")
showMemeChars = input.bool(title="Plot 3 Line Strike meme symbols", defval=false, group="3 Line Strike")

//
//### Engulfing Candles
//
showBearEngulfing= input.bool(title='Show Bearish Big Candles', defval=false, group='Big Candles')
showBullEngulfing= input.bool(title='Show Bullish Big Candles', defval=false, group='Big Candles')

//
//### Alerts
//
void = input.bool(title="(Info) Alerts are based on detected signals.", defval=true)

// -----------------------------------------------------------------------------
//                          HELPER FUNCTIONS
// -----------------------------------------------------------------------------

// Function: Get the 'color' of the candle: -1 = red, 0 = doji, +1 = green
getCandleColorIndex(barIndex) =>
    int ret = na
    if (close[barIndex] > open[barIndex])
        ret := 1
    else if (close[barIndex] < open[barIndex])
        ret := -1
    else
        ret := 0
    ret

// Function: Check if the candle is engulfing (based on the body size of the candles)
isEngulfing(checkBearish) =>
    // Size of the previous candle
    sizePrevCandle = close[1] - open[1]
    // Size of the current candle
    sizeCurrentCandle = close - open
    isCurrentLargerThanPrevious = math.abs(sizeCurrentCandle) > math.abs(sizePrevCandle)
    
    // Bearish / Bullish division
    if checkBearish
        // Bearish engulfing: previous green, current larger red
        isGreenToRed = (getCandleColorIndex(0) < 0) and (getCandleColorIndex(1) > 0)
        isCurrentLargerThanPrevious and isGreenToRed
    else
        // Bullish engulfing: previous red, current larger green
        isRedToGreen = (getCandleColorIndex(0) > 0) and (getCandleColorIndex(1) < 0)
        isCurrentLargerThanPrevious and isRedToGreen

// Simplified calls for bullish/bearish engulfing
isBearishEngulfing() => isEngulfing(true)
isBullishEngulfing() => isEngulfing(false)

// Function: 3 consecutive candles of one color followed by the opposite engulfing candle
// 3 Line Strike - Bearish
is3LSBear() =>
    // Three consecutive green candles?
    is3LineSetup = (getCandleColorIndex(1) > 0) and (getCandleColorIndex(2) > 0) and (getCandleColorIndex(3) > 0)
    // Followed by Bearish engulfing
    is3LineSetup and isBearishEngulfing()

// 3 Line Strike - Bullish
is3LSBull() =>
    // Three consecutive red candles?
    is3LineSetup = (getCandleColorIndex(1) < 0) and (getCandleColorIndex(2) < 0) and (getCandleColorIndex(3) < 0)
    // Followed by Bullish engulfing
    is3LineSetup and isBullishEngulfing()

// -----------------------------------------------------------------------------
//                             SIGNALS
// -----------------------------------------------------------------------------

// ### 3 Line Strike
is3LSBearSig = is3LSBear()
is3LSBullSig = is3LSBull()

// Meme icons vs. standard shapes
plotchar(showBull3LS and showMemeChars ? is3LSBullSig : na, char="🍆", color=color.rgb(0, 255, 0, 0),
         location=location.belowbar, size=size.tiny, text='3LS-Bull', title='3 Line Strike Up (Meme Icon)', editable=false)
plotchar(showBear3LS and showMemeChars ? is3LSBearSig : na, char="🍑", color=color.rgb(255, 0, 0, 0),
         location=location.abovebar, size=size.tiny, text='3LS-Bear', title='3 Line Strike Down (Meme Icon)', editable=false)

plotshape(showBull3LS and not showMemeChars ? is3LSBullSig : na, style=shape.triangleup,
         color=color.green, location=location.belowbar, size=size.small, text='3LS-Bull', title='3 Line Strike Up')
plotshape(showBear3LS and not showMemeChars ? is3LSBearSig : na, style=shape.triangledown,
         color=color.red, location=location.abovebar, size=size.small, text='3LS-Bear', title='3 Line Strike Down')

// ### Engulfing Candles
isBullEngulfingSig = isBullishEngulfing()
isBearEngulfingSig = isBearishEngulfing()

plotshape(showBullEngulfing ? isBullEngulfingSig : na, style=shape.triangleup,
         location=location.belowbar, color=color.new(color.green,0), size=size.tiny, title='Big Candle Up')
plotshape(showBearEngulfing ? isBearEngulfingSig : na, style=shape.triangledown,
         location=location.abovebar, color=color.new(color.red,0), size=size.tiny, title='Big Candle Down')

// -----------------------------------------------------------------------------
//                               ALERTS
// -----------------------------------------------------------------------------

// 3LS - "Old" alertcondition + "New" alert() (based on what people use)
alertcondition(showBull3LS and is3LSBullSig, title='Bullish 3 Line Strike',
     message='{{exchange}}:{{ticker}} {{interval}} - Bullish 3 Line Strike')
alertcondition(showBear3LS and is3LSBearSig, title='Bearish 3 Line Strike',
     message='{{exchange}}:{{ticker}} {{interval}} - Bearish 3 Line Strike')

if (showBull3LS and is3LSBullSig)
    m = syminfo.tickerid + ' ' + timeframe.period + ' - Bullish 3 Line Strike'
    alert(message=str.tostring(m), freq=alert.freq_once_per_bar_close)

if (showBear3LS and is3LSBearSig)
    m = syminfo.tickerid + ' ' + timeframe.period + ' - Bearish 3 Line Strike'
    alert(message=str.tostring(m), freq=alert.freq_once_per_bar_close)

// Engulfing - "Old" alertcondition + "New" alert()
alertcondition(showBullEngulfing and isBullEngulfingSig, title='Bullish Engulfing',
     message='{{exchange}}:{{ticker}} {{interval}} - Bullish candle engulfing previous candle')
alertcondition(showBearEngulfing and isBearEngulfingSig, title='Bearish Engulfing',
     message='{{exchange}}:{{ticker}} {{interval}} - Bearish candle engulfing previous candle')

if (showBullEngulfing and isBullEngulfingSig)
    m = syminfo.tickerid + ' ' + timeframe.period + ' - Bullish candle engulfing previous candle'
    alert(message=str.tostring(m), freq=alert.freq_once_per_bar_close)

if (showBearEngulfing and isBearEngulfingSig)
    m = syminfo.tickerid + ' ' + timeframe.period + ' - Bearish candle engulfing previous candle'
    alert(message=str.tostring(m), freq=alert.freq_once_per_bar_close)

// -----------------------------------------------------------------------------
//                          STRATEGY ENTRY ORDERS
// -----------------------------------------------------------------------------
//
// Logic for entering trades. If display is enabled and a signal is detected, a trade will be entered.
//
// 3 Line Strike
if (showBull3LS and is3LSBullSig)
    strategy.entry("3LS_Bull", strategy.long, comment="3LS Bullish")

if (showBear3LS and is3LSBearSig)
    strategy.entry("3LS_Bear", strategy.short, comment="3LS Bearish")

// Engulfing
if (showBullEngulfing and isBullEngulfingSig)
    strategy.entry("BullEngulf", strategy.long, comment="Bullish Engulfing")

if (showBearEngulfing and isBearEngulfingSig)
    strategy.entry("BearEngulf", strategy.short, comment="Bearish Engulfing")

//
// End of script