Адаптивная трендовая торговая стратегия с интеграцией нескольких индикаторов

Обзор
Данная стратегия представляет собой адаптивную трендовую торговую систему, объединяющую несколько технических индикаторов. Она сочетает в себе системы скользящих средних (EMA), индикатор импульса (RSI), трендовый индикатор (MACD) и SuperTrend для подтверждения сигналов, а также оснащена полноценным механизмом управления рисками, включающим стоп-лосс, тейк-профит и трейлинг-стоп. Конструкция стратегии в полной мере учитывает волатильность рынка, повышая стабильность и надежность торговли за счет многоуровневой фильтрации сигналов и контроля рисков.
Принцип стратегии
Стратегия использует многоуровневый механизм подтверждения сигналов:
- Первоначальное направление тренда определяется по пересечению 9- и 21-периодных EMA.
- Для фильтрации перекупленности/перепроданности используется RSI (14): сигнал на покупку требует RSI>40 и <70, сигнал на продажу – RSI<60 и >30.
- Индикатор MACD подтверждает импульс тренда, требуя совпадения направления сигнальной линии и линии MACD.
- Индикатор SuperTrend предоставляет дополнительное подтверждение тренда.
- Управление рисками осуществляется с помощью стоп-лосса в 5%, тейк-профита в 10%, трейлинг-стопа в 2% и уровня безубыточности в 1%.
Торговый сигнал генерируется только при одновременном выполнении всех условий, что эффективно снижает риск ложных пробоев.
Преимущества стратегии
- Многоуровневый механизм подтверждения сигналов значительно снижает помехи от ложных сигналов.
- Полноценная система контроля рисков, включающая фиксированный стоп-лосс, трейлинг-стоп и стоп-лосс по безубыточности.
- Стратегия обладает хорошей адаптивностью и может подстраиваться под различные рыночные условия.
- Логика входа и выхода ясна, проста для понимания и поддержки.
- Торговая логика имеет надежную теоретическую основу; каждый индикатор выполняет свою определенную функцию.
Риски стратегии
- Многоуровневое подтверждение сигналов может привести к пропуску некоторых важных торговых возможностей.
- На сильно волатильных рынках фиксированные уровни стоп-лосса могут быть недостаточно гибкими.
- Оптимизация параметров может привести к переобучению на исторических данных.
- Множество индикаторов могут генерировать противоречивые сигналы на боковом рынке.
Решения включают: динамическую корректировку параметров стоп-лосса, внедрение индикатора волатильности, регулярную реоптимизацию параметров и т.д.
Направления оптимизации стратегии
- Внедрение механизма адаптивных параметров, динамически корректирующих параметры в зависимости от рыночной волатильности.
- Добавление индикатора объема в качестве вспомогательного инструмента подтверждения.
- Оптимизация механизма стоп-лосса, внедрение динамического стоп-лосса на основе ATR.
- Добавление модуля идентификации рыночной среды, использующего различные наборы параметров в разных рыночных условиях.
- Разработка системы оптимизации параметров на основе машинного обучения.
Заключение
Данная стратегия создает надежную торговую систему за счет синергии многомерных технических индикаторов. Полноценный механизм контроля рисков и четкая торговая логика обеспечивают ее практическую применимость. Несмотря на наличие некоторого потенциала для оптимизации, базовая структура стратегии имеет прочную теоретическую основу. Путем постоянной оптимизации и улучшения ее торговые результаты могут быть дополнительно повышены.
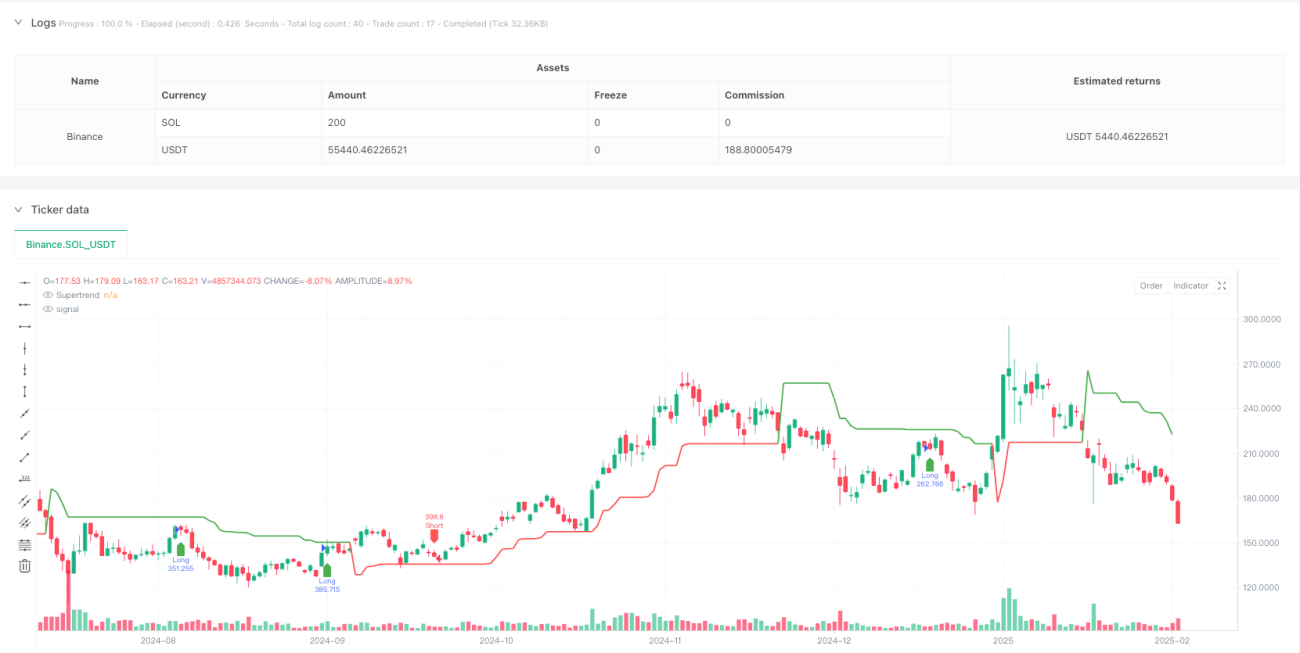
/*backtest
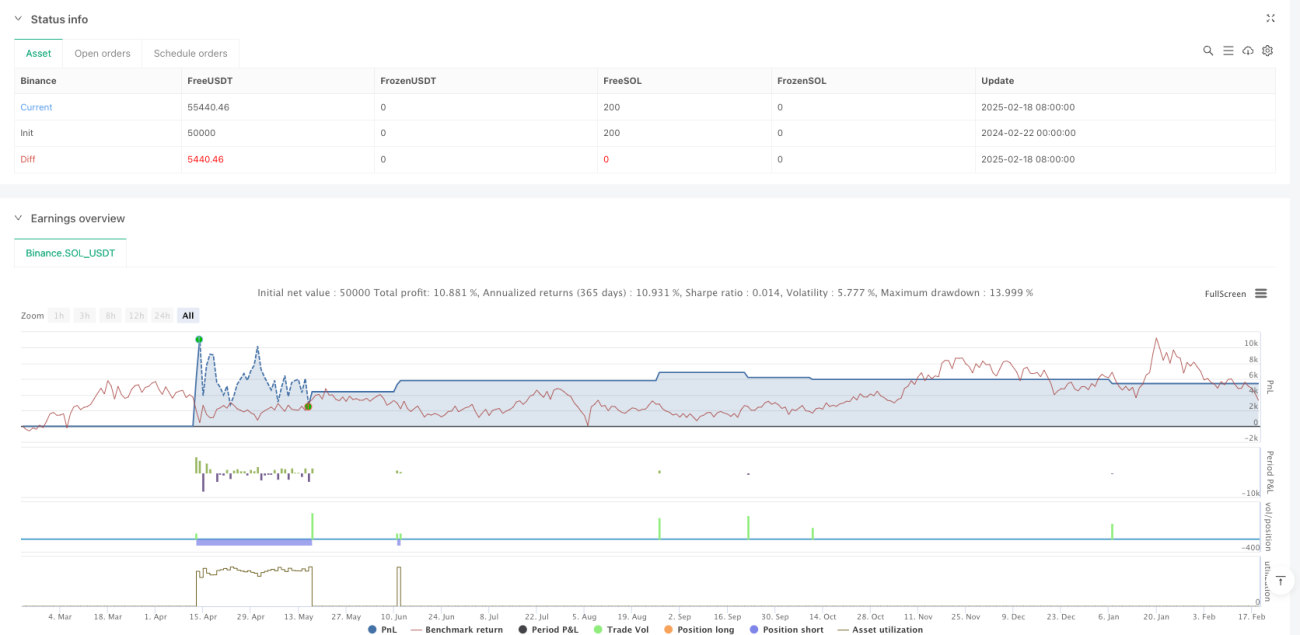
start: 2024-02-22 00:00:00
end: 2025-02-19 08:00:00
period: 1d
basePeriod: 1d
exchanges: [{"eid":"Binance","currency":"SOL_USDT"}]
*/
//@version=5
strategy("Optimized BTC Trading Strategy v2", overlay=true, default_qty_type=strategy.percent_of_equity, default_qty_value=100, commission_type=strategy.commission.percent, commission_value=0.1)
// Input parameters- 1