
Обзор
Эта стратегия является системой торговли с отслеживанием тенденций, основанной на прорыве Дончианского канала, в сочетании с индикатором супертенденции и фильтром объема сделок для повышения надежности торговых сигналов. Эта стратегия в основном идентифицирует потенциальные многосторонние торговые возможности путем захвата исторических максимумов ценовых прорывов, а также использует подтверждение объема сделок и индикаторы отслеживания тенденций для фильтрации ложных сигналов прорыва.
Стратегический принцип
Основная логика стратегии основана на следующих ключевых компонентах:
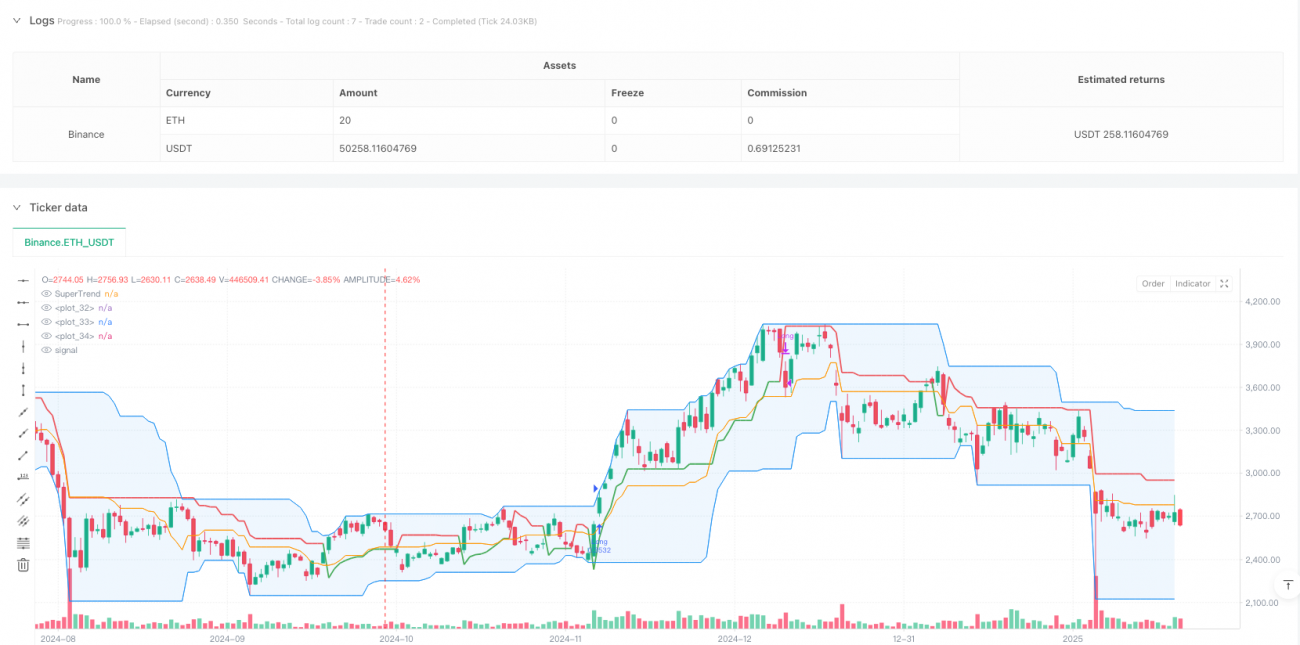
- Туньцзянский канал: вычисляет максимальные и минимальные цены в течение цикла, определенного пользователем, формируя верхние, нижние и средние треки. Когда цена прорывается вверх, запускается многоголовый входный сигнал.
- Фильтр объема сделок: повышает надежность прорыва, сравнивая текущий объем сделок с 20-циклической скользящей средней, гарантируя, что вы выходите в игру только при увеличении объема сделок.
- Супертенденционный индикатор: в качестве инструмента для подтверждения тренда, он отображается в зеленом цвете при многоголовном тренде, а в красном цвете при белом тренде.
- Гибкий механизм остановки: предлагает четыре различных варианта остановки, включая остановку на нижней полосе, остановку на средней полосе, остановку на супертенденции и остановку на процентном отслеживании.
Стратегические преимущества
- Подтверждение множественных сигналов: в сочетании с ценовым прорывом, подтверждением объема сделок и индикаторами тренда, значительно снижает риск ложного прорыва.
- Приспосабливаемость: с помощью параметров можно адаптироваться к различным рыночным условиям и торговым циклам.
- Управление рисками: предлагается множество вариантов погашения убытков, которые можно выбрать наиболее подходящим способом погашения убытков в зависимости от особенностей рынка.
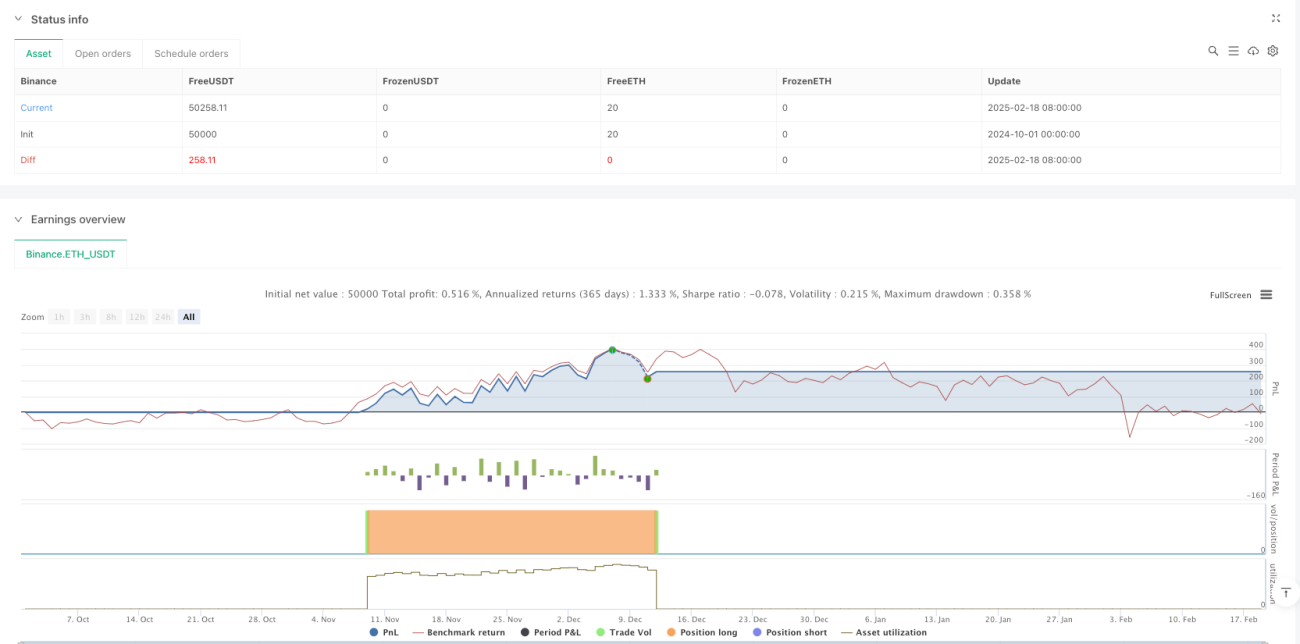
- Визуализация: стратегический интерфейс визуально отображает различные показатели, чтобы помочь трейдерам понять состояние рынка.
- Гибкость отслеживания: позволяет настраивать диапазон времени отслеживания для оптимизации стратегии.
Стратегический риск
- Риск рыночных потрясений: возможны частые ложные сигналы прорыва в период колебаний.
- Риск скольжения: в менее ликвидном рынке сигнал прорыва может привести к отклонению цены входа из-за скольжения.
- Риск чрезмерного фильтрации: включение фильтрации объема транзакций может привести к упущению некоторых эффективных торговых возможностей.
- Чувствительность параметров: Эффект стратегии чувствителен к настройкам параметров и требует тщательной оптимизации.
Направление оптимизации стратегии
- Добавление фильтра силы тренда: можно добавить индикаторы силы тренда, такие как ADX, и играть только тогда, когда тренд силен.
- Оптимизация показателя загруженности: можно рассмотреть возможность использования показателя загруженности или показателя загруженности вместо простой скользящей средней.
- Добавление временного фильтра: добавление временного окна торговли, чтобы избежать больших колебаний на рынке.
- Оптимизация динамических параметров: автоматическая коррекция канальных циклов и параметров супертенденции в зависимости от рыночных колебаний.
- Внедрение машинного обучения: оптимизация выбора параметров и фильтрации сигналов с использованием алгоритмов машинного обучения.
Подвести итог
Эта стратегия использует несколько технических показателей, чтобы создать относительно совершенную торговую систему для отслеживания тенденций. Преимущества стратегии заключаются в высокой надежности сигнала, гибкости управления рисками, но все еще требуют от трейдера оптимизации параметров в соответствии с конкретными рыночными характеристиками. Благодаря постоянному улучшению и оптимизации эта стратегия может обеспечить стабильную торговую эффективность на трендовых рынках.
- 1