Расширенная стратегия разворота на основе RSI и объема в количественной торговле

2
Follow
478
Followers
Обзор
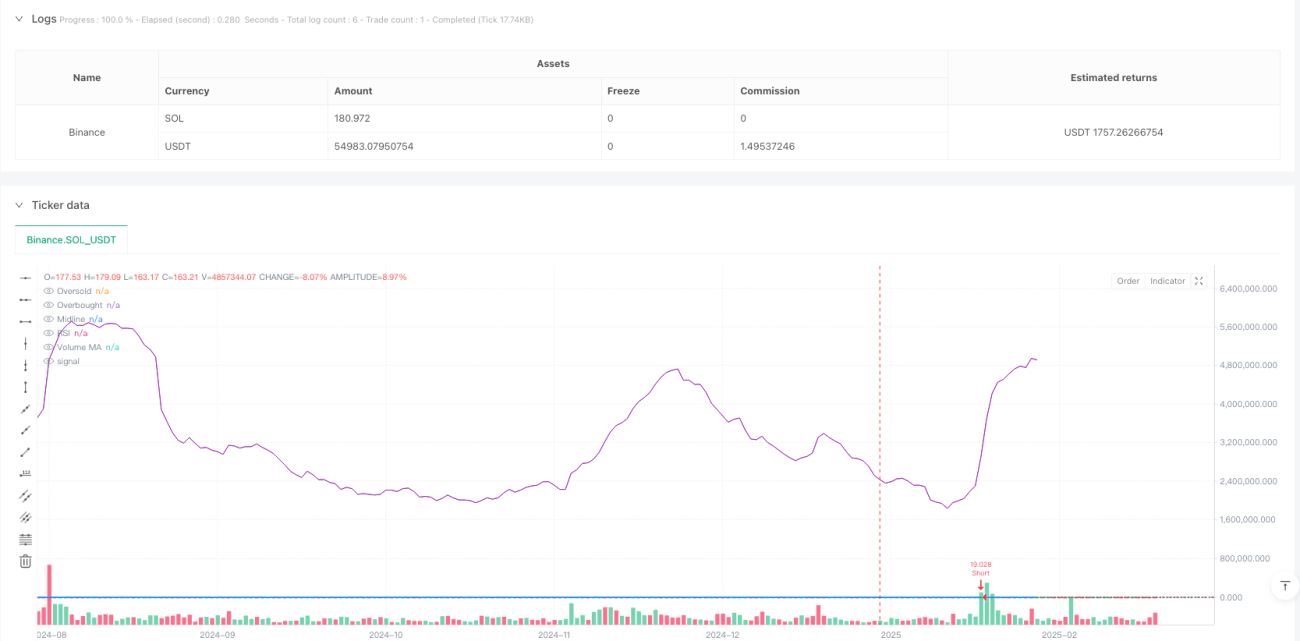
Это стратегия обратного трейдинга, основанная на RSI и объемах сделок. Стратегия заключается в том, чтобы идентифицировать состояние перекупа и перепродажи на рынке, объединить подтверждение объема сделок и совершить обратную торговлю при экстремальных состояниях цен.
Стратегический принцип
Стратегия основана на следующих ключевых компонентах:
- Расчет RSI: использование RSI на 14 циклов для мониторинга динамики цен
- Подтверждение объема сделок: с использованием 20-циклического объема сделок (движущаяся средняя ((SMA))
- Входная логика:
- Многоголовый вход: когда RSI ниже 30 (перепродажа) и объем сделки выше его скользящей средней
- Пустой вход: когда RSI выше 70 (сверхпокупка) и объем сделки выше его скользящей средней
- Логика выхода:
- Многоголовый матч: 50 на RSI
- Боссовый старт: 50 под RSI
Стратегические преимущества
- Систематизированные торговые решения: создание объективной торговой системы с помощью четкого сочетания технических показателей
- Механизм многократного подтверждения: объединение двух измерений RSI и объема сделок для повышения надежности сигнала
- Отличное управление рисками: использование процентного управления капиталом и запрет на повторное создание складов
- Визуализация: включает в себя полный диаграммный дисплей для удобства анализа и мониторинга
- Адаптируемость: основные параметры могут быть настроены для различных рыночных условий
Стратегический риск
- Риск продолжения тренда: во время сильного тренда, обратная стратегия может часто приносить убытки
- Риск ложного прорыва: высокий объем сделок не обязательно означает реальный рыночный поворот
- Чувствительность параметров: выбор циклов RSI и перекупа и перепродажи имеет существенное влияние на эффективность стратегии
- Влияние скольжения: цены на сделки могут значительно отклониться от ожиданий в периоды сильной волатильности
- Риски по управлению капиталом: фиксированные ставки могут быть слишком радикальными в определенных рыночных условиях
Направление оптимизации стратегии
- Тренд-фильтрация: внедрение индикаторов для определения тренда, чтобы избежать обратной торговли во время сильной тенденции
- Динамические параметры: перекуп и перепродажа на RSI, динамически скорректированный на основе рыночной волатильности
- Оптимизация выхода: увеличение механизмов остановки и отслеживания убытков, повышение способности к контролю риска
- Улучшение анализа объема сдачи: добавление анализа формы сдачи для улучшения качества сигнала
- Временная фильтрация: добавление временных окон для торгов, чтобы избежать неэффективных периодов торгов
Подвести итог
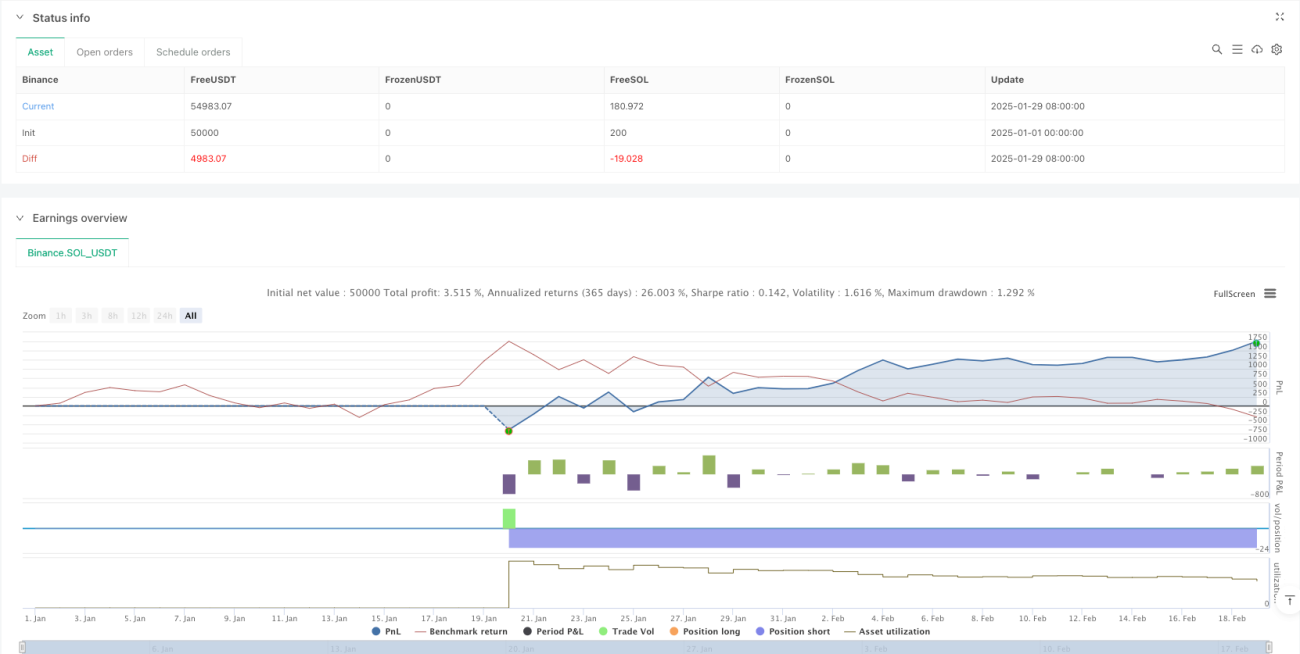
Стратегия в сочетании с показателями RSI и анализом объема сделок создает полную систему обратного трейдинга. Стратегия разработана рационально, имеет хорошую работоспособность и гибкость.
Source
Pine
/*backtest
start: 2025-01-01 00:00:00
end: 2025-02-19 08:00:00
period: 1d
basePeriod: 1d
exchanges: [{"eid":"Binance","currency":"SOL_USDT"}]
*/

//@version=5
strategy("RSI & Volume Contrarian Strategy", overlay=true, initial_capital=100000, default_qty_type=strategy.percent_of_equity, default_qty_value=10, pyramiding=0)

//---------------------------Strategy parameters
Related strategies
Comment
All comments (0)
No data
- 1