
Обзор
Эта стратегия является интеллектуальной торговой системой, основанной на нескольких технических показателях, объединяющих три основных технических показателя: Bollinger Bands, Stochastic Oscillator и Average True Rate (ATR), для выявления потенциальных торговых возможностей путем комплексного анализа волатильности, динамики и тенденций рынка. Стратегия использует динамическую установку стоп-стоп и прибыльных целей, которая позволяет автоматически корректировать торговые параметры в зависимости от рыночных колебаний.
Стратегический принцип
Основная логика стратегии основана на механизме тройной проверки:
- Определение диапазона колебаний цены с использованием буринской полосы, для выявления возможности перепродажи при прорыве цены вниз по буринской полосе, для выявления возможности перекупа при прорыве вверх по ней
- Подтверждение динамики с помощью случайных индикаторов в зоне сверхпокупа ((> 80) и зоне сверхпродажи ((< 20), пересечение %K-линий и %D-линий в качестве входного сигнала
- Введение показателя ATR в качестве фильтра на волатильность, чтобы обеспечить торговлю при достаточной поддержке рыночной волатильности
Для создания торгового сигнала необходимо выполнение следующих условий:
Условия покупки:
- Цены закрылись ниже пояса Брин
- Случайный индикатор %K пересекает %D вверх в зоне перепродажи
- ATR выше установленного порога, подтверждая достаточную волатильность рынка
Условия продажи:
- Цены закрылись выше рельсов по Бринскому поясу
- Случайная линия %K пересекает линию %D вниз в зоне перекупа
- ATR остается выше минусовой стоимости, подтверждая эффективность сделки
Стратегические преимущества
- Круговая проверка многочисленных технических показателей значительно повышает надежность торговых сигналов
- Динамическая установка стоп-лосс и прибыльных целей с автоматической корректировкой параметров управления рисками в соответствии с волатильностью рынка
- Механизм волатильной фильтрации эффективно избегает ложных сигналов в период низких колебаний
- Параметры индикатора могут быть гибко адаптированы в зависимости от различных рыночных условий и имеют хорошую адаптивность
- Ясная логика стратегии, легко понятная и реализуемая, подходящая для использования трейдерами всех уровней
Стратегический риск
- В случае резких рыночных колебаний могут возникнуть скольжения, влияющие на фактическую цену исполнения.
- Использование нескольких показателей может привести к задержке сигнала и упущению оптимального времени входа в игру.
- Оптимизация параметров может привести к перенастройке и повлиять на эффективность стратегии в реальном мире.
- В то же время, в некоторых странах, например, в Китае, в некоторых странах, например, в Китае, в Китае, в Китае, в Китае, в Китае, в Китае, в Китае, в Китае, в Китае, в Китае, в Китае.
- Торговые издержки и комиссионные могут повлиять на общую прибыльность стратегии
Направление оптимизации стратегии
- Введение фильтров тренда, таких как система пересечения скользящих средних, для усиления признания тренда
- Оптимизация механизма динамической корректировки ATR, чтобы лучше адаптироваться к различным рыночным условиям
- Дополнительная проверка показателей объема сделок, повышение надежности торговых сигналов
- Оптимизация адаптивных параметров, автоматическая коррекция параметров показателя в зависимости от состояния рынка
- Добавление временных фильтров, чтобы избежать торговли в периоды открытия и закрытия с большими колебаниями рынка
Подвести итог
Стратегия создает целостную торговую систему с помощью комбинации применения бурин-полосок, случайных показателей и ATR. Преимущества стратегии заключаются в перекрестной проверке нескольких показателей и динамическом управлении рисками, но при этом также необходимо обратить внимание на вопросы оптимизации параметров и адаптации к рыночной среде. Благодаря постоянной оптимизации и совершенствованию стратегия может обеспечить стабильную прибыль в реальных сделках.
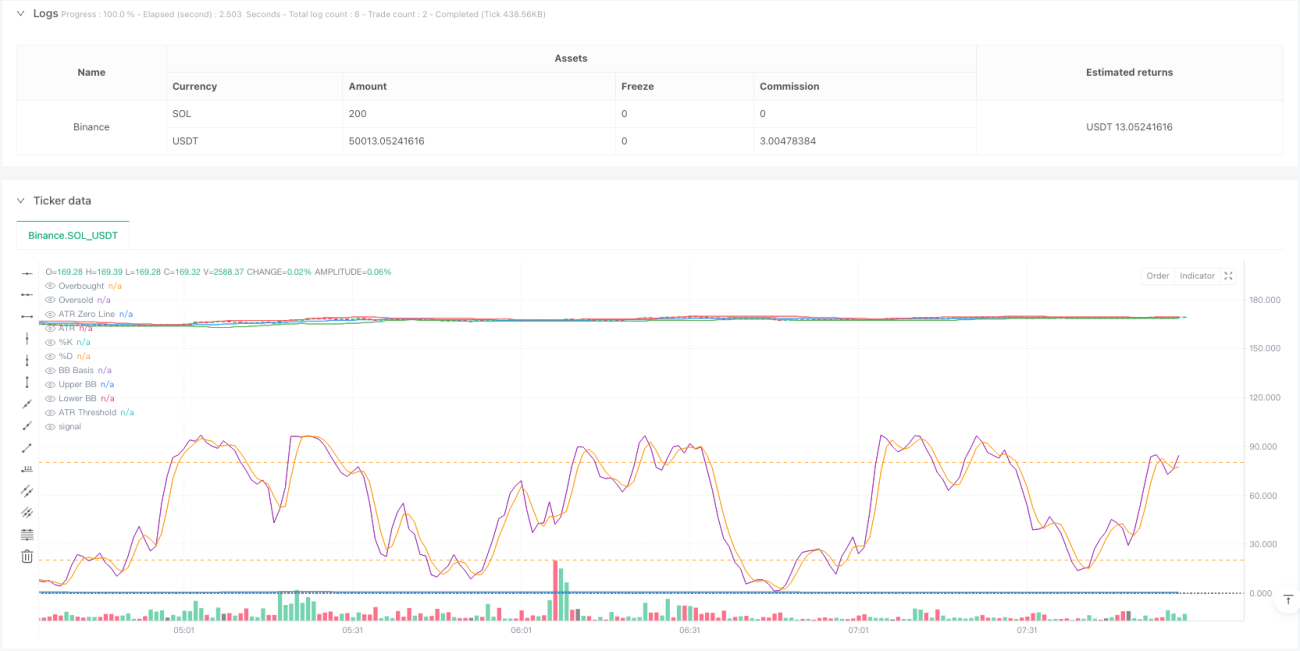
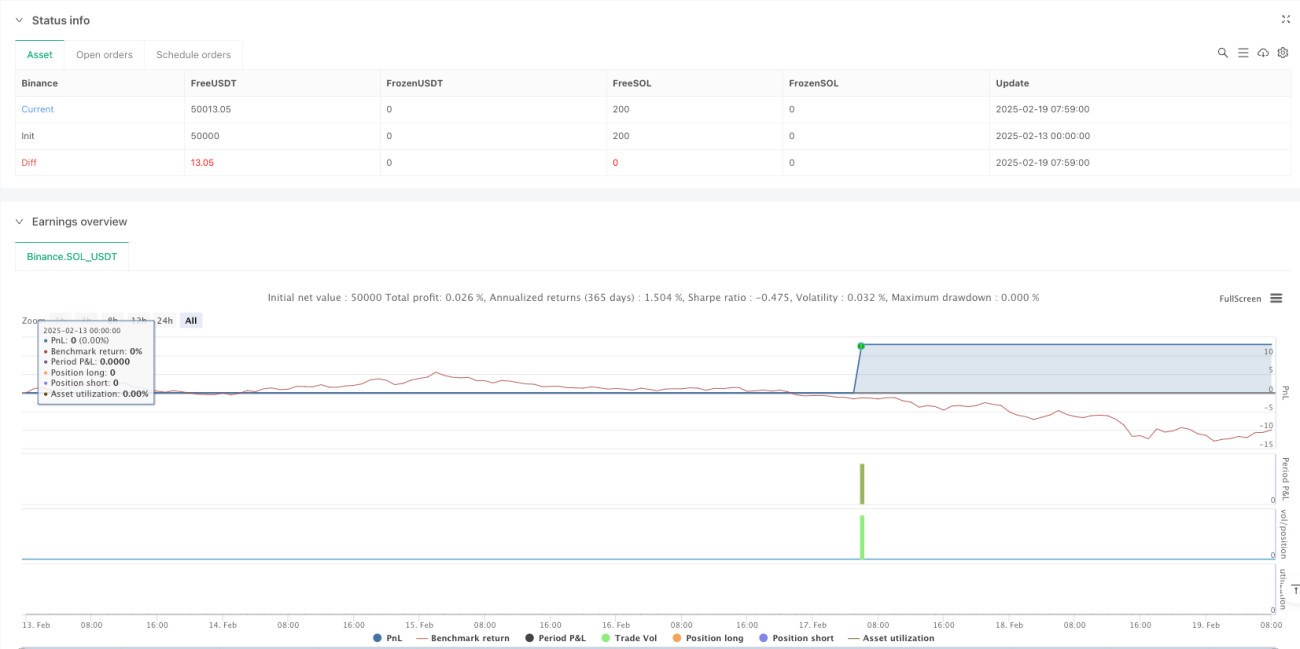
/*backtest
start: 2025-02-13 00:00:00
end: 2025-02-19 08:00:00
period: 1m
basePeriod: 1m
exchanges: [{"eid":"Binance","currency":"SOL_USDT"}]
*/

//@version=5
strategy("Bollinger Bands + Stochastic Oscillator + ATR Strategy", overlay=true, default_qty_type=strategy.percent_of_equity, default_qty_value=10)

// Bollinger Bands Parameters- 1