Стратегия разворота тренда Dual Momentum на основе RSI и Stochastic RSI

Обзор
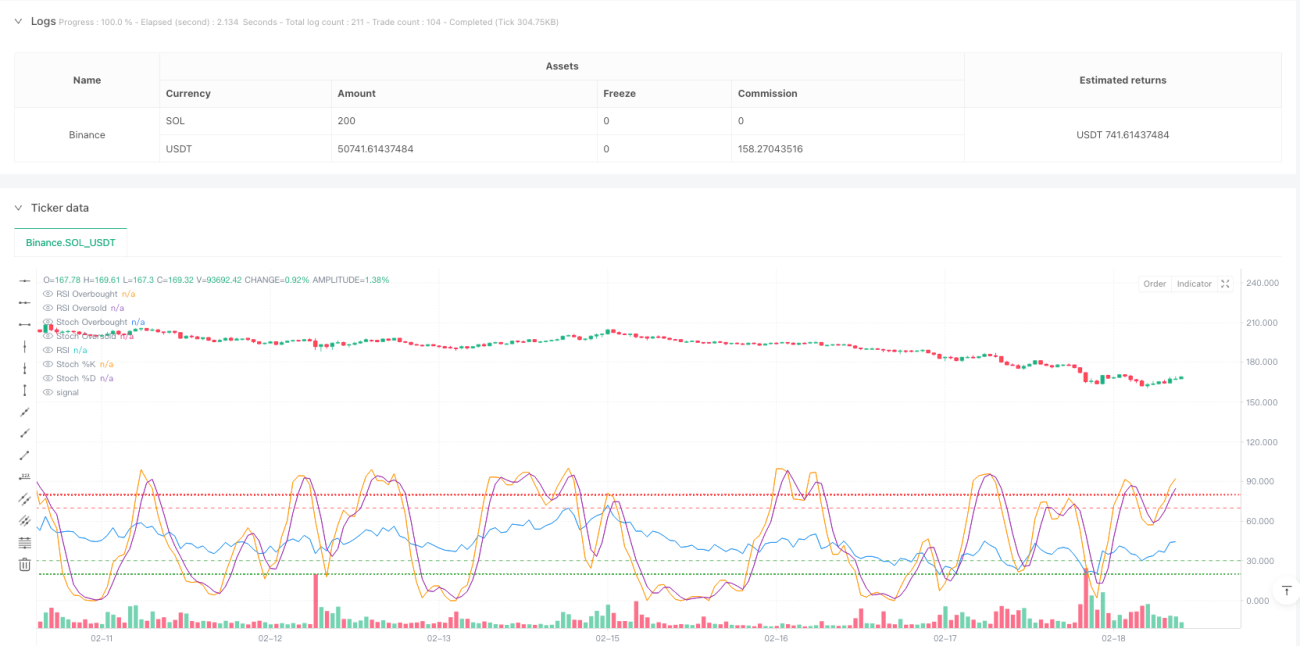
Это стратегия обратного тренда, которая сочетает в себе относительно слабый RSI и случайный относительно слабый RSI. Стратегия используется для выявления перебоев и перепродаж на рынке, а также для изменения динамики. Основная часть стратегии заключается в том, чтобы использовать RSI в качестве базового динамического индикатора, а затем рассчитать Stochastic RSI на этой основе, чтобы дополнительно подтвердить направление изменения динамики цен.
Стратегический принцип
Основная логика стратегии включает в себя следующие ключевые шаги:
- Сначала рассчитывается значение RSI на цене закрытия, которое используется для определения общего состояния перекупа и перепродажи
- %K и %D линии стохастического RSI, рассчитанные на основе значения RSI
- Повышенный сигнал вызывается, когда RSI находится в зоне перепродажи (зависимо от того, что она ниже 30), а линия %K Stochastic RSI пересекает линию %D снизу вверх.
- Вызывает сигнал пустоты, когда RSI находится в зоне перекупа (по умолчанию выше 70) и линия Stochastic RSI%K пересекает линию%D сверху вниз
- При возникновении противоположных условий RSI или реверс-крестирования Stochastic RSI, выход из равной позиции
Стратегические преимущества
- Двойной механизм подтверждения - эффективно снижает риск ложных прорывов, используя RSI и Stochastic RSI в сочетании
- Настраиваемые параметры - ключевые параметры стратегии, такие как циклы RSI, перекуп и перепродажа, могут быть скорректированы в зависимости от различных рыночных условий
- Динамическая визуализация - Стратегия предоставляет графическое отображение RSI и Stochastic RSI в режиме реального времени, что позволяет трейдеру контролировать
- Интеграция управления рисками - включает в себя полный механизм остановки убытков и закрытия прибыли
- Эластичность - может применяться в разных временных циклах и рыночных условиях
Стратегический риск
- Риск рыночных потрясений - частое возникновение ложных сигналов на рынках с горизонтальными колебаниями
- Риск отставания - сигнал может быть отсталым из-за использования многократного среднелинейного сглаживания
- Чувствительность параметров - различные параметры могут привести к значительно различным результатам сделки
- Зависимость от рыночной конъюнктуры - может пропустить часть событий на рынке с сильной тенденцией
- Управление рисками - необходимо разумно установить пропорции позиций для управления рисками
Направление оптимизации стратегии
- Добавление фильтра тренда - можно добавить долгосрочную скользящую среднюю в качестве фильтра тренда, открывая позиции только в направлении тренда
- Оптимизированный механизм остановки убытков - может быть введен динамический стоп, такой как стоп с отслеживанием или стоп ATR
- Внедрение показателей трафика - в сочетании с анализом трафика может повысить надежность сигнала
- Добавление временных фильтров - позволяет избежать важных новостных выпусков или низких потоковых периодов
- Разработка адаптивных параметров - автоматическая корректировка параметров стратегии в зависимости от рыночных колебаний
Подвести итог
Это комплексная стратегия, объединяющая динамику и обратный тренд, для выявления потенциальных торговых возможностей с помощью синхронного действия RSI и Stochastic RSI. Стратегия разработана рационально, имеет хорошую адаптивность и адаптивность. Однако в практическом применении необходимо обращать внимание на выбор и контроль риска в рыночной среде.
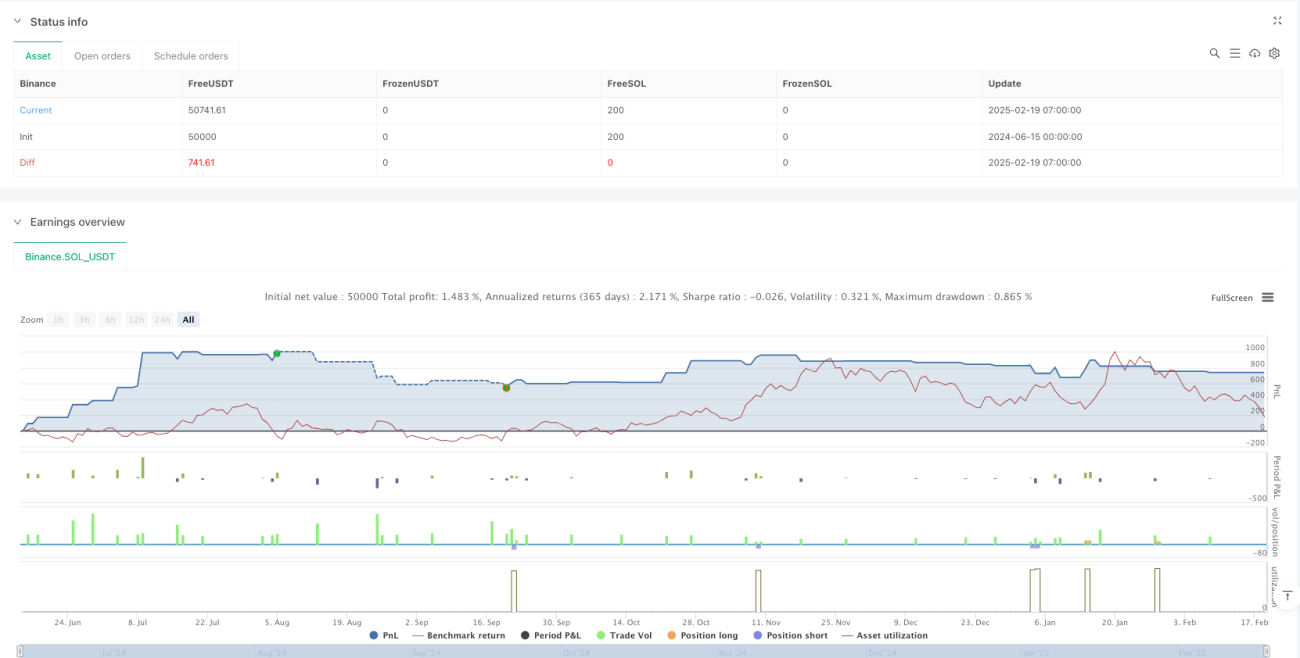
/*backtest
start: 2024-06-15 00:00:00
end: 2025-02-19 08:00:00
period: 1h
basePeriod: 1h
exchanges: [{"eid":"Binance","currency":"SOL_USDT"}]
*/

//@version=5
strategy("RSI + Stochastic RSI Strategy", overlay=true, initial_capital=100000, default_qty_type=strategy.percent_of_equity, default_qty_value=10)

// INPUTS- 1