Торговая система с несколькими скользящими средними и пересечением трендового импульса

Обзор
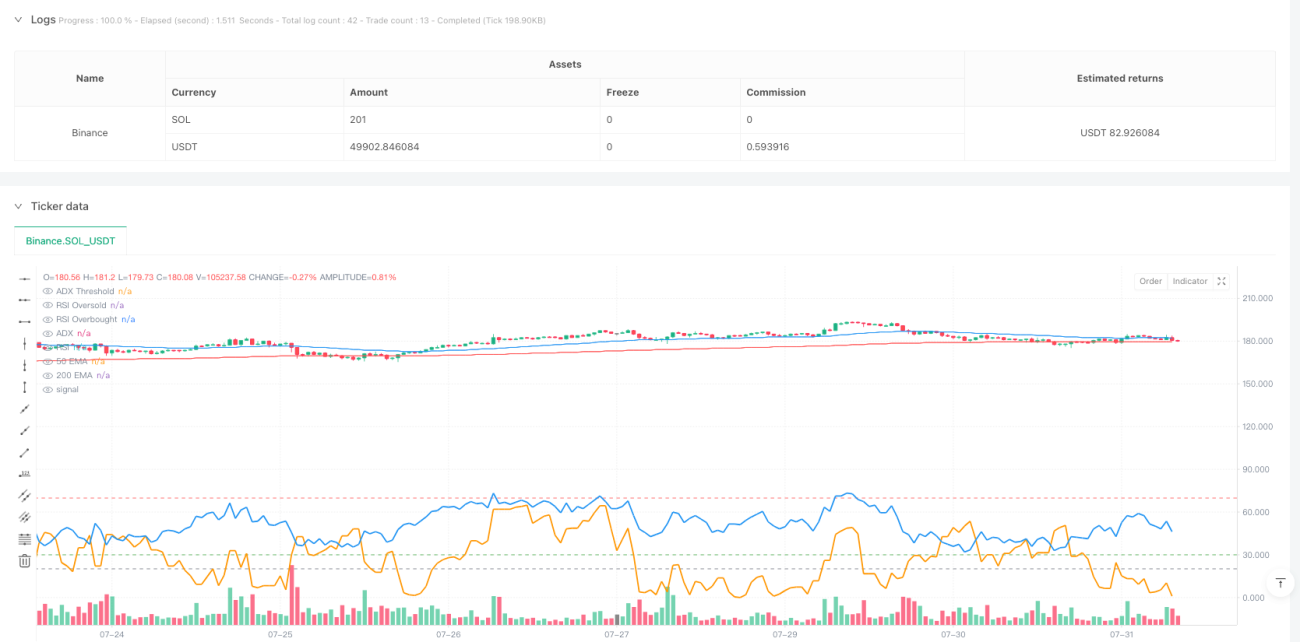
Стратегия представляет собой систему отслеживания тенденций на основе нескольких технических индикаторов, которая сочетает в себе преимущества движущихся средних ((EMA), средних трендовых индикаторов ((ADX) и относительно сильных индикаторов ((RSI)). Для выявления рыночных тенденций используются 50-дневные и 200-дневные индексы с пересечением движущихся средних, при этом используются слабые тренды, отфильтрованные ADX, и используются RSI, чтобы избежать торговли в районах чрезмерной покупки или чрезмерной продажи. Стратегия использует динамические цели стоп-лосса и прибыли, основанные на реальных волновых значениях ((ATR), что гарантирует контроль риска и максимизацию прибыли.
Стратегический принцип
Основная логика стратегии основана на следующих ключевых элементах:
- Определение тренда: использование перекрестка быстрого ЭМА ((50 дней) и медленного ЭМА ((200 дней) для определения направления рыночной тенденции. Когда 50 дней ЭМА выше 200 дней ЭМА, означает вход в восходящую тенденцию; когда 50 дней ЭМА ниже 200 дней ЭМА, означает вход в нисходящую тенденцию.
- Подтверждение силы тренда: использование индикатора ADX для измерения силы тренда, только если значение ADX превышает 20, следует рассматривать вход, чтобы торговать только в сильных тенденциях.
- Динамическая фильтрация: используйте динамическую фильтрацию по RSI, открывайте позиции только тогда, когда RSI находится в диапазоне 30-70, чтобы избежать чрезмерной покупки или чрезмерной продажи в региональных сделках.
- Управление рисками: использование динамических стоп-стоп и прибыльных целей на основе ATR, с установкой стоп-стоп в 2 раза ATR и прибыльных целей в 4 раза ATR.
Стратегические преимущества
- Подтверждение многомерных тенденций: значительно повышается надежность торговых сигналов в сочетании с равнолинейным пересечением, тройной фильтрацией ADX и RSI.
- Динамический риск-менеджмент: динамическая стоп-стоп и прибыль-прибыль на основе ATR, которая может адаптироваться к волатильности рынка.
- Фильтрация слабых тенденций: введение индикатора ADX эффективно предотвратило частые сделки на крипторынках.
- Предотвращение преследования высокого и низкого: механизм фильтрации RSI позволяет избежать торговли в крайних зонах.
Стратегический риск
- Риск обратного тренда: в условиях быстрого обратного тренда отсталость равнолинейной системы может привести к значительному отступлению.
- Риск шокирующего рынка: часто могут возникать ложные сигналы прорыва, когда рынок находится в состоянии межполосной колебательности.
- Чувствительность параметров: параметры для нескольких индикаторов должны быть оптимизированы в разных рыночных условиях.
- Риск проскальзывания: на рынках с низкой ликвидностью реальная цена сделки может быть значительно отклонена от цены сигнала.
Направление оптимизации стратегии
- Введение показателя объема сделок: можно рассмотреть возможность добавления механизма подтверждения объема сделок, которые будут осуществляться только в случае прорыва объема сделок.
- Оптимизация механизма стоп-лосса: можно рассмотреть возможность использования стоп-лосса с отслеживанием, чтобы защитить уже полученную прибыль в процессе развития тренда.
- Добавление фильтров по времени: Добавление фильтров по времени торговли позволяет избежать торговли в более волатильные периоды времени.
- Классификация рыночных условий: параметры стратегии, динамически корректируемые в зависимости от различных рыночных условий (тенденции, колебания).
Подвести итог
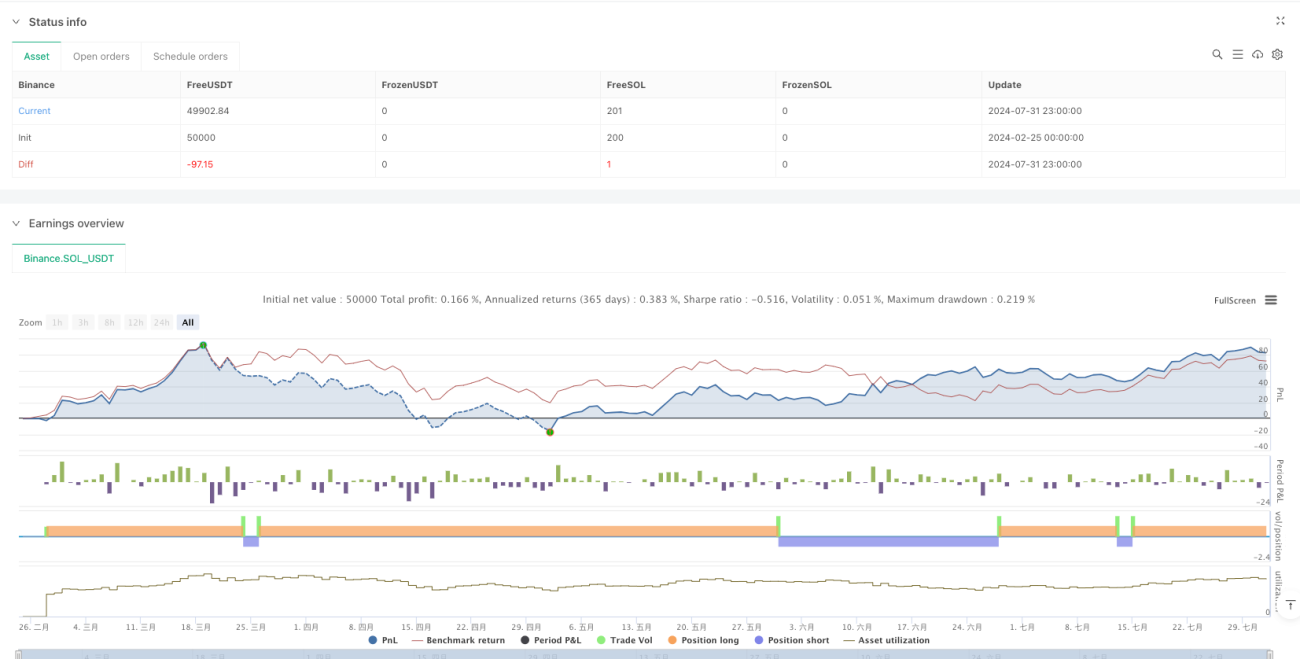
Стратегия создает целостную систему торговли с отслеживанием тенденций с помощью комбинированного использования нескольких технических показателей. Преимущества стратегии заключаются в многомерном механизме подтверждения сигналов и динамичной системе управления рисками, но в то же время необходимо обращать внимание на риски, связанные с обратными тенденциями и колебаниями рынка.
Overview
This strategy is a trend-following system based on multiple technical indicators, combining the advantages of Exponential Moving Averages (EMA), Average Directional Index (ADX), and Relative Strength Index (RSI). It identifies market trends through the crossover of 50-day and 200-day EMAs, filters weak trends using ADX, and avoids trading in overbought or oversold areas using RSI. The strategy employs dynamic stop-loss and take-profit targets based on Average True Range (ATR), ensuring both risk control and profit maximization.
Strategy Principles
The core logic of the strategy is built on the following key elements:
- Trend Identification: Uses the crossover of fast EMA (50-day) and slow EMA (200-day) to determine market trend direction. A bullish trend is signaled when the 50-day EMA crosses above the 200-day EMA, and a bearish trend when it crosses below.
- Trend Strength Confirmation: Utilizes the ADX indicator to measure trend strength, only considering entry when ADX is above 20, ensuring trades only in strong trends.
- Momentum Filtering: Applies RSI indicator for momentum filtering, only entering positions when RSI is between 30-70, avoiding trades in overbought or oversold areas.
- Risk Management: Uses ATR-based dynamic stop-loss and take-profit levels, with stop-loss set at 2x ATR and take-profit at 4x ATR.
Strategy Advantages
- Multi-dimensional Trend Confirmation: Combines EMA crossover, ADX, and RSI triple filtering to significantly improve signal reliability.
- Dynamic Risk Management: ATR-based dynamic stop-loss and take-profit settings adapt to market volatility.
- Weak Trend Filtering: Introduction of ADX effectively avoids frequent trading in ranging markets.
- Prevention of Extreme Entries: RSI filtering mechanism prevents trading in extreme areas.
Strategy Risks
- Trend Reversal Risk: The lag in moving average systems may lead to significant drawdowns in quick reversal scenarios.
- Range-bound Market Risk: May generate frequent false breakout signals during sideways markets.
- Parameter Sensitivity: Multiple indicator parameters need optimization across different market conditions.
- Slippage Risk: Actual execution prices may significantly deviate from signal prices in less liquid markets.
Strategy Optimization Directions
- Volume Indicator Integration: Consider adding volume confirmation, only trading on volume breakouts.
- Stop-loss Mechanism Enhancement: Consider implementing trailing stops to protect profits during trend development.
- Time Filter Addition: Add trading time filters to avoid high-volatility periods.
- Market Environment Classification: Dynamically adjust strategy parameters based on different market conditions (trending, ranging).
Summary
The strategy constructs a comprehensive trend-following trading system through the integrated use of multiple technical indicators. Its strengths lie in multi-dimensional signal confirmation and dynamic risk management systems, while attention must be paid to risks from trend reversals and ranging markets. Through continuous optimization and refinement, the strategy has the potential to maintain stable performance across different market environments.
- 1