Адаптивная система отслеживания тренда на основе сглаженных ядерных множественных скользящих средних

MA RSI ATR MAs NW 趋势追踪 核平滑 滑动止损
Дата создания: 2025-03-28 15:13:28 Последнее изменение: 2025-03-28 15:13:28
Копировать: 2 Количество просмотров: 336
2
Подписаться
319
Подписчики

Адаптивная система отслеживания тренда на основе сглаженных ядерных множественных скользящих средних Адаптивная система отслеживания тренда на основе сглаженных ядерных множественных скользящих средних

Обзор

Эта система отслеживания адаптивных тенденций, основанная на многомерных средних ядрах, представляет собой передовую количественную торговую стратегию, которая объединяет пять пользовательских подвижных средних, многослойные фильтры и механизмы подтверждения для идентификации и использования продолжающихся рыночных тенденций. Эта стратегия использует технологию ядерного сглажения, а не традиционные подвижные средние, что обеспечивает более гибкий сглаживающий эффект и адаптивность, способную адаптироваться к различным рыночным условиям и временным рамкам.

Ключевые функции включают в себя: визуализацию текущих рыночных тенденций с использованием “единолинейной полосы”, состоящей из пяти движущихся средних; уменьшение шума и ложных сигналов с помощью фильтров RSI, фильтров интенсивности тренда и периода подтверждения тренда; ввод сигналов только при выполнении определенных условий; а также использование множества вариантов выхода (таких как стоп-стоп, ATR-стоп-стоп, ATR-прибыль и стоп-стоп) для управления рисками и защиты прибыли.

Стратегический принцип

Основная логика этой стратегии заключается в следующих ключевых компонентах:

  1. Ядерная скользящая средняяСтратегия: использование технологии ядерного сглаживания вместо стандартных движущихся средних, обеспечивающих более гибкий и адаптивный эффект сглаживания, чем традиционные МА. Поддержка трех типов ядер:

    • Бета-ядра: самый мощный вариант, который позволяетalphaиbetaПараметры независимого контроля положительной и отрицательной задержки, что позволяет МА реагировать на повышение и снижение цены по-разному.
    • Например, если бы мы создали колокольню, то мы бы создали всплеск.bandwidthПараметры регулируют ширину колокольной кривой.
    • Ядра Эпанечникова: похожие на ядра Гауса, но немного отличающиеся по форме и использованиюbandwidthПараметры
  2. Равнолинейная полосаПять МА образуют “равнолинейные полосы” на графике, их расположение и относительная позиция обеспечивают визуальную индикацию силы и направления тренда.

  3. Скрещивание: Стратегия мониторинга перекрестков между последовательными МА в равнолинейной полосе, пользователь может указать количество перекрестков, необходимое для создания потенциального сигнала.

  4. Фильтр RSI: помогает избежать входа в рынок в случае чрезмерного продления. При многоосновном входе RSI должен быть ниже уровня перепродажи; при пустом входе RSI должен быть выше уровня перекупа.

  5. Фильтр интенсивности трендаИспользование RSI для измерения интенсивности тренда с помощью движущегося среднего, чтобы быть уверенным в том, что вы будете торговать в направлении сильной, уже установленной тенденции.

  6. Тенденции подтверждены: Для дальнейшего снижения ложных сигналов, требуется, чтобы условия входа (пересечение MA, RSI и интенсивность тренда) должны последовательно удовлетворять определенному количеству K-линий, прежде чем фактически запускать торговлю.

  7. Выход из логикиСтратегия приоритета выхода в следующем порядке: жесткий стоп, отслеживание стоп-убытков (в процентах или на основе ATR) и прибыль (на основе ATR). Это гарантирует минимизацию убытков и защиту прибыли.

Стратегические преимущества

  1. Настраиваемая высота плавления: Использование гладкого ядра (особенно бета-ядра) обеспечивает уровень контроля за отзывчивостью к MA, который не используется в стандартном MA. Это позволяет использовать более адаптивный и мелкий подход к отслеживанию тенденций.

  2. Сила и подтверждение тренда: фильтр силы тренда (RSI с использованием MA) и комбинация периода подтверждения тренда обеспечивают мощный механизм фильтрации, который выходит за рамки простых чтений MA или RSI. Это помогает отфильтровывать слабые тенденции и шокирующие ситуации.

  3. Выход из множества приоритетов: логика выхода из стратегии очень сложна, предлагая комбинацию фиксированных и динамических стоп-логов и уровней прибыли. Приоритет обеспечивает наиболее консервативный выход ((стоп-логи) сначала с триггером, затем с отслеживанием стоп-логов и, наконец, с целью получения прибыли.

  4. Группировка всех вводов: Все входы классифицированы в группы по конкретным аспектам стратегии управления, пользователь может легко и быстро найти и скорректировать вход.

  5. Управление направлением торговлиВ отличие от многих других стратегий, эта стратегия позволяет самостоятельно включать или отключать многоголовые и пустые сделки.

  6. Система всесторонних тенденцийПоказатель включает в себя все необходимые для торговли элементы: входные сигналы, учет стоп-лосс, учет прибыли.

Стратегический риск

  1. Параметры оптимизацииСлишком тонкая настройка параметров может привести к тому, что стратегия будет хорошо работать в обратном тестировании, но не будет работать в реальной торговле. Рекомендуется проводить тщательную перекрестную проверку и экспроприацию, чтобы гарантировать универсальность параметров.

  2. Задержка в реагировании на изменение тренда: Хотя стратегия предназначена для идентификации продолжающихся тенденций, она может не реагировать достаточно быстро в случае резкого рыночного поворота, что приводит к частичному отступлению. Можно сбалансировать чувствительность к изменениям тенденций и способность фильтровать шум, регулируя длину МА и основные параметры.

  3. MA перекрестный фальшивый сигнал: Даже при наличии многослойных фильтров в волатильных рынках возможны ложные сигналы. Рекомендуется использовать эту стратегию в определенных трендовых рынках или увеличить период подтверждения тренда, чтобы уменьшить ложные сигналы.

  4. Преждевременный сбой.: В больших волатильных рынках стоп-потери могут быть преждевременно вызваны, что приводит к пропущенным последующим ценовым корректировкам и возобновлению тренда. Стоп-потери, основанные на ATR, могут быть рассмотрены и соответствующим образом скорректированы в соответствии с волатильностью рынка.

  5. Риски сложностиСложность стратегий может затруднить устранение неполадок и мониторинг в реальном времени. Рекомендуется начать с простой настройки и постепенно добавлять сложные функции, чтобы обеспечить полное понимание роли каждого компонента.

Направление оптимизации стратегии

  1. Приспособленность временных рамок: текущая стратегия может быть оптимизирована, чтобы она могла автоматически корректировать параметры в зависимости от разных временных рамок. Например, можно добавить функцию автоматической корректировки параметров в зависимости от временных рамок, чтобы стратегия могла эффективно работать на графике дневного, часового или минутного ряда.

  2. Обзор рыночной среды: увеличение механизмов автоматического обнаружения рыночной среды ((тренд, диапазон или высокая волатильность) и корректировка торговых параметров в зависимости от результатов обнаружения. Например, увеличение интенсивности фильтрации или корректировка целевой прибыли на рынке в диапазоне, расслабление условий фильтрации на рынке в тренде.

  3. Динамический RSI: Дизайн RSI на динамическую, а не статическую, перекупную и перепродажу, которая автоматически корректируется в зависимости от недавней рыночной волатильности. Это может повысить адаптивность стратегии в различных рыночных условиях.

  4. Интегрированный количественный волатильный индикаторИнтеграция стратегии с показателями волатильности (например, полосой Боллинджера), чтобы скорректировать цели по остановке убытков и прибыли в условиях высокой волатильности и снизить риск попадания в эффективную тенденцию.

  5. Подтверждение многократных временных рамок: добавление подтверждения тенденции более высоких временных рамок, чтобы обеспечить согласованность направления торговли с более крупными тенденциями. Например, торговля осуществляется только в том случае, если тенденция дневной линии соответствует направлению часовой линии.

  6. Мониторинг и адаптацияСистема мониторинга эффективности стратегии в реальном времени, которая отслеживает показатели, такие как коэффициент выигрыша, коэффициент убытка и максимальный отзыв, автоматически корректирует параметры или приостанавливает торговлю, когда показатели эффективности падают ниже установленного порога.

  7. Машинное обучениеИзучение интеграции алгоритмов машинного обучения в процессе оптимизации параметров, позволяя стратегии учиться наилучшим комбинациям параметров из исторических данных и постоянно совершенствоваться с накоплением новых данных.

Подвести итог

Система адаптивного отслеживания трендов, основанная на корневом сглаживании множественных средних линий, является мощным и гибким инструментом отслеживания трендов, сочетающим визуальную четкость полосы движущихся средних значений с продвинутой фильтрацией и управлением рисками от корневого сглаживания, RSI, силы тренда и множества вариантов выхода. Она предназначена для трейдеров, которые хотят иметь настраиваемые и мощные инструменты для идентификации и торговли сохраняющимися тенденциями на рынке.

Самым большим преимуществом этой стратегии является ее высокая настраиваемость и адаптивность, что позволяет ей адаптироваться к различным рыночным условиям. С помощью технологии ядерного сглаживания она обеспечивает более тонкий контроль, чем традиционная движущаяся средняя, а многоуровневые механизмы фильтрации и подтверждения помогают уменьшить ложные сигналы. В то же время комплексная система управления рисками обеспечивает множество стратегий выхода, гарантируя минимизацию потерь и защиту прибыли.

Однако пользователи должны быть внимательны к проблемам оптимизации параметров, избегать перенастройки и адаптировать стратегию в соответствии с конкретными рыночными условиями. Рекомендуется проводить полное обратное тестирование и тестирование вперед, чтобы гарантировать, что стратегия будет стабильно работать в различных рыночных условиях.
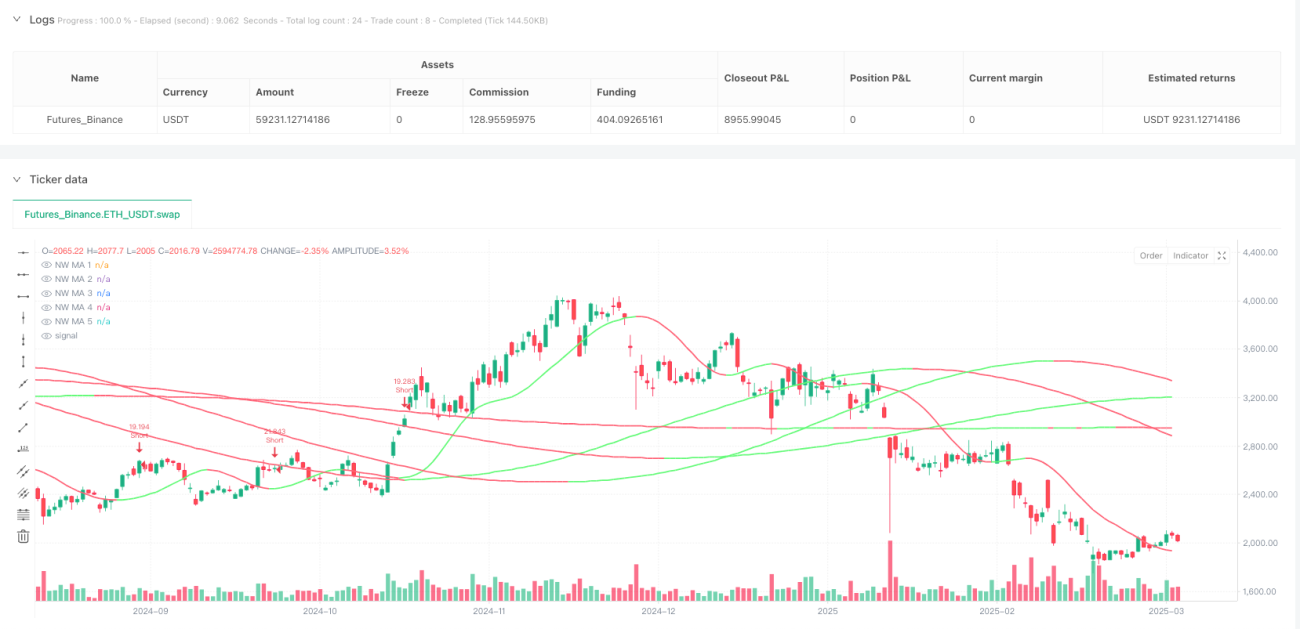
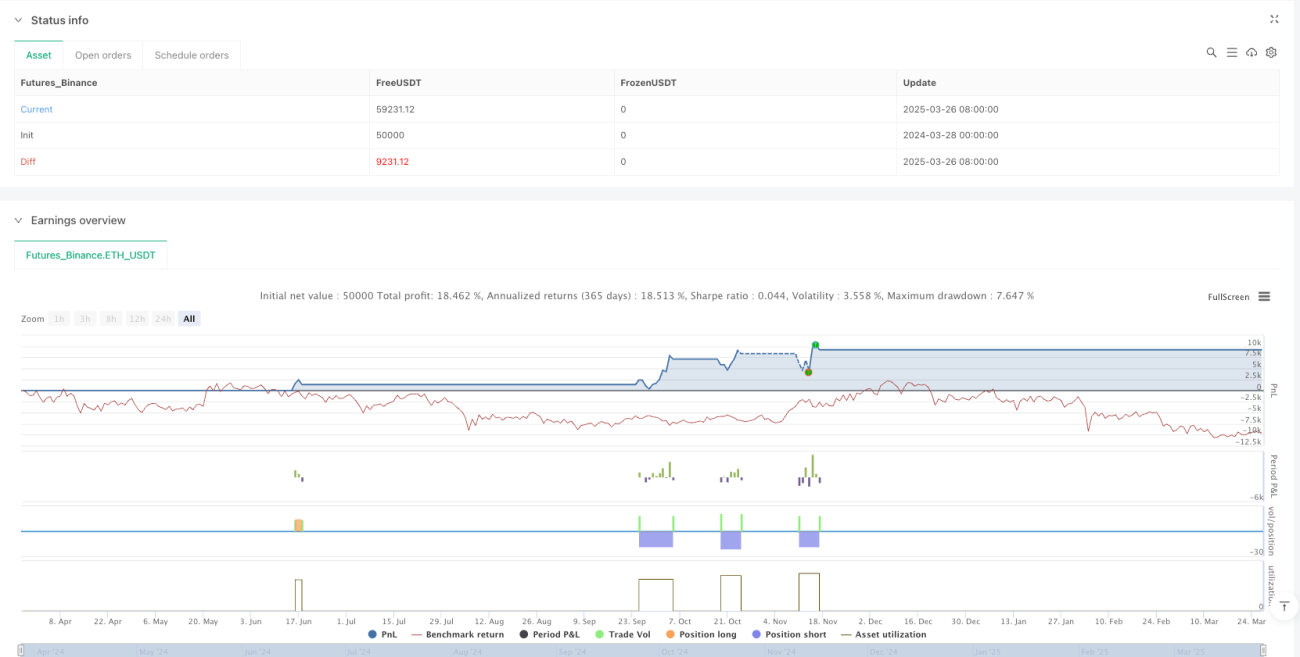
Исходный код стратегии
/*backtest
start: 2024-03-28 00:00:00
end: 2025-03-27 00:00:00
period: 1d
basePeriod: 1d
exchanges: [{"eid":"Futures_Binance","currency":"ETH_USDT"}]
*/

//@version=5
strategy("B4100 - NW Trend Ribbon Strategy", overlay=true, default_qty_type = strategy.percent_of_equity, default_qty_value = 100, commission_type = strategy.commission.percent, commission_value = 0.02)

// === Optimized Functions ===
f_calculate_beta_kernel(length, alpha, beta) =>
    kernel = array.new_float(length, 0)
    sum = 0.0
    for i = 0 to length - 1
        x = i / (length - 1)
        w = math.pow(x, alpha - 1) * math.pow(1 - x, beta - 1)
        array.set(kernel, i, w)
        sum += w
    for i = 0 to length - 1
        array.set(kernel, i, array.get(kernel, i) / sum)
    kernel

f_calculate_gaussian_kernel(length, bandwidth) =>
    kernel = array.new_float(length, 0)
    sum = 0.0
    for i = 0 to length - 1
        x = i / (length - 1)
        w = math.exp(-0.5 * math.pow((x - 0.5) / bandwidth, 2))
        array.set(kernel, i, w)
        sum += w
    for i = 0 to length - 1
        array.set(kernel, i, array.get(kernel, i) / sum)
    kernel

f_calculate_epanechnikov_kernel(length, bandwidth) =>
    kernel = array.new_float(length, 0)
    sum = 0.0
    for i = 0 to length - 1
        x = i / (length - 1)
        w = math.max(0.0, 1 - math.pow((x - 0.5) / bandwidth, 2))
        array.set(kernel, i, w)
        sum += w
    for i = 0 to length - 1
        array.set(kernel, i, array.get(kernel, i) / sum)
    kernel

f_apply_kernel_ma(src, kernel, length) =>
    sum = 0.0
    for i = 0 to length - 1
        sum += src[i] * array.get(kernel, i)
    sum

f_trend_strength(ma, length) =>
    ts = ta.rsi(ma, length) / 100
    ts

// === Inputs ===
src = input.source(close, title="Price Source", tooltip="Select the price data used for calculations.  'Close' is the most common, but you can also use 'Open', 'High', 'Low', 'HL2' (typical price), etc.")

// MA Parameters
maGroup = "Moving Average Settings"
maCrossoverGroup = "Moving Average Crossover Settings"
rsiFilterGroup = "RSI Filter Settings"
trendStrengthGroup = "Trend Strength Filter Settings"
trendConfirmGroup = "Trend Confirmation Settings"
trailingStopGroup = "Trailing Stop Settings"
atrTrailingStopGroup = "ATR Trailing Stop Settings"
atrTakeProfitGroup = "ATR Take Profit Settings"
hardStopGroup = "Hard Stop Loss Settings"
tradeDirectionGroup = "Trade Direction Control"

length1 = input.int(20, title="MA1 Length", minval=1, tooltip="Number of bars used to calculate the first Moving Average.", group=maGroup)
kernelType1 = input.string(title="MA1 Kernel Type", defval="Beta", options=["Beta", "Gaussian", "Epanechnikov"], tooltip="Select the type of smoothing kernel for MA1.  'Beta' allows for lag adjustment. 'Gaussian' and 'Epanechnikov' use a bandwidth.", group=maGroup)
alpha1  = input.float(3.0, title="MA1 Beta Kernel +Lag", minval=1, maxval=10, tooltip="For Beta kernel only: Higher values increase *positive* lag (MA reacts *slower* to price increases).", group=maGroup)
beta1   = input.float(3.0, title="MA1 Beta Kernel -Lag", minval=1, maxval=10, tooltip="For Beta kernel only: Higher values increase *negative* lag (MA reacts *slower* to price decreases).", group=maGroup)
bandwidth1 = input.float(0.3, title="MA1 Bandwidth", minval=0.1, maxval=10.0, tooltip="For Gaussian/Epanechnikov kernels:  Smaller values create a *tighter* fit to the price (more sensitive). Larger values create a *smoother*, less sensitive MA.", group=maGroup)

length2 = input.int(100, title="MA2 Length", minval=1, tooltip="Number of bars for the second Moving Average.", group=maGroup)
kernelType2 = input.string(title="MA2 Kernel Type", defval="Gaussian", options=["Beta", "Gaussian", "Epanechnikov"], tooltip="Kernel type for MA2 (see MA1 Kernel Type for details).", group=maGroup)
alpha2  = input.float(3.0, title="MA2 Beta Kernel +Lag", minval=1, maxval=10, tooltip="Beta kernel positive lag for MA2 (see MA1 Beta Kernel +Lag for details).", group=maGroup)
beta2   = input.float(3.0, title="MA2 Beta Kernel -Lag", minval=1, maxval=10, tooltip="Beta kernel negative lag for MA2 (see MA1 Beta Kernel -Lag for details).", group=maGroup)
bandwidth2 = input.float(0.3, title="MA2 Bandwidth", minval=0.1, maxval=10.0, tooltip="Bandwidth for MA2 (see MA1 Bandwidth for details).", group=maGroup)

length3 = input.int(150, title="MA3 Length", minval=1, tooltip="Number of bars for the third Moving Average.", group=maGroup)
kernelType3 = input.string(title="MA3 Kernel Type", defval="Epanechnikov", options=["Beta", "Gaussian", "Epanechnikov"], tooltip="Kernel type for MA3.", group=maGroup)
alpha3  = input.float(3.0, title="MA3 Beta Kernel +Lag", minval=1, maxval=10, tooltip="Beta kernel positive lag for MA3.", group=maGroup)
beta3   = input.float(3.0, title="MA3 Beta Kernel -Lag", minval=1, maxval=10, tooltip="Beta kernel negative lag for MA3.", group=maGroup)
bandwidth3 = input.float(0.3, title="MA3 Bandwidth", minval=0.1, maxval=10.0, tooltip="Bandwidth for MA3.", group=maGroup)

length4 = input.int(200, title="MA4 Length", minval=1, tooltip="Number of bars for the fourth Moving Average.", group=maGroup)
kernelType4 = input.string(title="MA4 Kernel Type", defval="Beta", options=["Beta", "Gaussian", "Epanechnikov"], tooltip="Kernel type for MA4.", group=maGroup)
alpha4  = input.float(3.0, title="MA4 Beta Kernel +Lag", minval=1, maxval=10, tooltip="Beta kernel positive lag for MA4.", group=maGroup)
beta4   = input.float(3.0, title="MA4 Beta Kernel -Lag", minval=1, maxval=10, tooltip="Beta kernel negative lag for MA4.", group=maGroup)
bandwidth4 = input.float(0.3, title="MA4 Bandwidth", minval=0.1, maxval=10.0, tooltip="Bandwidth for MA4.", group=maGroup)

length5 = input.int(250, title="MA5 Length", minval=1, tooltip="Number of bars for the fifth Moving Average.", group=maGroup)
kernelType5 = input.string(title="MA5 Kernel Type", defval="Gaussian", options=["Beta", "Gaussian", "Epanechnikov"], tooltip="Kernel type for MA5.", group=maGroup)
alpha5  = input.float(3.0, title="MA5 Beta Kernel +Lag", minval=1, maxval=10, tooltip="Beta kernel positive lag for MA5.", group=maGroup)
beta5   = input.float(3.0, title="MA5 Beta Kernel -Lag", minval=1, maxval=10, tooltip="Beta kernel negative lag for MA5.", group=maGroup)
bandwidth5 = input.float(0.3, title="MA5 Bandwidth", minval=0.1, maxval=10.0, tooltip="Bandwidth for MA5.", group=maGroup)

// Entry Logic
maCrossoversRequired = input.int(3, title="MA Crossovers Required", minval=1, maxval=5, tooltip="How many moving averages must cross each other to generate a potential trade signal.  A higher number means a stronger (but potentially later) signal.", group=maCrossoverGroup)
useRsiFilter         = input.bool(true, title="Use RSI Filter", tooltip="If enabled, the RSI must also be in overbought/oversold territory for a signal to be valid.", group=rsiFilterGroup)
rsiLength           = input.int(7, title="RSI Length", minval=2, tooltip="Number of bars used to calculate the RSI.", group=rsiFilterGroup)
rsiOverbought       = input.int(60, title="RSI Overbought", minval=50, maxval=100, tooltip="RSI level considered overbought (for short entries).", group=rsiFilterGroup)
rsiOversold         = input.int(40, title="RSI Oversold", minval=0, maxval=50, tooltip="RSI level considered oversold (for long entries).", group=rsiFilterGroup)

// Trend Strength Filter
useTrendStrengthFilter = input.bool(true, title="Use Trend Strength Filter", tooltip="If enabled, the trend strength (measured by the RSI of a selected MA) must be above/below a threshold.", group=trendStrengthGroup)
trendStrengthLength   = input.int(7, title="Trend Strength Length", minval=1, tooltip="Number of bars for the trend strength calculation (RSI of the selected MA).", group=trendStrengthGroup)
trendStrengthMa       = input.int(1, title="Trend Strength MA", minval=1, maxval=5, tooltip="Which moving average (1-5) to use for calculating trend strength. 1 = MA1, 2 = MA2, etc.", group=trendStrengthGroup)
minTrendStrength     = input.float(0.5, title="Min Trend Strength (Longs)", minval=0.0, maxval=1.0, step=0.01, tooltip="Minimum trend strength (0.0 - 1.0) required for long entries. 0.5 means the selected MA's RSI must be above 50.", group=trendStrengthGroup)
maxTrendStrength     = input.float(0.5, title="Max Trend Strength (Shorts)", minval=0.0, maxval=1.0, step=0.01, tooltip="Maximum trend strength (0.0 - 1.0) required for short entries. 0.5 means the selected MA's RSI must be below 50.", group=trendStrengthGroup)

// Trend Confirmation
trendConfirmationPeriod = input.int(4, title="Trend Confirmation Period", minval=1, tooltip="Number of consecutive bars the entry conditions must be met before a trade is taken. This helps filter out false signals.", group=trendConfirmGroup)


// Exit Logic
useTrailingStop = input.bool(true, title="Use Percentage Trailing Stop", tooltip="Enable a percentage-based trailing stop loss.", group=trailingStopGroup)
trailingStopActivationPercent = input.float(2.0, title="Activation (%)", minval=0.1, step=0.1, tooltip="Percentage above/below the entry price at which the trailing stop activates.", group=trailingStopGroup) / 100
trailingStopOffsetPercent     = input.float(1.0, title="Offset (%)", minval=0.1, step=0.1, tooltip="Percentage offset from the highest/lowest price reached since entry. This determines how tightly the stop trails the price.", group=trailingStopGroup) / 100

useAtrTrailingStop    = input.bool(true, title="Use ATR Trailing Stop", tooltip="Enable a trailing stop based on the Average True Range (ATR).", group=atrTrailingStopGroup)
atrTrailingStopLength = input.int(1, title="ATR Length", minval=1, tooltip="Number of bars used to calculate the ATR.", group=atrTrailingStopGroup)
atrTrailingStopMult   = input.float(200.0, title="ATR Multiplier", minval=0.1, tooltip="Multiplier for the ATR value.  A larger multiplier creates a wider stop.", group=atrTrailingStopGroup)

useAtrTakeProfit              = input.bool(false, title="Use ATR Take Profit", tooltip="Enable a take profit level based on the Average True Range (ATR).", group=atrTakeProfitGroup)
atrTakeProfitLength           = input.int(14, title="ATR Length", minval=1, tooltip="Number of bars used to calculate the ATR for take profit.", group=atrTakeProfitGroup)
atrTakeProfitMultiplier       = input.float(3.0, title="ATR Multiplier", minval=0.1, tooltip="Multiplier for the ATR value. A larger multiplier sets a further take profit target.", group=atrTakeProfitGroup)

useHardStopLoss     = input.bool(false, title="Use Hard Stop Loss", tooltip="Enable a fixed stop loss.", group=hardStopGroup)
hardStopLossPercent = input.float(0.0, title="Hard Stop Loss (%)", minval=0.0, step=0.1, tooltip="Percentage below (long) or above (short) the entry price for the hard stop loss.", group=hardStopGroup) / 100
useAtrHardStopLoss  = input.bool(false, title="Use ATR Hard Stop Loss", tooltip="Use ATR to calculate hard stop loss", group=hardStopGroup)
atrHardStopLossLength = input.int(14, title="ATR Hard Stop Loss Length", minval=1, tooltip="Length of the ATR for the hard stop loss", group=hardStopGroup)
atrHardStopLossMult   = input.float(1.5, title="ATR Hard Stop Loss Multiplier", minval=0.1, tooltip="Multiplier of ATR for the hard stop loss", group=hardStopGroup)

// *** Trade Direction Control ***
enableLongs  = input.bool(true, title="Enable Long Trades", group=tradeDirectionGroup)
enableShorts = input.bool(true, title="Enable Short Trades", group=tradeDirectionGroup)

// === Pre-calculate kernels (do this only once) ===
var kernel1 = array.new_float(length1, 0.0)
var kernel2 = array.new_float(length2, 0.0)
var kernel3 = array.new_float(length3, 0.0)
var kernel4 = array.new_float(length4, 0.0)
var kernel5 = array.new_float(length5, 0.0)

if barstate.isfirst
    if kernelType1 == "Beta"
        kernel1 := f_calculate_beta_kernel(length1, alpha1, beta1)
    else if kernelType1 == "Gaussian"
        kernel1 := f_calculate_gaussian_kernel(length1, bandwidth1)
    else // Epanechnikov
        kernel1 := f_calculate_epanechnikov_kernel(length1, bandwidth1)

    if kernelType2 == "Beta"
        kernel2 := f_calculate_beta_kernel(length2, alpha2, beta2)
    else if kernelType2 == "Gaussian"
        kernel2 := f_calculate_gaussian_kernel(length2, bandwidth2)
    else // Epanechnikov
        kernel2 := f_calculate_epanechnikov_kernel(length2, bandwidth2)

    if kernelType3 == "Beta"
        kernel3 := f_calculate_beta_kernel(length3, alpha3, beta3)
    else if kernelType3 == "Gaussian"
        kernel3 := f_calculate_gaussian_kernel(length3, bandwidth3)
    else // Epanechnikov
        kernel3 := f_calculate_epanechnikov_kernel(length3, bandwidth3)

    if kernelType4 == "Beta"
        kernel4 := f_calculate_beta_kernel(length4, alpha4, beta4)
    else if kernelType4 == "Gaussian"
        kernel4 := f_calculate_gaussian_kernel(length4, bandwidth4)
    else // Epanechnikov
        kernel4 := f_calculate_epanechnikov_kernel(length4, bandwidth4)

    if kernelType5 == "Beta"
        kernel5 := f_calculate_beta_kernel(length5, alpha5, beta5)
    else if kernelType5 == "Gaussian"
        kernel5 := f_calculate_gaussian_kernel(length5, bandwidth5)
    else // Epanechnikov
        kernel5 := f_calculate_epanechnikov_kernel(length5, bandwidth5)

// === Apply pre-calculated kernels to data ===
nw_ma1 = f_apply_kernel_ma(src, kernel1, length1)
nw_ma2 = f_apply_kernel_ma(src, kernel2, length2)
nw_ma3 = f_apply_kernel_ma(src, kernel3, length3)
nw_ma4 = f_apply_kernel_ma(src, kernel4, length4)
nw_ma5 = f_apply_kernel_ma(src, kernel5, length5)

// MA Array for easier iteration
ma_array = array.new_float(5)
array.set(ma_array, 0, nw_ma1)
array.set(ma_array, 1, nw_ma2)
array.set(ma_array, 2, nw_ma3)
array.set(ma_array, 3, nw_ma4)
array.set(ma_array, 4, nw_ma5)

// Calculate ATR values *unconditionally*
atrTrailingValue = ta.atr(atrTrailingStopLength)
atrTakeProfitValue = ta.atr(atrTakeProfitLength)
atrHardStopLossValue = ta.atr(atrHardStopLossLength)

// Calculate Trend Strength *unconditionally* (and only once)
trendStrengthValue = useTrendStrengthFilter ? f_trend_strength(array.get(ma_array, trendStrengthMa - 1), trendStrengthLength) : 0.0

// === Entry Logic ===

// MA Crossovers
longMaCrossovers  = 0
shortMaCrossovers = 0

for i = 0 to 3
    if array.get(ma_array, i) > array.get(ma_array, i + 1)
        longMaCrossovers  := longMaCrossovers  + 1
    if array.get(ma_array, i) < array.get(ma_array, i + 1)
        shortMaCrossovers := shortMaCrossovers + 1

longCrossoverCondition  = longMaCrossovers  >= maCrossoversRequired
shortCrossoverCondition = shortMaCrossovers >= maCrossoversRequired

// RSI Filter
rsiValue = ta.rsi(src, rsiLength)
longRsiCondition  = not useRsiFilter or (rsiValue < rsiOversold)
shortRsiCondition = not useRsiFilter or (rsiValue > rsiOverbought)

// Trend Strength Filter - Simplified Logic
longTrendStrengthCondition  = not useTrendStrengthFilter or trendStrengthValue >= minTrendStrength
shortTrendStrengthCondition = not useTrendStrengthFilter or trendStrengthValue <= maxTrendStrength


// --- Trend Confirmation Logic ---
var int long_confirm_count = 0
var int short_confirm_count = 0
var bool confirmedLong = false
var bool confirmedShort = false

// Update confirmation counters
if longCrossoverCondition and longRsiCondition and longTrendStrengthCondition
    long_confirm_count := long_confirm_count + 1
    short_confirm_count := 0  // Reset opposite counter
else
    long_confirm_count := 0

if shortCrossoverCondition and shortRsiCondition and shortTrendStrengthCondition
    short_confirm_count := short_confirm_count + 1
    long_confirm_count := 0 // Reset opposite counter
else
    short_confirm_count := 0

// Check for confirmed trend
confirmedLong := long_confirm_count >= trendConfirmationPeriod
confirmedShort := short_confirm_count >= trendConfirmationPeriod

// Combined Entry Conditions (using confirmed trend)
longCondition = confirmedLong  and enableLongs // Added trade direction check
shortCondition = confirmedShort and enableShorts // Added trade direction check

// === Exit Logic ===
var float longTrail = na
var float shortTrail = na
var float longTakeProfitPrice = na
var float shortTakeProfitPrice = na
var float longHardStopLossPrice = na
var float shortHardStopLossPrice = na

// Hard Stop Loss and Take Profit calculation on entry
if longCondition or shortCondition
    // Calculate Hard Stop Loss
    if useHardStopLoss
        if useAtrHardStopLoss
            longHardStopLossPrice  := close - (atrHardStopLossValue * atrHardStopLossMult)
            shortHardStopLossPrice := close + (atrHardStopLossValue * atrHardStopLossMult)
        else
            longHardStopLossPrice  := close * (1 - hardStopLossPercent)
            shortHardStopLossPrice := close * (1 + hardStopLossPercent)
    else
        longHardStopLossPrice := na
        shortHardStopLossPrice := na

    // Calculate Take Profit
    if useAtrTakeProfit
        longTakeProfitPrice  := close + (atrTakeProfitValue * atrTakeProfitMultiplier)
        shortTakeProfitPrice := close - (atrTakeProfitValue * atrTakeProfitMultiplier)
    else
        longTakeProfitPrice := na
        shortTakeProfitPrice := na

// Trailing Stop Logic - updated for each bar
if strategy.position_size > 0
    // Calculate trailing stop
    float tempTrail = na

    if useTrailingStop
        if close > strategy.position_avg_price * (1 + trailingStopActivationPercent)
            tempTrail := close * (1 - trailingStopOffsetPercent)
            if na(longTrail) or tempTrail > longTrail
                longTrail := tempTrail

    if useAtrTrailingStop
        float atrTrail = close - (atrTrailingValue * atrTrailingStopMult)
        if na(longTrail) or atrTrail > longTrail
            longTrail := atrTrail

if strategy.position_size < 0
    // Calculate trailing stop
    float tempTrail = na

    if useTrailingStop
        if close < strategy.position_avg_price * (1 - trailingStopActivationPercent)
            tempTrail := close * (1 + trailingStopOffsetPercent)
            if na(shortTrail) or tempTrail < shortTrail
                shortTrail := tempTrail

    if useAtrTrailingStop
        float atrTrail = close + (atrTrailingValue * atrTrailingStopMult)
        if na(shortTrail) or atrTrail < shortTrail
            shortTrail := atrTrail

// === Strategy Execution ===
if longCondition
    strategy.entry("Long", strategy.long)
    longTrail := na  // Reset on new entry
    shortTrail := na // Reset on new entry

if shortCondition
    strategy.entry("Short", strategy.short)
    shortTrail := na // Reset on new entry
    longTrail := na  // Reset on new entry

// Unified exit logic with proper ordering
if strategy.position_size > 0
    // Define effective stop level (combining hard stop and trailing stop)
    float effectiveStopLevel = na

    if not na(longHardStopLossPrice) and useHardStopLoss
        effectiveStopLevel := longHardStopLossPrice

    if not na(longTrail) and (useTrailingStop or useAtrTrailingStop)
        if na(effectiveStopLevel) or longTrail > effectiveStopLevel
            effectiveStopLevel := longTrail

    // Combined exit strategy with proper parameters
    strategy.exit("Long Exit", "Long",
                 limit = useAtrTakeProfit ? longTakeProfitPrice : na,
                 stop = effectiveStopLevel)

if strategy.position_size < 0
    // Define effective stop level (combining hard stop and trailing stop)
    float effectiveStopLevel = na

    if not na(shortHardStopLossPrice) and useHardStopLoss
        effectiveStopLevel := shortHardStopLossPrice

    if not na(shortTrail) and (useTrailingStop or useAtrTrailingStop)
        if na(effectiveStopLevel) or shortTrail < effectiveStopLevel
            effectiveStopLevel := shortTrail

    // Combined exit strategy with proper parameters
    strategy.exit("Short Exit", "Short",
                 limit = useAtrTakeProfit ? shortTakeProfitPrice : na,
                 stop = effectiveStopLevel)

// === Plotting ===
plotColorMa1 = nw_ma1 > nw_ma1[1] ? color.rgb(100, 250, 120) : color.rgb(255, 100, 120)
plotColorMa2 = nw_ma2 > nw_ma2[1] ? color.rgb(100, 250, 120) : color.rgb(255, 100, 120)
plotColorMa3 = nw_ma3 > nw_ma3[1] ? color.rgb(100, 250, 120) : color.rgb(255, 100, 120)
plotColorMa4 = nw_ma4 > nw_ma4[1] ? color.rgb(100, 250, 120) : color.rgb(255, 100, 120)
plotColorMa5 = nw_ma5 > nw_ma5[1] ? color.rgb(100, 250, 120) : color.rgb(255, 100, 120)

plot(nw_ma1, title="NW MA 1", color=plotColorMa1, linewidth=2)
plot(nw_ma2, title="NW MA 2", color=plotColorMa2, linewidth=2)
plot(nw_ma3, title="NW MA 3", color=plotColorMa3, linewidth=2)
plot(nw_ma4, title="NW MA 4", color=plotColorMa4, linewidth=2)
plot(nw_ma5, title="NW MA 5", color=plotColorMa5, linewidth=2)