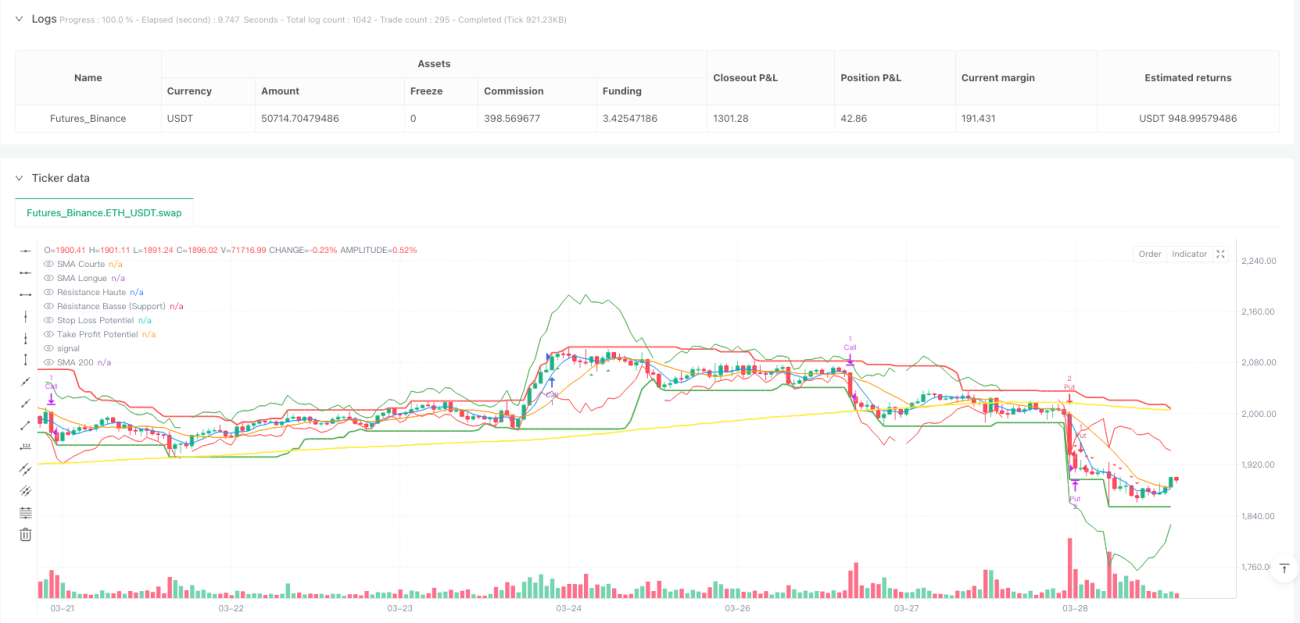
Стратегия многомерного краткосрочного прогнозирования тренда: технический анализ и метод адаптивной торговли с учетом волатильности

SMA RSI ADX ATR MACD STOCH
Дата создания: 2025-03-31 16:30:52 Последнее изменение: 2025-03-31 16:30:52
Копировать: 0 Количество просмотров: 335
2
Подписаться
319
Подписчики

Стратегия многомерного краткосрочного прогнозирования тренда: технический анализ и метод адаптивной торговли с учетом волатильности Стратегия многомерного краткосрочного прогнозирования тренда: технический анализ и метод адаптивной торговли с учетом волатильности

Обзор

Эта стратегия является многомерной стратегией прогнозирования краткосрочных тенденций, которая фокусируется на использовании синхронного эффекта нескольких технических индикаторов для идентификации и прогнозирования краткосрочных изменений тенденций на финансовых рынках. Эта стратегия объединяет ключевые инструменты технического анализа, такие как простая скользящая средняя (SMA), относительно сильный индекс (RSI), средний ориентировочный индекс (ADX), средний реальный диапазон колебаний (ATR), средний средний диапазон колебаний (MACD) и случайный колебатель (Stochastic), чтобы повысить точность и надежность торговых сигналов.

Стратегический принцип

Ключевые принципы стратегии основаны на синхронном анализе и признании тенденций по нескольким техническим показателям. Торговые сигналы генерируются с учетом следующих ключевых факторов:

  1. Скрещивание краткосрочных и долгосрочных скользящих средних
  2. RSI перекупает и перепродает
  3. Изменения в линии MACD и линии сигнала
  4. Показатель динамики случайного колебателя
  5. Сила тренда на ADX
  6. Общая тенденция рынка в 200-х циклических скользящих средних
  7. Недавняя волатильность рынка
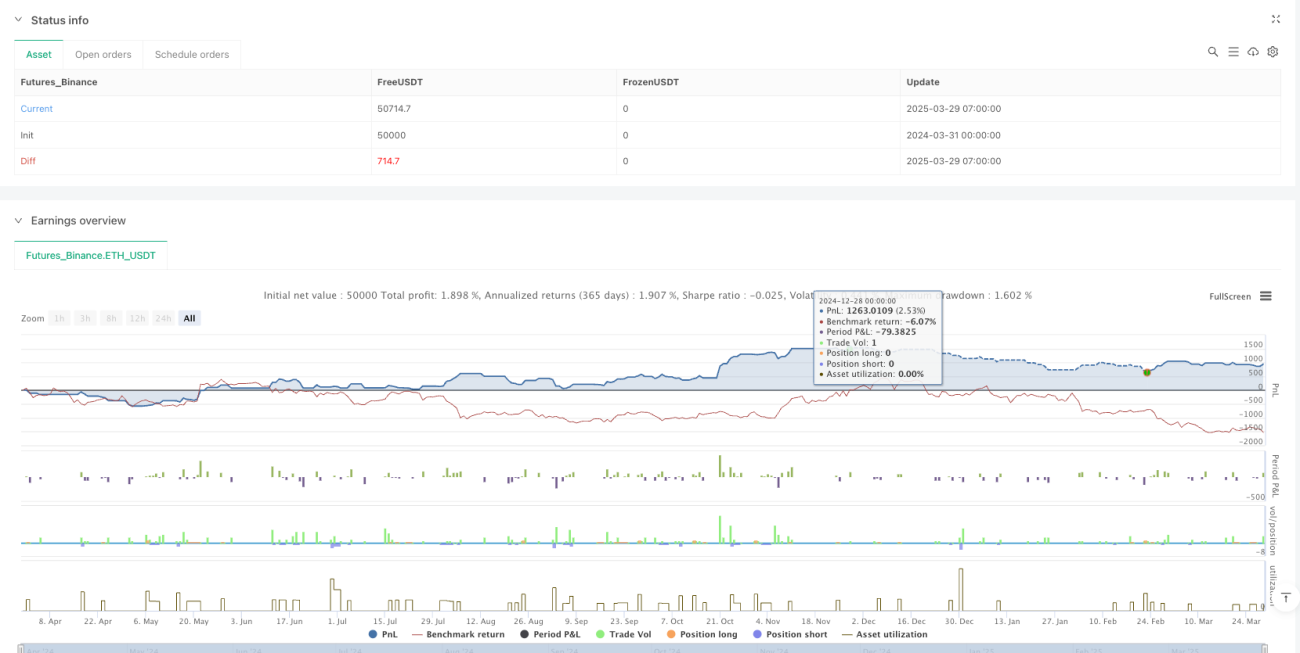
Стратегия позволяет управлять рисками и выполнять сделки, динамически рассчитывая потенциальные точки входа, уровни остановок и остановок и корректируя эти ключевые параметры в соответствии с недавней волатильностью рынка.

Стратегические преимущества

  1. Комплексный анализ с несколькими показателями: снижение риска ошибочных суждений, которые могут быть вызваны одним показателем, путем объединения нескольких технических показателей
  2. Динамический риск-менеджмент: ATR-основанный механизм остановки и остановки, позволяющий корректировать позиции в зависимости от волатильности рынка
  3. Гибкие временные рамки: поддержка торговых циклов от 5 минут до 4 часов
  4. Размер адаптированной позиции: размер позиции динамически корректируется в зависимости от имеющегося капитала и процента риска на одну сделку
  5. Подтверждение силы тренда: подтверждение эффективности тренда с помощью индикатора ADX, избегание частого трейдинга на колеблющихся рынках

Стратегический риск

  1. Многозначительная сложность может привести к задержкам в генерации сигнала
  2. В условиях высокой нестабильности рынка индикаторы могут давать противоречивые сигналы
  3. Результаты отслеживания могут не полностью отражать реальную торговлю в будущем.
  4. Леверинговые сделки могут значительно увеличить потери
  5. Не учитываются фундаментальные факторы и внезапные события на рынке

Направление оптимизации стратегии

  1. Внедрение алгоритмов машинного обучения, динамическая настройка весов показателей
  2. Добавить больше основных и эмоциональных показателей
  3. Разработка более интеллектуальных алгоритмов управления позициями
  4. Персонализированные параметры для различных рынков и типов активов
  5. Интеграция новостей в реальном времени и социальных сетей

Подвести итог

Это многомерная, управляемая данными стратегия прогнозирования краткосрочных тенденций, направленная на повышение точности и надежности принятия торговых решений с помощью сложного сочетания технических показателей и динамического механизма управления рисками. Несмотря на значительные теоретические преимущества стратегии, в практическом применении требуется осторожность и постоянная обратная связь и оптимизация.

Исходный код стратегии
/*backtest
start: 2024-03-31 00:00:00
end: 2025-03-29 08:00:00
period: 1h
basePeriod: 1h
exchanges: [{"eid":"Futures_Binance","currency":"ETH_USDT"}]
*/

// © HugoMora
//@version=5
strategy("Short-Term Trend Predictor: Call/Put (5min to 4hr)", overlay=true)

// --- 1. Paramètres (Inputs) ---
// Info-bulle pour short_length
short_length = input.int(5, title="Période SMA Courte", minval=1, tooltip = "Période de la moyenne mobile courte. Utilisée pour identifier les tendances à court terme.")
long_length = input.int(13, title="Période SMA Longue", minval=1, tooltip = "Période de la moyenne mobile longue. Utilisée pour confirmer les tendances à plus long terme.")
rsi_length = input.int(14, title="Période RSI", minval=1, tooltip = "Période de l'indice de force relative (RSI). Mesure la vitesse et l'ampleur des mouvements de prix récents pour évaluer les conditions de surachat ou de survente.")
sma200_length = input.int(200, title="Période SMA 200", minval=1, tooltip = "Période de la moyenne mobile sur 200 périodes. Utilisée pour déterminer la tendance générale du marché (haussière ou baissière).")
resistance_length = input.int(20, title="Période Résistance", minval=1, tooltip="Nombre de périodes utilisées pour calculer les niveaux de résistance et de support.")
macd_fast = input.int(12, title="Longueur Rapide MACD", tooltip = "Période plus courte utilisée dans le calcul de la ligne MACD. Représente les mouvements de prix à court terme.")
macd_slow = input.int(26, title="Longueur Lente MACD", tooltip = "Période plus longue utilisée dans le calcul de la ligne MACD. Représente les mouvements de prix à long terme.")
macd_signal = input.int(9, title="Période Signal MACD", tooltip = "Période de la SMA de la ligne MACD, utilisée comme signal d'achat ou de vente.")
stoch_k = input.int(14, title="Longueur %K Stoch", tooltip = "Période utilisée pour calculer la ligne %K du Stochastic Oscillator, indiquant où le prix de clôture se situe par rapport à la fourchette haute-basse sur cette période.")
stoch_d = input.int(3, title="Longueur %D Stoch", tooltip = "Période utilisée pour calculer la ligne %D, qui est une moyenne mobile de %K. Utilisée pour lisser les fluctuations de %K.")
adx_length = input.int(14, title="Longueur ADX", tooltip = "Période utilisée pour calculer l'Average Directional Index (ADX), qui mesure la force de la tendance.")
adx_smooth = input.int(14, title="Lissage ADX", tooltip = "Période utilisée pour lisser la ligne ADX, réduisant le bruit et fournissant une mesure plus stable de la force de la tendance.")
atrLength = input.int(14, title="Longueur ATR", tooltip = "Période utilisée pour calculer l'Average True Range (ATR), qui mesure la volatilité du marché.")
atrMultiplierSL = input.float(2.0, title="Multiplicateur ATR Stop Loss", minval=0.1, tooltip = "Multiplicateur de l'ATR pour déterminer le niveau de Stop Loss. Un multiplicateur plus élevé signifie un Stop Loss plus éloigné du prix d'entrée.")
atrMultiplierTP = input.float(2.0, title="Multiplicateur ATR Take Profit", minval=0.1, tooltip = "Multiplicateur de l'ATR pour déterminer le niveau de Take Profit. Un multiplicateur plus élevé signifie un Take Profit plus éloigné du prix d'entrée.")
takeProfitRiskRatio = input.float(2.0, title="Ratio Take Profit/Risque", minval=0.1, tooltip = "Ratio du Take Profit par rapport au risque (Stop Loss). Par exemple, un ratio de 2 signifie que le Take Profit est deux fois plus éloigné que le Stop Loss.")
volatility_lookback = input.int(20, title="Volatilité Récente (Périodes)", minval=5, tooltip="Nombre de périodes utilisées pour calculer la volatilité récente du marché, mesurée par l'écart-type des prix de clôture.") // Paramètre pour la volatilité
initialCapital = input.float(100, title="Capital Initial (€)", minval=1, tooltip = "Capital initial utilisé pour le backtest de la stratégie.") // Capital initial de 100€
riskPerTrade = input.float(1.0, title="Risque par Trade (%)", minval=0.01, maxval=1.0, tooltip = "Pourcentage du capital initial risqué par trade. Utilisé pour calculer la taille de la position.") // Risk is 100% of available capital
leverage = input.int(1, title="Levier", minval=1, tooltip = "Effet de levier appliqué aux trades. Multiplie les profits et les pertes.")   // Add leverage input

// --- 2. Calcul des Indicateurs et des Résistances ---
sma_short = ta.sma(close, short_length)
sma_long = ta.sma(close, long_length)
rsi = ta.rsi(close, rsi_length)
sma200 = ta.sma(close, sma200_length)
isUptrend = ta.rising(sma200, 5)
isDowntrend = ta.falling(sma200, 5)
resistance_high = ta.highest(high, resistance_length)
resistance_low = ta.lowest(low, resistance_length)
[macdLine, signalLine, hist] = ta.macd(close, macd_fast, macd_slow, macd_signal)
stochK = ta.stoch(close, high, low, stoch_k)
stochD = ta.sma(stochK, stoch_d)
[diPlus, diMinus, adx] = ta.dmi(adx_length, adx_smooth)
atrValue = ta.atr(atrLength)

// Calcul de la volatilité récente (écart-type des prix)
recentVolatility = ta.stdev(close, volatility_lookback)

// --- 3. Détection des Croisements et Conditions ---
short_above_long = sma_short > sma_long and macdLine > signalLine and stochK > stochD and adx > 25 and diPlus > diMinus
short_below_long = sma_short < sma_long and macdLine < signalLine and stochK < stochD and adx > 25 and diMinus > diPlus // Modified stochK < stochD
long_enter = ta.crossover(sma_short,sma_long)
short_enter = ta.crossunder(sma_short,sma_long)

// --- 4. Analyse de Tendance et Recommandations et Points d'Entrée/Sortie Potentiels ---
var string tendance = ""
var color tendance_couleur = color.gray // Couleur neutre par défaut
var float potentialEntry = na
var float potentialStopLoss = na
var float potentialTakeProfit = na

if (isUptrend and short_above_long)
    tendance := "Haussier Fort (Call)"
    tendance_couleur := color.green
    potentialEntry := high
    // Utilisation de la volatilité récente pour le Stop Loss et le Take Profit
    potentialStopLoss := potentialEntry - (recentVolatility * atrMultiplierSL)
    potentialTakeProfit := potentialEntry + (recentVolatility * atrMultiplierTP)

else if (isUptrend and not short_above_long and not short_below_long) // Added check to prevent both conditions being true
    tendance := "Haussier Modéré (Call)"
    tendance_couleur := color.lime
    potentialEntry := high
    potentialStopLoss := potentialEntry - (recentVolatility * atrMultiplierSL)
    potentialTakeProfit := potentialEntry + (recentVolatility * atrMultiplierTP)

else if (isDowntrend and short_below_long)
    tendance := "Baissier Fort (Put)"
    tendance_couleur := color.red
    potentialEntry := low
    potentialStopLoss := potentialEntry + (recentVolatility * atrMultiplierSL)
    potentialTakeProfit := potentialEntry - (recentVolatility * atrMultiplierTP)

else if (isDowntrend and not short_below_long and not short_above_long) // Added check to prevent both conditions being true
    tendance := "Baissier Modéré (Put)"
    tendance_couleur := color.orange
    potentialEntry := low
    potentialStopLoss := potentialEntry + (recentVolatility * atrMultiplierSL)
    potentialTakeProfit := potentialEntry - (recentVolatility * atrMultiplierTP)

else
    tendance := "Neutre"
    tendance_couleur := color.gray
    potentialEntry := na
    potentialStopLoss := na
    potentialTakeProfit := na

// --- 5. Affichage de la Tendance (Label Persistant) ---
var label tendance_label = na

if (barstate.islast)
    if (na(tendance_label))
        tendance_label := label.new(bar_index, high, text="Tendance: " + tendance, color=tendance_couleur, textcolor=color.white, style=label.style_label_down, yloc=yloc.abovebar, y=high*1.02)
        label.set_tooltip(tendance_label, "Tendance actuelle du marché")  // Ajout du tooltip au label
    else
        label.set_text(tendance_label, "Tendance: " + tendance)
        label.set_x(tendance_label, bar_index)
        label.set_y(tendance_label, high*1.02)
        label.set_color(tendance_label, tendance_couleur)
        label.set_tooltip(tendance_label, "Tendance actuelle du marché")
// --- 6. Tableau d'Information ---
var table info_table = table.new(position.top_right, 2, 12, border_width=1) // Ajout d'une ligne pour le capital
var float currentCapital = initialCapital // Declare currentCapital here

table.cell(info_table, 0, 0, "Indicateur", bgcolor=color.gray, text_color=color.white)
table.cell(info_table, 1, 0, "Valeur", bgcolor=color.gray, text_color=color.white)
table.cell(info_table, 0, 1, "SMA Courte", bgcolor=color.white, text_color=color.black)
table.cell(info_table, 1, 1, str.tostring(sma_short, "#.##"), bgcolor=color.white, text_color=color.black)
table.cell_set_tooltip(info_table, 0, 1, "Moyenne mobile courte")
table.cell_set_tooltip(info_table, 1, 1, str.tostring(sma_short, "#.##"))

table.cell(info_table, 0, 2, "SMA Longue", bgcolor=color.white, text_color=color.black)
table.cell(info_table, 1, 2, str.tostring(sma_long, "#.##"), bgcolor=color.white, text_color=color.black)
table.cell_set_tooltip(info_table, 0, 2, "Moyenne mobile longue")
table.cell_set_tooltip(info_table, 1, 2, str.tostring(sma_long, "#.##"))

table.cell(info_table, 0, 3, "RSI", bgcolor=color.white, text_color=color.black)
table.cell(info_table, 1, 3, str.tostring(rsi, "#.##"), bgcolor=color.white, text_color=color.black)
table.cell_set_tooltip(info_table, 0, 3, "Indice de force relative")
table.cell_set_tooltip(info_table, 1, 3, str.tostring(rsi, "#.##"))

table.cell(info_table, 0, 4, "Tendance", bgcolor=color.white, text_color=color.black)
table.cell(info_table, 1, 4, tendance, bgcolor=color.white, text_color=color.black)
table.cell_set_tooltip(info_table, 0, 4, "Tendance actuelle du marché")
table.cell_set_tooltip(info_table, 1, 4, tendance)

table.cell(info_table, 0, 5, "Point d'entrée Potentiel", bgcolor=color.white, text_color=color.black)
table.cell(info_table, 1, 5, str.tostring(potentialEntry, "#.##"), bgcolor=color.white, text_color=color.black)
table.cell_set_tooltip(info_table, 0, 5, "Point d'entrée suggéré pour un trade")
table.cell_set_tooltip(info_table, 1, 5, str.tostring(potentialEntry, "#.##"))

table.cell(info_table, 0, 6, "Stop Loss Potentiel", bgcolor=color.white, text_color=color.black)
table.cell(info_table, 1, 6, str.tostring(potentialStopLoss, "#.##"), bgcolor=color.white, text_color=color.black)
table.cell_set_tooltip(info_table, 0, 6, "Niveau de prix auquel fermer automatiquement une position pour limiter les pertes")
table.cell_set_tooltip(info_table, 1, 6, str.tostring(potentialStopLoss, "#.##"))

table.cell(info_table, 0, 7, "Take Profit Potentiel", bgcolor=color.white, text_color=color.black)
table.cell(info_table, 1, 7, str.tostring(potentialTakeProfit, "#.##"), bgcolor=color.white, text_color=color.black)
table.cell_set_tooltip(info_table, 0, 7, "Niveau de prix auquel fermer automatiquement une position pour sécuriser les profits")
table.cell_set_tooltip(info_table, 1, 7, str.tostring(potentialTakeProfit, "#.##"))

table.cell(info_table, 0, 8, "Résistance Haute", bgcolor=color.white, text_color=color.red)
table.cell(info_table, 1, 8, str.tostring(resistance_high, "#.##"), bgcolor=color.white, text_color=color.red)
table.cell_set_tooltip(info_table, 0, 8, "Niveau de prix auquel on s'attend à ce que la pression vendeuse l'emporte sur la pression acheteuse")
table.cell_set_tooltip(info_table, 1, 8, str.tostring(resistance_high, "#.##"))

table.cell(info_table, 0, 9, "Résistance Basse", bgcolor=color.white, text_color=color.green)
table.cell(info_table, 1, 9, str.tostring(resistance_low, "#.##"), bgcolor=color.white, text_color=color.green)
table.cell_set_tooltip(info_table, 0, 9, "Niveau de prix auquel on s'attend à ce que la pression acheteuse l'emporte sur la pression vendeuse")
table.cell_set_tooltip(info_table, 1, 9, str.tostring(resistance_low, "#.##"))

table.cell(info_table, 0, 10, "ATR", bgcolor=color.white, text_color=color.black)
table.cell(info_table, 1, 10, str.tostring(atrValue, "#.##"), bgcolor=color.white, text_color=color.black)
table.cell_set_tooltip(info_table, 0, 10, "Average True Range")
table.cell_set_tooltip(info_table, 1, 10, str.tostring(atrValue, "#.##"))

table.cell(info_table, 0, 11, "Volatilité Récente", bgcolor=color.white, text_color=color.black)
table.cell(info_table, 1, 11, str.tostring(recentVolatility, "#.##"), bgcolor=color.white, text_color=color.black)
table.cell_set_tooltip(info_table, 0, 11, "Volatilité du marché calculée sur les dernières périodes")
table.cell_set_tooltip(info_table, 1, 11, str.tostring(recentVolatility, "#.##"))
// --- 7. Tracé des Indicateurs et des Résistances ---
plot(sma_short, color=color.blue, title="SMA Courte")
plot(sma_long, color=color.orange, title="SMA Longue")
plot(sma200, color=color.yellow, title="SMA 200", linewidth=2)
plot(resistance_high, color=color.red, title="Résistance Haute", linewidth=2, style=plot.style_linebr)
plot(resistance_low, color=color.green, title="Résistance Basse (Support)", linewidth=2, style=plot.style_linebr)

// --- 8. Tracé des Points d'Entrée et de Sortie Potentiels ---
plotshape(isUptrend and short_above_long, title="Entrée Call Potentielle", style=shape.triangleup, location=location.belowbar, color=color.green, size=size.small, offset=0)
plotshape(isDowntrend and short_below_long, title="Entrée Put Potentielle", style=shape.triangledown, location=location.abovebar, color=color.red, size=size.small, offset=0)

plot(potentialStopLoss, color=color.red, title="Stop Loss Potentiel", linewidth=1, style=plot.style_linebr)
plot(potentialTakeProfit, color=color.green, title="Take Profit Potentiel", linewidth=1, style=plot.style_linebr)

// --- 9. Ajout des Noms des Courbes ---
if barstate.islast
    var label_sma_short = label.new(bar_index, sma_short, "SMA Courte", color=color.blue, style=label.style_label_left)
    label.set_tooltip(label_sma_short, "Moyenne mobile Courte")
    var label_sma_long = label.new(bar_index, sma_long, "SMA Longue", color=color.orange, style=label.style_label_left)
    label.set_tooltip(label_sma_long, "Moyenne mobile Longue")
    var label_sma200 = label.new(bar_index, sma200, "SMA 200", color=color.yellow, style=label.style_label_left)
    label.set_tooltip(label_sma200, "Moyenne mobile 200")
    var label_resistance_high = label.new(bar_index, resistance_high, "Résistance Haute", color=color.red, style=label.style_label_left)
    label.set_tooltip(label_resistance_high, "Niveau de Résistance Haute")
    var label_resistance_low = label.new(bar_index, resistance_low, "Résistance Basse", color=color.green, style=label.style_label_left)
    label.set_tooltip(label_resistance_low, "Niveau de Résistance Basse")

// --- 10. Backtest ---
var int tradesCount = 0
var int winningTradesCount = 0
var int losingTradesCount = 0
var float totalProfit = 0.0
var float maxDrawdown = 0.0
var float previousPeak = initialCapital
var int currentPosition = 0 // 0: no position, 1: long (Call), -1: short (Put)
var float entryPrice = 0.0
var float positionSize = 0.0
var float stopLossPrice = 0.0
var float takeProfitPrice = 0.0
var int entryDate = 0
var int exitDate = 0
var float exitPrice = 0.0 // Declare exitPrice here
var float tradeProfit = 0.0
currentCapital := initialCapital // Reset capital at the beginning of the backtest

if (currentPosition == 0) // No open position
    if (isUptrend and short_above_long)
        // Enter a long position (Call)
        tradesCount := tradesCount + 1
        entryPrice := potentialEntry
        positionSize := math.floor((currentCapital * riskPerTrade * leverage) / (entryPrice - potentialStopLoss)) // Position size based on risk
        if (positionSize > 0) // check if positionSize is valid
            currentPosition := 1
            stopLossPrice := potentialStopLoss
            takeProfitPrice := potentialTakeProfit
            entryDate := time
            strategy.entry("Call", strategy.long, qty=positionSize, comment="Call Entry", stop=stopLossPrice, limit=takeProfitPrice) // Utilisez strategy.entry
    else if (isDowntrend and short_below_long)
        // Enter a short position (Put)
        tradesCount := tradesCount + 1
        entryPrice := potentialEntry
        positionSize := math.floor((currentCapital * riskPerTrade * leverage) / (potentialStopLoss - entryPrice)) // Position size based on risk
        if (positionSize > 0) // check if positionSize is valid
            currentPosition := -1
            stopLossPrice := potentialStopLoss
            takeProfitPrice := potentialTakeProfit
            entryDate := time
            strategy.entry("Put", strategy.short, qty=positionSize, comment="Put Entry", stop=stopLossPrice, limit=takeProfitPrice) // Utilisez strategy.entry

else if (currentPosition != 0) // There is an open position
    if (currentPosition == 1) // Long position (Call)
        if (low <= stopLossPrice or high >= takeProfitPrice)
            // Exit the long position
            exitPrice := low <= stopLossPrice ? stopLossPrice : takeProfitPrice
            tradeProfit := positionSize * (exitPrice - entryPrice)
            currentCapital := currentCapital + tradeProfit
            totalProfit := totalProfit + tradeProfit
            if (tradeProfit > 0)
                winningTradesCount := winningTradesCount + 1
            else
                losingTradesCount := losingTradesCount + 1
            currentPosition := 0
            exitDate := time
            strategy.close("Call", comment="Call Exit", qty=positionSize) // Utilisez strategy.close
    else if (currentPosition == -1) // Short position (Put)
        if (high >= stopLossPrice or low <= takeProfitPrice)
            // Exit the short position
            exitPrice := high >= stopLossPrice ? stopLossPrice : takeProfitPrice
            tradeProfit := positionSize * (entryPrice - exitPrice)  // Short position profit
            currentCapital := currentCapital + tradeProfit
            totalProfit := totalProfit + tradeProfit
            if (tradeProfit > 0)
                winningTradesCount := winningTradesCount + 1
            else
                losingTradesCount := losingTradesCount + 1
            currentPosition := 0
            exitDate := time
            strategy.close("Put", comment="Put Exit", qty=positionSize) // Utilisez strategy.close

// --- 11. Calcul des métriques de performance ---
if (currentCapital > previousPeak)
    previousPeak := currentCapital
var float drawdown = 0.0
drawdown := previousPeak - currentCapital
if (drawdown > maxDrawdown)
    maxDrawdown := drawdown

var float winRate = 0.0
var float averageProfit = 0.0
var float averageLoss = 0.0
var float profitFactor = 0.0

winRate := tradesCount > 0 ? (winningTradesCount / tradesCount) * 100 : 0
averageProfit := winningTradesCount > 0 ? totalProfit / winningTradesCount : 0
averageLoss := losingTradesCount > 0 ? totalProfit / losingTradesCount : 0
profitFactor := averageLoss != 0 ? math.abs(averageProfit / averageLoss) : 0