
Обзор
Стратегия адаптивного момента на основе теории Доу — это продвинутый торговый подход, основанный на классических принципах теории Доу, предназначенный для принятия торговых решений путем выявления ключевых точек разворота рыночных тенденций. Стратегия сосредоточена на обнаружении и подтверждении фундаментальной динамики ценовых трендов, используя более высокие максимумы (Higher Highs) и более высокие минимумы (Higher Lows) для определения восходящего тренда, а также более низкие максимумы (Lower Highs) и более низкие минимумы (Lower Lows) для определения нисходящего тренда. Данный метод направлен на предоставление систематического подхода к захвату рыночных тенденций и своевременному реагированию при их изменении.
Принцип стратегии
Основной принцип стратегии базируется на классическом методе идентификации трендов теории Доу. Стратегия обнаруживает ключевые точки разворота с помощью функций ta.pivothigh() и ta.pivotlow(). Конкретная реализация включает следующие ключевые шаги:
- Обнаружение точек разворота: Используется параметр
pivotLookbackдля определения количества баров с обеих сторон, что позволяет идентифицировать максимумы и минимумы. - Подтверждение тренда: Восходящий тренд подтверждается только при одновременном соблюдении условий более высоких максимумов и более высоких минимумов; аналогично, нисходящий тренд подтверждается только при одновременном соблюдении условий более низких максимумов и более низких минимумов.
- Устойчивость тренда: Если условия смены тренда не выполняются, стратегия сохраняет предыдущее состояние тренда, обеспечивая более плавное отслеживание.
Преимущества стратегии
- Динамическое выявление тренда: Благодаря непрерывному анализу ключевых точек разворота стратегия динамически улавливает изменения рыночных тенденций.
- Гибкие режимы торговли: Предоставляет три режима — автоматический, только длинные позиции и только короткие позиции, удовлетворяя потребности разных трейдеров.
- Управление рисками: Встроенные механизмы стоп-лосс и тейк-профит позволяют эффективно контролировать риск по каждой отдельной сделке.
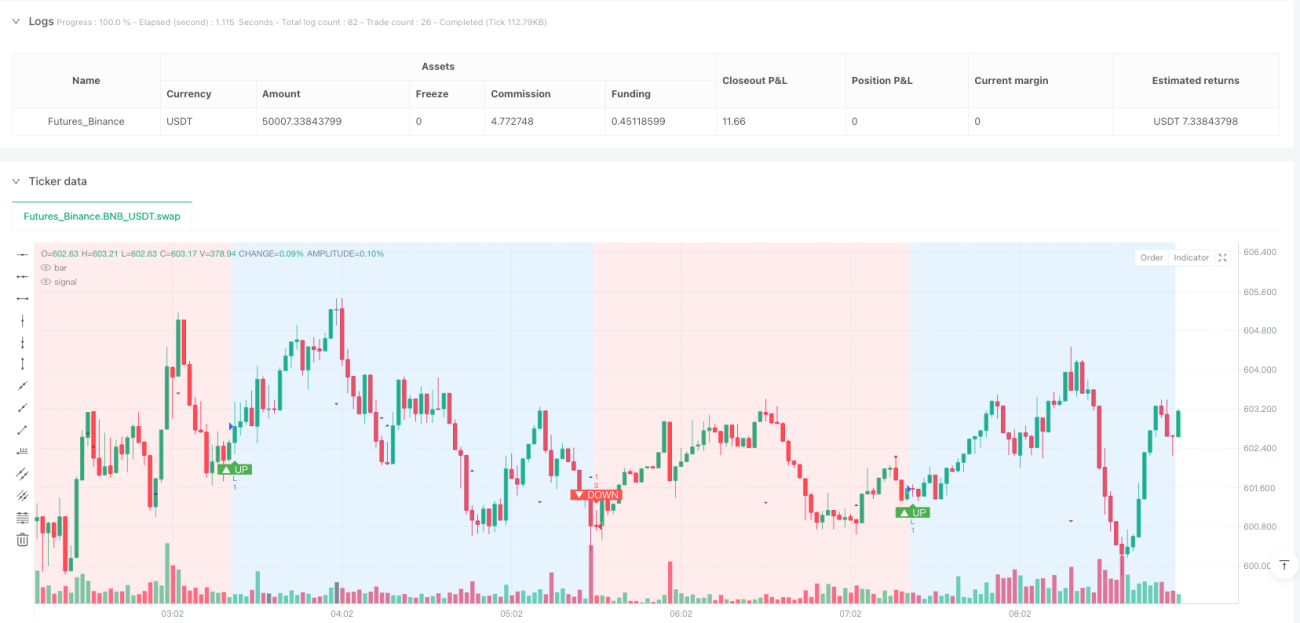
- Визуализация тренда: Направление тренда наглядно отображается с помощью цветов фона и маркеров, что упрощает понимание рыночной ситуации трейдером.
- Низкая задержка: По сравнению с традиционными стратегиями на скользящих средних, данный метод быстрее реагирует на изменения тренда.
Риски стратегии
- Риск запаздывания: Из-за использования обнаружения точек разворота стратегия имеет врожденный риск запаздывания и может не улавливать самые ранние сигналы тренда.
- Риск бокового рынка: На рынках с нечеткими колебаниями частые небольшие ценовые движения могут приводить к ненужным сделкам.
- Чувствительность к параметрам: Выбор параметра
pivotLookbackсущественно влияет на производительность стратегии; требуется настройка для разных рынков и таймфреймов. - Торговые издержки: Частая торговля может привести к высоким операционным расходам, особенно при высоких комиссионных ставках.
Направления оптимизации стратегии
- Внедрение дополнительных фильтров: Комбинирование с индикаторами силы тренда (например, ATR) для отсеивания слабых трендовых сигналов.
- Динамическая настройка параметров: Разработка адаптивного механизма параметра
pivotLookbackна основе рыночной волатильности. - Мультитаймфреймовая верификация: Перекрестная проверка трендовых сигналов на разных таймфреймах для повышения их надежности.
- Усиление с помощью машинного обучения: Исследование возможностей использования алгоритмов машинного обучения для оптимизации идентификации трендов и моментов входа.
- Оптимизация управления рисками: Динамическая корректировка расстояний стоп-лосса и тейк-профита в зависимости от рыночной волатильности.
Заключение
Стратегия адаптивного момента на основе теории Доу представляет собой мощный метод следования за трендом, который благодаря инновационному анализу точек разворота предоставляет трейдерам систематизированный инструмент для выявления трендов. Несмотря на некоторые присущие риски, ее гибкость и динамичность делают ее ценным подходом в арсенале современных количественных торговых стратегий. Успешное применение данной стратегии требует глубокого понимания ее принципов работы и постоянной оптимизации и настройки в соответствии с конкретными рыночными условиями.
- Ввести дополнительные фильтры: комбинировать индикаторы силы тренда (например, ATR) для отсеивания слабых трендовых сигналов.
- Динамическая настройка параметров: разработать адаптивный механизм параметра pivotLookback на основе рыночной волатильности.
- Мультитаймфреймная верификация: перекрёстно проверять трендовые сигналы на разных таймфреймах для повышения их надёжности.
- Улучшение с помощью машинного обучения: изучить возможность применения алгоритмов машинного обучения для оптимизации идентификации трендов и выбора момента входа.
- Оптимизация управления рисками: динамически корректировать расстояния до стоп-лосса и тейк-профита в зависимости от рыночной волатильности.
Заключение
Стратегия адаптивного импульсного следования за трендом на основе теории Доу — это мощный метод трейдинга, следующий за трендом. Благодаря инновационным методам анализа точек разворота она предоставляет трейдерам систематический инструмент для идентификации трендов. Несмотря на присущие ей риски, её гибкость и динамичность делают её ценным подходом в современных стратегиях количественной торговли. Успешное применение данной стратегии требует глубокого понимания принципов её работы, а также постоянной оптимизации и адаптации к конкретным рыночным условиям.
/*backtest
start: 2025-03-29 00:00:00
end: 2025-03-30 09:00:00
period: 2m
basePeriod: 2m
exchanges: [{"eid":"Futures_Binance","currency":"BNB_USDT"}]
*/

//@version=5
// strategy(title="Dow Theory Trend Strategy v3", shorttitle="Dow Trend Strat v3", overlay=true,
//      initial_capital=10000, default_qty_type=strategy.percent_of_equity, default_qty_value=10,
// commission_type=strategy.commission.percent, commission_value=0.1, // Example strategy settings with commission- 1