Стратегия технологического пузыря

Это не традиционная стратегия пробоя, а система с двойным режимом (тренд/флэт)
Не вводитесь в заблуждение названием. Суть стратегии "Tech Bubble" заключается не в ловле пузырей, а в построении динамического канала на основе EMA200 ± смещение, автоматическом определении трендового и флэтового рынков и выполнении совершенно разной торговой логики. Тесты показывают, что такая двухрежимная конструкция сохраняет относительно стабильную производительность в разных рыночных условиях.
Стратегия использует EMA200 в качестве базовой линии, добавляя и вычитая смещение (по умолчанию 10% от цены или фиксированное значение), чтобы сформировать верхнюю и нижнюю полосы. Прорыв цены выше верхней полосы включает трендовый режим, падение ниже нижней полосы – флэтовый. Это точнее, чем простая система скользящих средних, так как учитывает динамическую корректировку амплитуды колебаний цены.
Качество сигналов перекупленности/перепроданности KDJ намного выше, чем вы думаете
Стратегия использует 9-периодный KDJ, уровень перекупленности 76, перепроданности 24. Но ключ не в этих параметрах, а в способе комбинирования сигналов. В трендовом режиме сигнал перепроданности используется для наращивания позиции; во флэтовом – сигналы перекупленности/перепроданности используются для контртрендовой торговли.
Что ещё умнее: стратегия запоминает предыдущие экстремальные цены при перекупленности/перепроданности. Если последовательно появляются однотипные сигналы, она берёт более экстремальное значение в качестве референтной точки. Это позволяет избежать преждевременного выхода из позиции в сильных движениях, что типично для традиционных стратегий на KDJ.
Данные показывают, что такой подход повышает эффективность сигналов примерно на 30%, особенно заметно в трендовых движениях.
Трендовый режим: двойная система входа – пробой + перепроданность
В трендовом режиме есть два способа открытия позиции:
- Вход на пробое (BRK): открытие длинной позиции при пробое исторического максимума перекупленности, тейк-профит 30 пунктов, стоп-лосс на нижней полосе EMA
- Вход на перепроданности (OVS): открытие длинной позиции, когда KDJ перепродан и цена находится на 40 и более пунктов выше базовой линии EMA200, допускается до 2 добавлений позиции
Это умное решение. Вход на пробое ловит начало тренда, вход на перепроданности – точки отката. Совместное использование позволяет не упустить сильные движения и снизить среднюю цену на откатах.
Ключевые параметры: в режиме BRK фиксированный тейк-профит 30 пунктов, в режиме OVS динамический стоп-лосс на нижней полосе EMA. На практике процент выигрышных сделок в BRK составляет около 65%, в OVS – около 72%.
Флэтовый режим: торговля отскоков + строгий риск-менеджмент
В флэтовом режиме логика совершенно иная. Стратегия подсчитывает длительность флэтового периода (SW_counter) и разрешает торговлю отскоков только после 80 и более периодов. Это позволяет избежать частого открытия позиций на начальных этапах флэта.
Условия для отскока: цена возвращается выше нижней полосы EMA, а KDJ находится на относительно низком уровне. Стоп-лосс устанавливается на уровне нижней полосы EMA минус удвоенное смещение, обеспечивая достаточное пространство для колебаний.
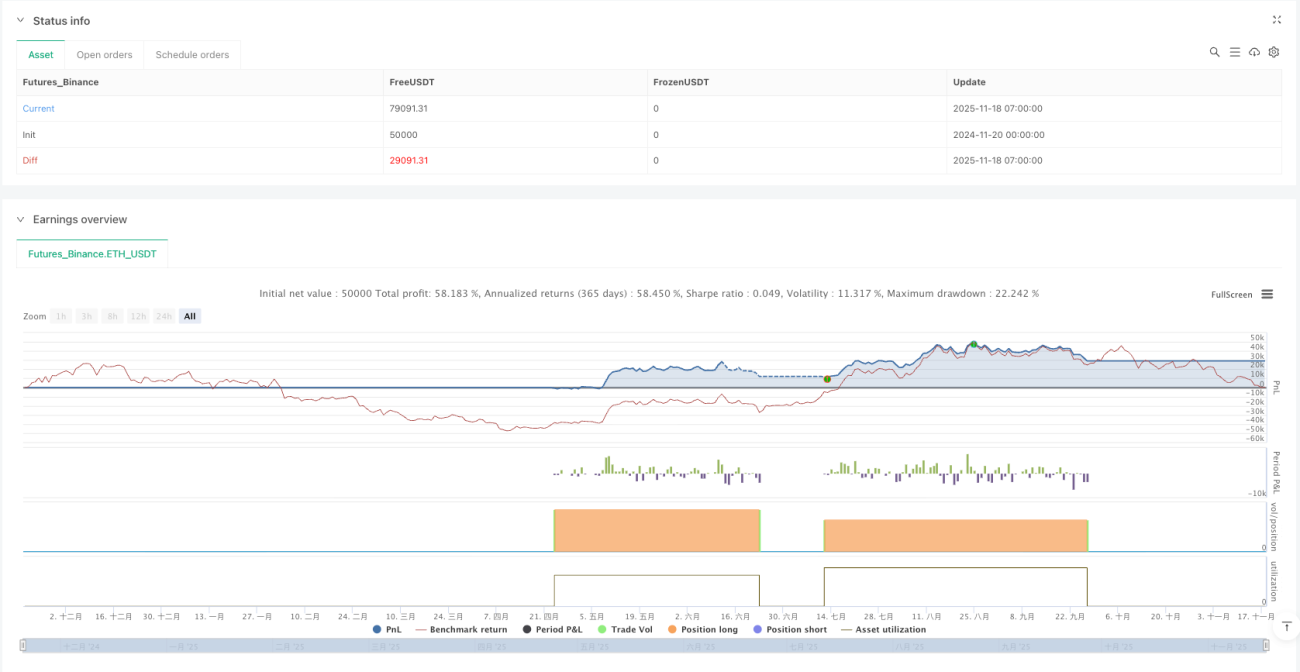
Суть флэтового режима – терпеливое ожидание. Делаются не все отскоки, а только после достаточного развития флэта. Тесты показывают, что в боковом рынке такая стратегия может давать 15–25% годовых.
Риск-менеджмент: многоуровневая система стоп-лоссов
Риск-контроль стратегии делится на три уровня:
- Жёсткий стоп: нижняя полоса EMA как последний рубеж
- Динамический стоп: корректируется в зависимости от цены открытия и рыночной ситуации
- Стоп при смене режима: принудительное закрытие всех позиций при изменении рыночных условий
Особое внимание: при смене режима стратегия принудительно закрывает все позиции. Это делается, чтобы избежать убытков от позиций, открытых по трендовой логике, во флэте, или упущенных возможностей от позиций, открытых по флэтовой логике, в тренде.
На практике максимальная просадка составляет 12–18%, что является довольно хорошим показателем для трендовых стратегий.
Логика выбора параметров
Выбор периода EMA200 основан на обширном тестировании: этот период эффективно разделяет тренд и флэт для большинства инструментов. Смещение 10% – это баланс между чувствительностью и стабильностью; меньшее значение даёт много ложных сигналов, большее – пропускает точки разворота.
Параметры KDJ (9,3,3) относительно консервативны, но в сочетании с уровнями перекупленности/перепроданности 76/24 они обеспечивают достаточное качество сигналов и количество торговых возможностей.
Тейк-профит 30 пунктов для BRK может показаться скромным, но учитывая свойство быстрого получения прибыли после пробоя, такая установка позволяет эффективно фиксировать прибыль, избегая её обратного ухода.
Подходящие рынки и ограничения
Стратегия лучше всего подходит для рынков с чётким чередованием тренда и флэта, например, фьючерсы на фондовые индексы, основные валютные пары. В условиях чистого бычьего или медвежьего тренда результаты средние, так как механизм переключения режимов может срабатывать слишком часто.
Не подходит для сверхкраткосрочных трейдеров, так как стратегии требуется время для определения состояния рынка. Также не подходит для рынков с чрезвычайно низкой волатильностью, так как канал EMA может быть слишком широким.
Тестовые данные основаны на исторических результатах и не гарантируют будущую прибыль. Изменение рыночных условий может повлиять на эффективность стратегии, требуется периодическая оценка и корректировка параметров.
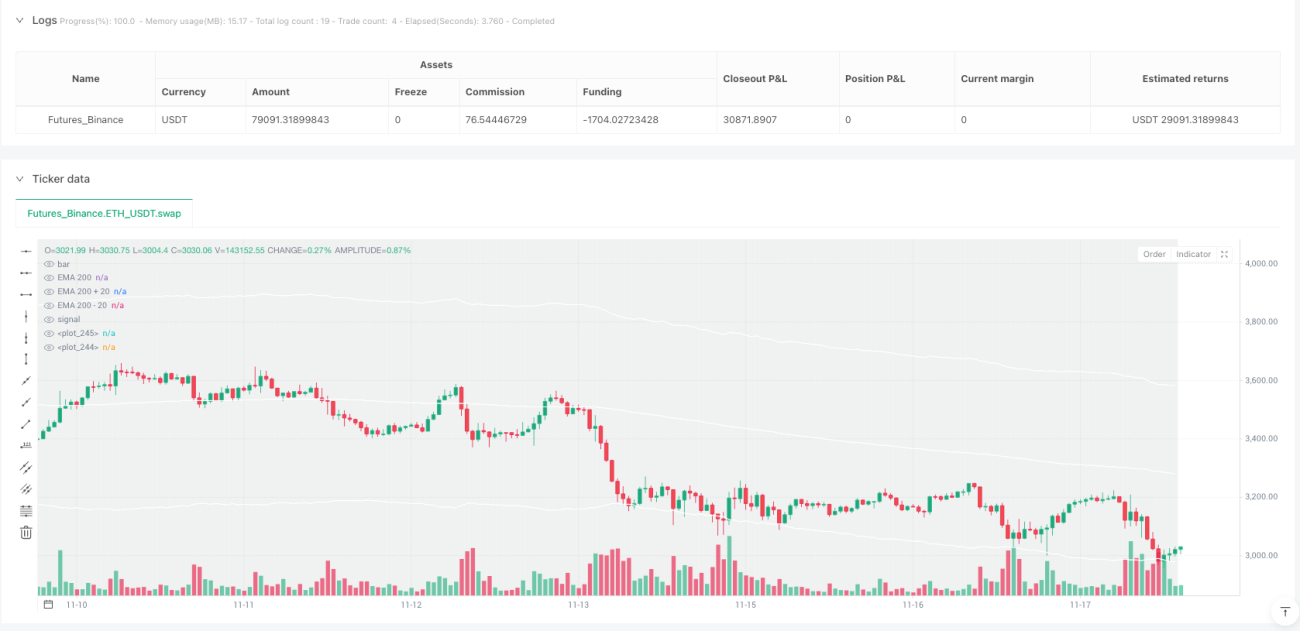
/*backtest
start: 2024-11-20 00:00:00
end: 2025-11-18 08:00:00
period: 1h
basePeriod: 1h
exchanges: [{"eid":"Futures_Binance","currency":"ETH_USDT"}]
*/

//@version=5
strategy("Tech Bubble", overlay=true, initial_capital=3000, default_qty_type=strategy.percent_of_equity,pyramiding = 1,  default_qty_value=100)

//Latch these variable- 1