
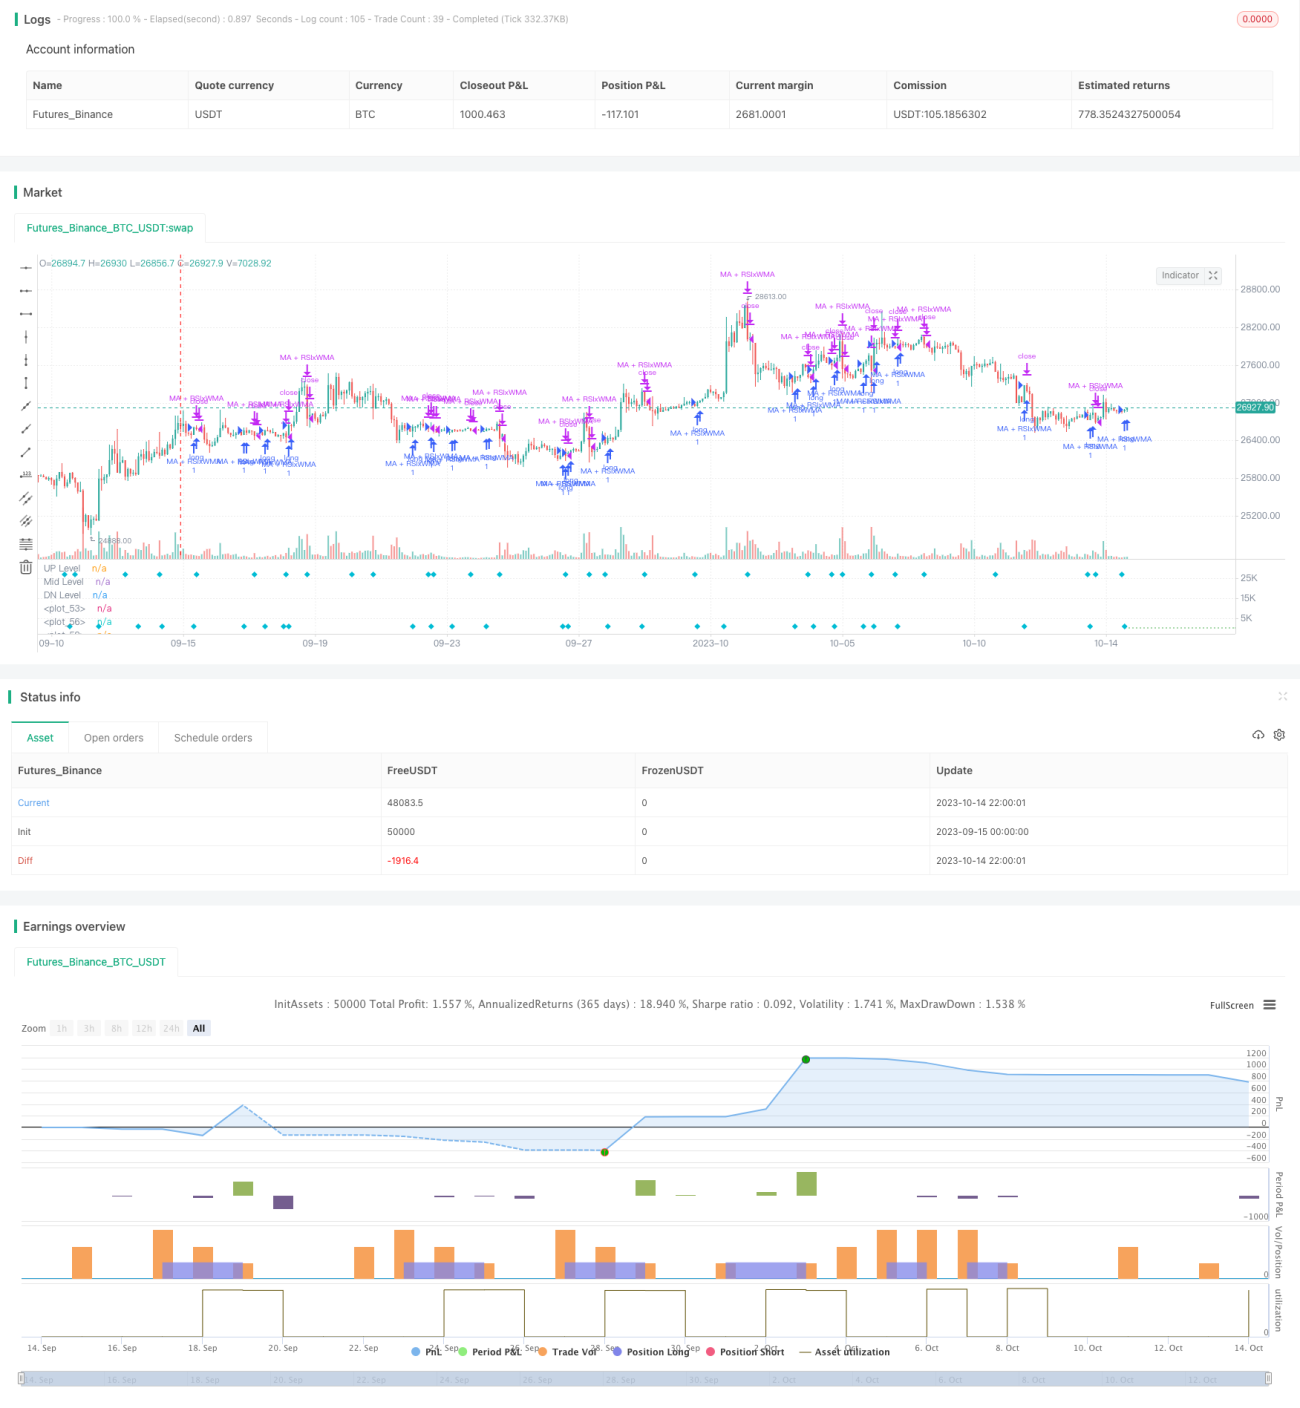
اس حکمت عملی کا بنیادی خیال یہ ہے کہ ایک ہی وقت میں ایک نسبتا strong مضبوط اشاریہ ((RSI) اور مختلف ٹائم فریموں کی متحرک اوسط کو استعمال کیا جائے تاکہ رجحان کے الٹ پوائنٹس کی نشاندہی کی جاسکے۔ اس حکمت عملی میں متعدد تجارتی سگنل شامل ہیں ، جس کا مقصد تجارت کی کامیابی کی شرح کو بہتر بنانا ہے۔
اس حکمت عملی میں متعدد تکنیکی اشارے کے بریک سگنل ، مختلف پیرامیٹرز کے ساتھ چلنے والی اوسط کی شناخت کی گئی ہے تاکہ مختلف ادوار کے رجحانات کی نشاندہی کی جاسکے ، اس طرح حکمت عملی کی وشوسنییتا کو بہتر بنایا جاسکے۔ آر ایس آئی اشارے نے اوورلوڈ اوورلوڈ کی حیثیت کا فیصلہ کیا ، ای ایم اے شارٹ لائن نے قلیل مدتی رجحان کا فیصلہ کیا ، ڈبلیو ایم اے سست لائن نے درمیانی مدت کے رجحان کا فیصلہ کیا ، قیمت اور معاون اوسط کے بریک ٹیسٹ کے رجحانات۔ متعدد سگنل کے مجموعے سے حکمت عملی کی تاثیر میں اضافہ ہوا۔
خطرے کو پیرامیٹرز کی اصلاح، سخت سٹاپ نقصان کی حکمت عملی، اور بڑے سائیکل رجحانات پر غور کرنے کے طریقوں سے کم کیا جا سکتا ہے.
اس حکمت عملی میں رجحانات کی پیروی اور قطب الٹ ٹریڈنگ کے نظریات کو مربوط کیا گیا ہے ، جس میں متعدد ٹائم فریم تجزیہ اور متعدد اشارے کے جامع استعمال کو شامل کیا گیا ہے ، جس کا مقصد تجارت کی کامیابی کو بہتر بنانا ہے۔ خطرہ کو اچھی طرح سے کنٹرول کرنا ، پیرامیٹرز کی ترتیب کو بہتر بنانا ، اور مناسب وقت پر تجارت پر بڑے دورانیہ کے رجحانات کے اثرات کو مدنظر رکھنا ضروری ہے۔ مجموعی طور پر ، اس حکمت عملی میں مضبوط عملی اور مطابقت ہے۔ اس کے بعد حکمت عملی کی معیار کو مزید بہتر بنانے کے لئے مزید اعلی درجے کی ٹکنالوجی کو اپنایا جاسکتا ہے۔
/*backtest
start: 2023-09-15 00:00:00
end: 2023-10-15 00:00:00
period: 2h
basePeriod: 15m
exchanges: [{"eid":"Futures_Binance","currency":"BTC_USDT"}]
*/
// This source code is subject to the terms of the Mozilla Public License 2.0 at https://mozilla.org/MPL/2.0/
// © HamidBox
//@version=4
// strategy("H-M By HamidBox-YT", default_qty_type=strategy.cash, default_qty_value= 100, initial_capital=100, currency='USD', commission_type=strategy.commission.percent, commission_value=0.1)
ma(source, length, type) =>
type == "SMA" ? sma(source , length) :
type == "EMA" ? ema(source , length) :
type == "WMA" ? wma(source , length) :
type == "VWMA" ? vwma(source , length) :
na
WMA(source, length, type) =>
type == "SMA" ? sma(source , length) :
type == "EMA" ? ema(source , length) :
type == "WMA" ? wma(source , length) :
type == "VWMA" ? vwma(source , length) :
na
WithMA(source, length, type) =>
type == "SMA" ? sma(source , length) :
type == "EMA" ? ema(source , length) :
type == "WMA" ? wma(source , length) :
type == "VWMA" ? vwma(source , length) :
na
rsi_inline = input(true , title="RSI Value)", inline="rsi")
rsiLength = input(title="Length:", type=input.integer, defval=9, minval=1, inline="rsi")
rsiLineM = input(title="Level:", type=input.integer, defval=50, minval=1, inline="rsi")
rsi_OSOBinline = input(true , title="RSI)", inline="rsiosob")
rsiLineU = input(title="O-BOUGHT", type=input.integer, defval=70, minval=1, inline="rsiosob")
rsiLineD = input(title="O-SOLD", type=input.integer, defval=30, minval=1, inline="rsiosob")
ma_inline = input(true , title="Price-MA)", inline="ma")
ma_type = input(title="Type", defval="EMA", options=["EMA","SMA","WMA","VWMA"], inline="ma")
emaLength = input(title="Length", type=input.integer, defval=3, inline="ma")
wma_inline = input(true , title="Trending-MA)", inline="wma")
ma_type2 = input(title="", defval="WMA", options=["EMA","SMA","WMA","VWMA"], inline="wma")
wmaLength = input(title="Length", type=input.integer, defval=21, inline="wma")
////////////////////////////////////////////////////////////////////////////////
startTime = input(title="Start Time", type = input.time, defval = timestamp("01 Jan 2021 00:00 +0000"), group="Backtest Time Period")
endTime = input(title="End Time", type = input.time, defval = timestamp("01 Jan 2200 00:00 +0000"), group="Backtest Time Period")
inDateRange = true
////////////////////////////////////////////////////////////////////////////////
rsi = rsi(close , rsiLength)
r = plot(rsi_inline ? rsi : na, color=color.yellow, linewidth=2)
EMA = ma(rsi, emaLength, ma_type)
e = plot(ma_inline ? EMA : na, color=color.lime)
myWMA = ma(rsi, wmaLength, ma_type2)
w = plot(wma_inline ? myWMA : na, color=color.white, linewidth=2)
up = hline(rsiLineU, title='UP Level', linewidth=1, color=color.red, linestyle=hline.style_dotted)
mid = hline(rsiLineM, title='Mid Level', linewidth=2, color=color.white, linestyle=hline.style_dotted)
dn = hline(rsiLineD, title='DN Level', linewidth=1, color=color.green, linestyle=hline.style_dotted)
col_e_w = EMA > myWMA ? color.new(color.green , 85) : color.new(color.red , 85)
col_r_w = rsi > myWMA ? color.new(color.green , 85) : color.new(color.red , 85)
fill(e , w, color=col_e_w)
fill(r , w, color=col_r_w)
////////////////////////////////////////////////////////////////////////////////
//Signals = input(true,group="👇 🚦 --- Backtesting Signals Type --- 🚦 ")
///////////////////////////////////////////////////////////////////////////////
RSI_Cross = input(false, "RSI x Trending-MA", inline="wma_cross",group="👇 🚦 --- Backtesting Signals Type --- 🚦 ") // INPUT
rsiBuySignal = crossover(rsi , myWMA)
plotshape(RSI_Cross ? rsiBuySignal : na, title="RSI Crossover", style=shape.labelup, location=location.bottom, color=color.green)
rsiSellSignal = crossunder(rsi , myWMA)
plotshape(RSI_Cross ? rsiSellSignal : na, title="RSI Crossunder", style=shape.labeldown, location=location.top, color=color.red)
if rsiBuySignal and RSI_Cross and inDateRange
strategy.entry("RSIxWMA", strategy.long)
if rsiSellSignal and RSI_Cross and inDateRange
strategy.close("RSIxWMA", comment="x")
if (not inDateRange)
strategy.close_all()
////////////////////////////////////////////////////////////////////////////////
MA_Cross = input(false, "MA x Trendin-MA",group="👇 🚦 --- Backtesting Signals Type --- 🚦 ") // INPUT
maBuySignal = crossover(EMA, myWMA)
plotshape(MA_Cross ? maBuySignal : na, title="MA Cross", style=shape.circle, location=location.bottom, color=color.lime)
maSellSignal = crossunder(EMA , myWMA)
plotshape(MA_Cross ? maSellSignal : na, title="RSI Crossunder", style=shape.circle, location=location.top, color=color.maroon)
if maBuySignal and MA_Cross and inDateRange
strategy.entry("MAxWMA", strategy.long)
if maSellSignal and MA_Cross and inDateRange
strategy.close("MAxWMA", comment="x")
if (not inDateRange)
strategy.close_all()
////////////////////////////////////////////////////////////////////////////////
Mix = input(false, "RSI + EMA x Trending-MA",group="👇 🚦 --- Backtesting Signals Type --- 🚦 ") // INPUT
rsi_ma_buy = crossover(rsi , myWMA) and crossover(EMA, myWMA)
rsi_ma_sell = crossunder(rsi , myWMA) and crossunder(EMA, myWMA)
plotshape(Mix ? rsi_ma_buy : na, title="RSI Crossunder", style=shape.circle, location=location.bottom, color=color.lime, size=size.tiny)
plotshape(Mix ? rsi_ma_sell : na, title="RSI Crossunder", style=shape.circle, location=location.top, color=color.yellow, size=size.tiny)
if rsi_ma_buy and Mix and inDateRange
strategy.entry("RSI+EMA x WMA", strategy.long)
if rsi_ma_sell and Mix and inDateRange
strategy.close("RSI+EMA x WMA", comment="x")
if (not inDateRange)
strategy.close_all()
////////////////////////////////////////////////////////////////////////////////
wma_cross = input(false, "Trending-MA x 50",group="👇 🚦 --- Backtesting Signals Type --- 🚦 ") // INPUT
wma_buy = crossover(myWMA , rsiLineM)
plotshape(wma_cross ? wma_buy : na, title="WMA Cross", style=shape.diamond, location=location.bottom, color=color.aqua)
wma_sell = crossunder(myWMA , rsiLineM)
plotshape(wma_cross ? wma_sell : na, title="WMA Cross", style=shape.diamond, location=location.top, color=color.aqua)
if wma_buy and wma_cross and inDateRange
strategy.entry("WMA x 50", strategy.long)
if wma_sell and wma_cross and inDateRange
strategy.close("WMA x 50", comment="x")
if (not inDateRange)
strategy.close_all()
////////////////////////////////////////////////////////////////////////////////
rsi_50 = input(false, "RSI x 50",group="👇 🚦 --- Backtesting Signals Type --- 🚦 ") // INPUT
rsi_50_buy = crossover(rsi , rsiLineM)
plotshape(rsi_50 ? rsi_50_buy : na, title="WMA Cross", style=shape.cross, location=location.bottom, color=color.purple)
rsi_50_sell = crossunder(rsi , rsiLineM)
plotshape(rsi_50 ? rsi_50_sell : na, title="WMA Cross", style=shape.cross, location=location.top, color=color.purple)
if rsi_50_buy and rsi_50 and inDateRange
strategy.entry("RSI Cross 50", strategy.long)
if rsi_50_sell and rsi_50 and inDateRange
strategy.close("RSI Cross 50", comment="x")
if (not inDateRange)
strategy.close_all()
////////////////////////////////////////////////////////////////////////////////
RSI_OS_OB = input(false, "RSI OS/OB x Trending-MA",group="👇 🚦 --- Backtesting Signals Type --- 🚦 ") // INPUT
rsi_OB_buy = (rsi < rsiLineD or rsi[1] < rsiLineD[1] or rsi[2] < rsiLineD[2] or rsi[3] < rsiLineD[3] or rsi[4] < rsiLineD[4] or rsi[5] < rsiLineD[5]) and rsiBuySignal
plotshape(RSI_OS_OB ? rsi_OB_buy : na, title="RSI OB + Cross", style=shape.circle, location=location.bottom, color=color.lime, size=size.tiny)
rsi_OS_sell = (rsi > rsiLineU or rsi[1] > rsiLineU[1] or rsi[2] > rsiLineU[2] or rsi[3] > rsiLineU[3] or rsi[4] > rsiLineU[4] or rsi[5] > rsiLineU[5]) and maSellSignal
plotshape(RSI_OS_OB ? rsi_OS_sell : na, title="RSI OS + Cross", style=shape.circle, location=location.top, color=color.red, size=size.tiny)
if rsi_OB_buy and RSI_OS_OB and inDateRange
strategy.entry("RSI-OBOS x WMA", strategy.long)
if rsi_OS_sell and RSI_OS_OB and inDateRange
strategy.close("RSI-OBOS x WMA", comment="x")
if (not inDateRange)
strategy.close_all()
////////////////////////////////////////////////////////////////////////////////
rsi_OB_OS = input(false, "RSI Over Sold/Bought",group="👇 🚦 --- Backtesting Signals Type --- 🚦 ") // INPUT
rsiBuy = crossover(rsi , rsiLineD)
rsiSell = crossunder(rsi, rsiLineU)
rsiExit = crossunder(rsi, rsiLineD)
plotshape(rsi_OB_OS ? rsiBuy : na, title="RSI OB", style=shape.cross, location=location.bottom, color=color.purple)
plotshape(rsi_OB_OS ? crossunder(rsi, rsiLineU) : na, title="RSI OS", style=shape.cross, location=location.top, color=color.purple)
plotshape(rsi_OB_OS ? rsiExit : na, title="RSI OS", style=shape.cross, location=location.bottom, color=color.red)
if rsiBuy and rsi_OB_OS and inDateRange
strategy.entry("RSI OB", strategy.long)
if (rsiSell or rsiExit) and rsi_OB_OS and inDateRange
strategy.close("RSI OB", comment="x")
if (not inDateRange)
strategy.close_all()
////////////////////////////////////////////////////////////////////////////////
////////////////////////////////////////////////////////////////////////////////
With_MA_Vis = input(true , title="With MA Signal)", inline="WITH MA", group="With MA")
withMA_type = input(title="", defval="SMA", options=["EMA","SMA","WMA","VWMA"], inline="WITH MA", group="With MA")
with_MALen = input(title="", defval=9, type=input.integer, inline="WITH MA", group="With MA")
// TAKE-PROFIT / STOP-LOSS
Stop_Take_Vis = input(true, "TP-SL")
LongSLValue = input(title="SL %", type=input.float, defval=3, minval=0.5) * 0.01
LongTPValue = input(title="TP %", type=input.float, defval=15, minval=0.5) * 0.01
LongSLDetermine = strategy.position_avg_price * (1 - LongSLValue)
LongTPDetermine = strategy.position_avg_price * (1 + LongTPValue)
//////////////////////////
with_ma = WithMA(close, with_MALen, withMA_type)
Close_buy_MA = crossover(close , with_ma)
Close_sell_MA = crossunder(close , with_ma)
// PLOT OPTION
WithMaSignal = input(true, "MA + RSI x Trending-MA",group="With MA") // INPUT
// CONDITION IN VARIABLE
withMA_RSI_BUY = (Close_buy_MA and rsiBuySignal) and WithMaSignal and inDateRange
withMA_RSI_SELL = (Close_sell_MA and rsiSellSignal) and WithMaSignal and inDateRange
// PLOT ING
plotshape(WithMaSignal ? withMA_RSI_BUY : na, title="With MA", style=shape.diamond, location=location.bottom, color=color.aqua)
plotshape(WithMaSignal ? withMA_RSI_SELL : na, title="With MA", style=shape.diamond, location=location.top, color=color.aqua)
if withMA_RSI_BUY
strategy.entry("MA + RSIxWMA", strategy.long)
if withMA_RSI_SELL
strategy.close("MA + RSIxWMA", comment="x")
if (not inDateRange)
strategy.close_all()
// FOR SL - TP
if (strategy.position_size > 0) and Stop_Take_Vis
strategy.exit("BUY", stop=LongSLDetermine, limit=LongTPDetermine)