چار عناصر کی حکمت عملی کے بعد رجحان

جائزہ
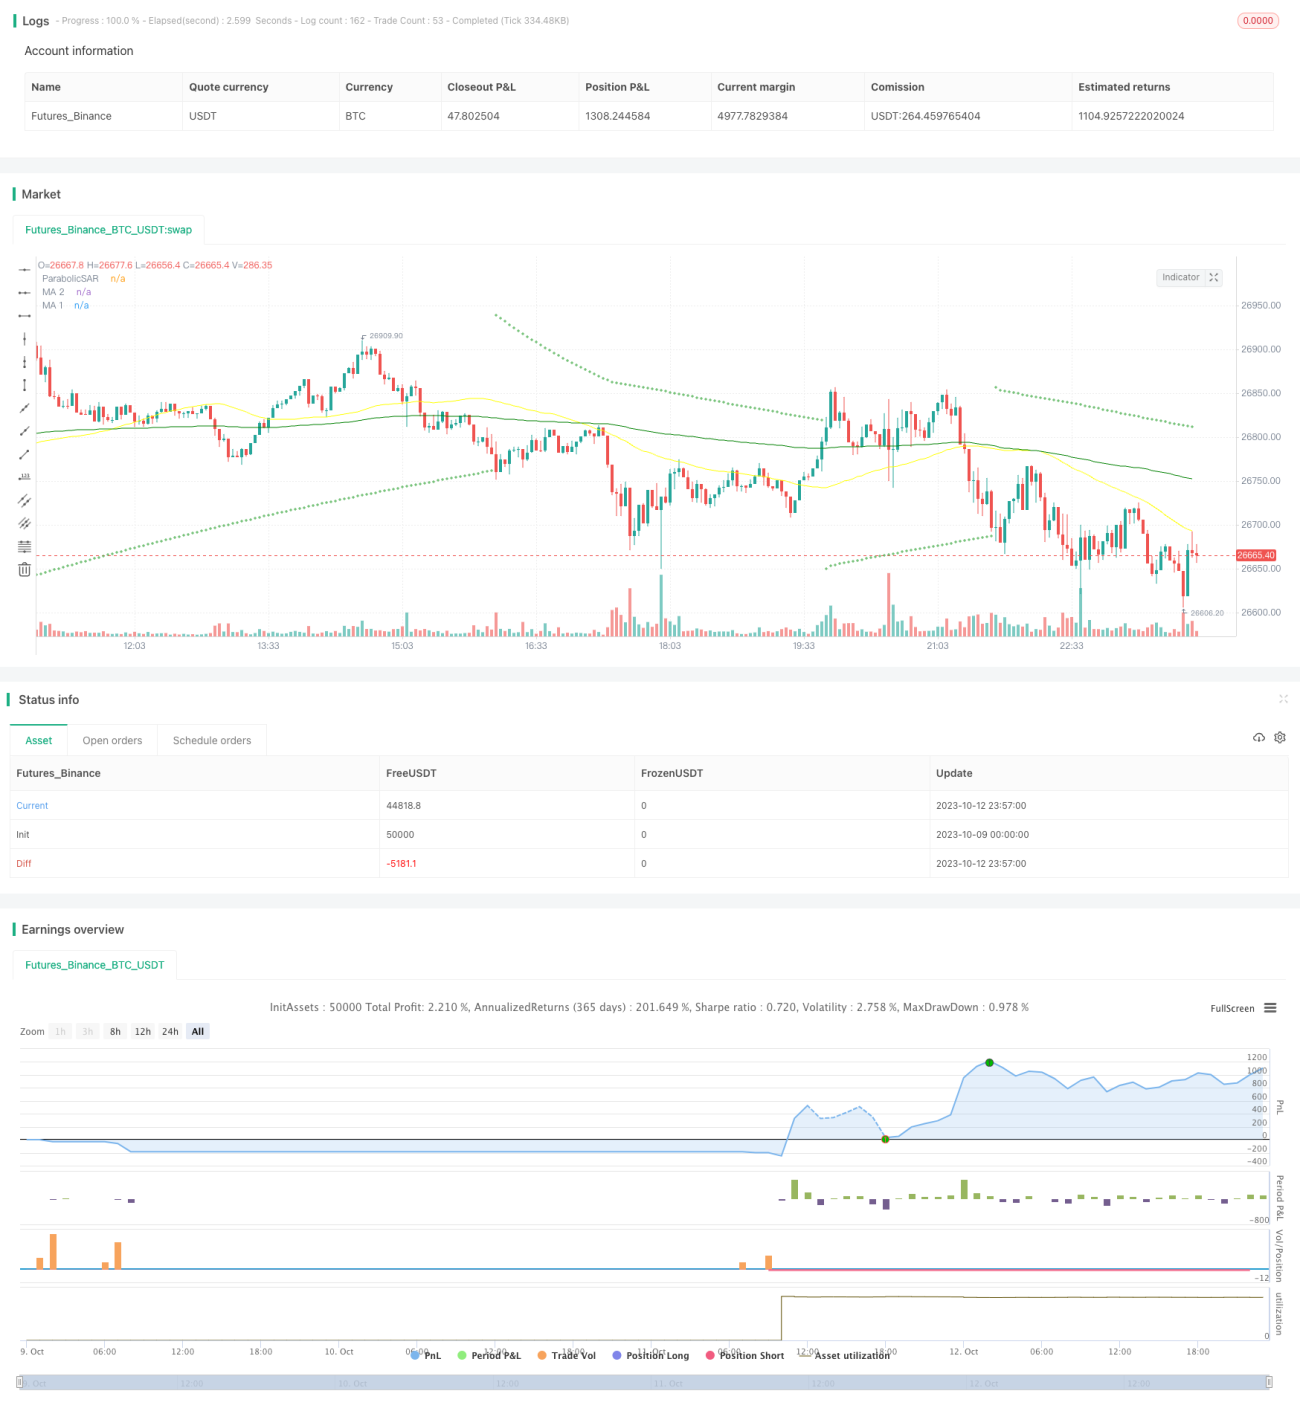
اس حکمت عملی میں سار اشارے ، آر ایس آئی اشارے ، وول اشارے اور ما اوسط لائن کے چار عناصر کا استعمال کیا گیا ہے تاکہ رجحانات کی شناخت کی جاسکے ، اور اس کے لئے ٹھوس رسک مینجمنٹ اقدامات کا استعمال کیا جاسکے۔ حکمت عملی سار اشارے پر مبنی ہے ، اس کے علاوہ آر ایس آئی اووربائ اوور سیل ڈفریجریٹ ریورس سگنل کی شناخت ، وول اشارے کو حجم کی خصوصیات کے طور پر طے کیا گیا ہے ، اور ما اوسط لائن نے اہم رجحانات کی سمت کا فیصلہ کیا ہے۔ متعدد اشارے کے مجموعے کے ذریعہ ، سگنل کو فلٹر کیا جاسکتا ہے ، تاکہ حقیقی رجحانات کی سمت کی نشاندہی کی جاسکے۔
حکمت عملی کا اصول
اس حکمت عملی میں چار اہم تکنیکی اشارے استعمال کیے گئے ہیں:
-
Parabolic SAR: یہ اشارے نقطہ اور رجحان کے مابین تعلقات کا استعمال کرتے ہوئے رجحان کی سمت اور الٹ پوائنٹس کا تعین کرتا ہے۔ جب قیمت اوپر ہو تو نقطہ اچھال ہے ، جب قیمت نیچے ہو تو نقطہ گر ہے۔ جب قیمت کے ذریعے نقطہ ہوتا ہے تو رجحان کی الٹ کی نمائندگی کرتا ہے۔ حکمت عملی سار کو رجحان کی سمت کا تعین کرنے کے لئے بنیادی اشارے کے طور پر استعمال کرتی ہے۔
-
آر ایس آئی: نسبتا strong مضبوط اشارے۔ یہ اشارے 0-100 کے درمیان جھٹکے کے ذریعہ مارکیٹ میں اوور بیئر اور اوور سیل کا فیصلہ کرتا ہے۔ آر ایس آئی 70 سے زیادہ اوور بیئر زون ہے ، 30 سے کم اوور سیل زون ہے ، اور 50 کے قریب واپس آنے والی درمیانی لائن زون ہے۔ آر ایس آئی کے ذریعہ حکمت عملی اوور بیئر اور اوور سیل ریورس سگنل کا فیصلہ کرتی ہے۔
-
VOL: ٹرانسمیشن حجم کی پیمائش۔ حکمت عملی کا استعمال کرتے ہوئے VOL ٹرانسمیشن حجم کو بڑھانے کی خصوصیت کا تعین کرنے کے لئے رجحانات کی تصدیق اور الٹ سگنل کی کیفیت کا فیصلہ کرنے کے لئے۔
-
ایم اے: چلتی اوسط۔ حکمت عملی بنیادی رجحان کی سمت کا تعین کرنے کے لئے لمبی اور مختصر اوسط لائنوں کا استعمال کرتی ہے۔ لمبی اور لمبی اوسط لائنوں کو مختصر اوسط لائنوں پر عبور کرنا زیادہ سگنل ہے ، اور لمبی اور لمبی اوسط لائنوں کو مختصر اوسط لائنوں کے نیچے عبور کرنا ایک نظر انداز سگنل ہے۔
تجارتی سگنل جنریشن کے قوانین:
کثیر سر حالات: SAR پوائنٹ K لائن سے نیچے منتقل ہوا اور RSI نیچے سے اوپر کی طرف سے وسط لائن کے علاقے میں واپس آگیا ، VOL خصوصیت میں نمایاں اضافہ ہوا ، مختصر اوسط لائن نیچے سے لمبی اوسط لائن کو عبور کرتی ہے۔
خالی سر شرط: SAR پوائنٹ K لائن کے اوپر منتقل ہوا اور RSI اوپر سے نیچے سے درمیانی لائن کے علاقے میں چلا گیا ، VOL بڑھا ہوا خصوصیت واضح ہے ، مختصر اوسط لائن اوپر سے نیچے سے لمبی اوسط لائن کو عبور کرتی ہے۔
اس حکمت عملی میں اسٹاپ اسٹاپ نقصان کے خطرے کے انتظام کے قواعد بھی مرتب کیے گئے ہیں۔ اسٹاپ اسٹاپ کا ہدف داخلے کی قیمت سے 2 گنا ہے ، اور اسٹاپ نقصان کی قیمت داخلے کی قیمت سے 0.8 گنا ہے ، جو منافع کو مؤثر طریقے سے لاک کرنے اور خطرے کو کنٹرول کرتی ہے۔
طاقت کا تجزیہ
اس حکمت عملی کے درج ذیل فوائد ہیں:
-
کثیر اشارے کے مجموعے کو ڈیزائن کیا گیا ہے تاکہ جھوٹے اشارے سے بچنے کے لئے اور رجحان کی تبدیلی کو صحیح طور پر پکڑنے کے لئے.
-
خطرے کے انتظام کی ترتیب سٹاپ نقصان روکنے، مؤثر طریقے سے خطرے کو کنٹرول کرنے کے لئے.
-
پوزیشن مینجمنٹ میں ، منافع کو زیادہ سے زیادہ کرنے کے لئے بیچوں میں داخل ہونے اور بیچوں میں روکنے کی اجازت ہے۔
-
پیرامیٹرز کو بار بار بہتر بنانے کے ٹیسٹ کے بعد ، پیرامیٹرز کی استحکام کو یقینی بنایا گیا ہے۔
-
اس کے علاوہ ، یہ بھی کہا گیا ہے کہ اس کے بعد سے ، اس نے ایک بار پھر اس کی تصدیق کی ہے۔
-
آپریٹنگ منطق واضح، سادہ اور آسانی سے سمجھنے کے قابل ہے۔
خطرے کا تجزیہ
اس حکمت عملی میں مندرجہ ذیل خطرات بھی ہیں:
-
مارکیٹ میں غیر معمولی اتار چڑھاؤ کی وجہ سے روک تھام کو توڑ دیا گیا ہے۔ مناسب روک تھام کے فاصلے کو چھوڑنے کی سفارش کی گئی ہے۔
-
ٹرانزیکشن کی اقسام میں لیکویڈیٹی کی کمی کی وجہ سے نقصان کا خاتمہ نہیں ہوسکتا ہے۔ اچھی لیکویڈیٹی والی ٹرانزیکشن اقسام کا انتخاب کیا جانا چاہئے۔
-
سسٹم کے خطرے کے نتیجے میں غیر معمولی اچھال۔ لیور کو کم کیا جانا چاہئے اور اثاثوں کو اچھی قدر کی بنیاد پر رکھنا چاہئے۔
-
پیرامیٹرز کو زیادہ سے زیادہ بہتر بنانے سے منحنی خطوط زیادہ خوبصورت ہوجاتے ہیں۔ استحکام کو بہتر بنانے کے لئے پیرامیٹرز کو مناسب طریقے سے کمزور کیا جانا چاہئے۔
-
ٹریڈنگ فریکوئینسی کی زیادہ سے زیادہ قیمتوں کے لئے سلائڈ پوائنٹ کی لاگت.
-
سگنل کا اثر کمزور ہوتا ہے اور اسے وقت پر اپ ڈیٹ کرنے کی ضرورت ہوتی ہے۔ پیرامیٹرز کی ترتیب کو باقاعدگی سے جانچ پڑتال اور بہتر بنانا چاہئے۔
اصلاح کی سمت
اس حکمت عملی کو مزید بہتر بنانے کے لئے:
-
زیادہ سے زیادہ میٹرکس کے مجموعے کی جانچ کریں ، جیسے MACD ، KD ، وغیرہ بہتر میچوں کی تلاش میں۔
-
بہتر MA سائیکل پیرامیٹرز کی ترتیبات کو زیادہ واضح طور پر اہم رجحانات کی شناخت کے لئے.
-
سٹاپ اسٹاپ نقصان فیکٹر کو بہتر بنائیں تاکہ بہترین رسک ریٹرن حاصل کیا جاسکے۔
-
مختلف اقسام کے پیرامیٹرز کی مضبوطی کی جانچ اور بہترین پیرامیٹرز کا مجموعہ تلاش کریں۔
-
مشین لرننگ ماڈل شامل کریں جو ٹریڈنگ سگنل کا تعین کرنے میں معاون ہیں۔
-
خود کار طریقے سے روکنے والے الگورتھم کو شامل کریں تاکہ روکنے والے نقصانات کو حقیقی اتار چڑھاؤ کے قریب لایا جاسکے۔
-
ٹیسٹ طویل عرصے سے پیرامیٹرز کی ترتیب، توسیع کی روک تھام کی حد <unk>
خلاصہ کریں۔
اس حکمت عملی میں متعدد اشارے استعمال کیے جاتے ہیں تاکہ جعلی سگنلوں کو فلٹر کیا جاسکے ، رجحان کی سمت کا تعین کیا جاسکے ، اسٹاپ نقصان کو روکنے کے اقدامات کا تعین کیا جاسکے ، اور پیرامیٹرز کو بہتر بنانے اور پورٹ فولیو کو ایڈجسٹ کرنے کے ذریعہ حکمت عملی کی مستقل کارکردگی کو بہتر بنایا جاسکے۔ اگرچہ کوئی بھی حکمت عملی مستقبل کی کامل پیش گوئی نہیں کرسکتی ہے ، لیکن سسٹم کے تجارتی منصوبے کے ساتھ ساتھ اچھے خطرے کے انتظام سے منافع کی امکانات میں نمایاں اضافہ ہوگا۔ یہ حکمت عملی ایک نسبتا. مستحکم رجحانات کا سراغ لگانے والا پروگرام پیش کرتی ہے ، جو طویل مدتی مستحکم منافع کے حصول کے لئے معقول سرمایہ کاروں کے لئے موزوں ہے۔
- 1