
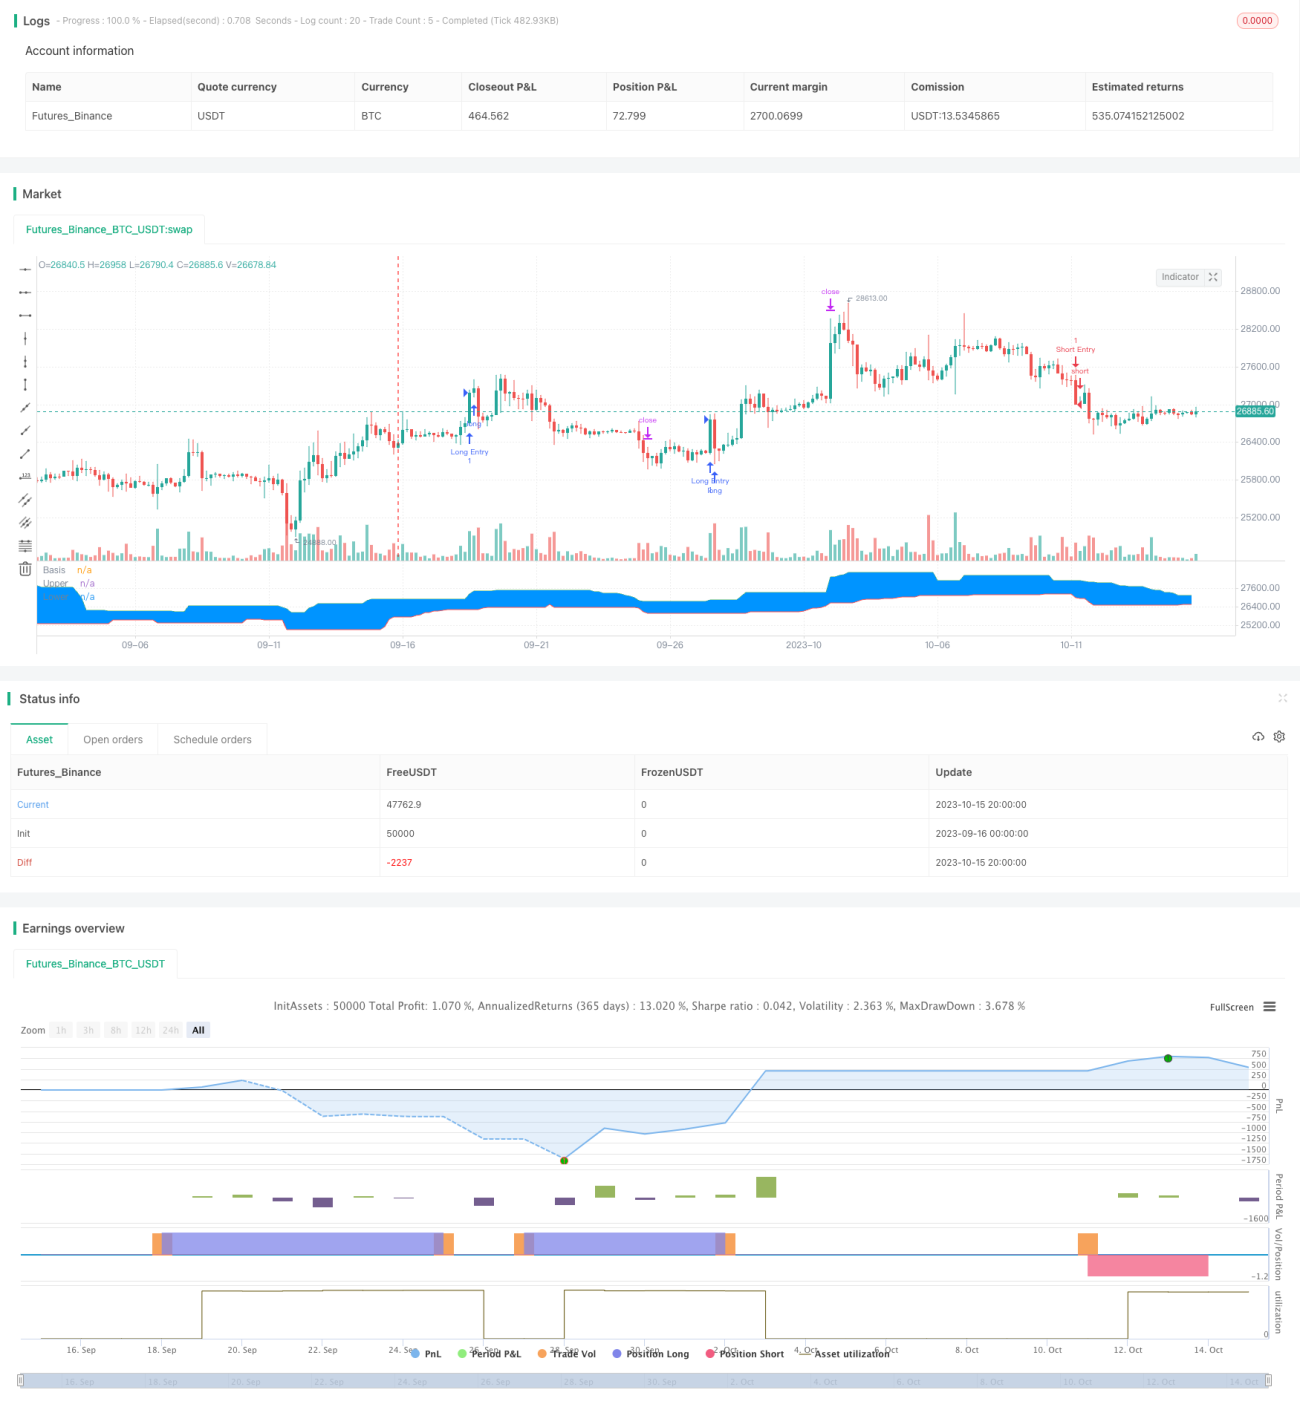
اس حکمت عملی میں بنیادی طور پر ڈونگ چیانگ چینل کیلنڈر اشارے کے ذریعہ ٹریکنگ ٹریک ٹریڈنگ حکمت عملی کو لاگو کیا گیا ہے۔ یہ حکمت عملی رجحانات اور توڑنے والے دونوں ٹریڈنگ خیالات کو جوڑتی ہے ، جس کی بنیاد پر لمبی لکیری رجحانات کا فیصلہ کیا جاتا ہے ، مختصر دورانیے کے نقطہ نظر کی تلاش میں اندراجات کی جاتی ہیں ، اور رجحانات کے حالات میں ہموار تجارت کی جاتی ہے۔ اس کے علاوہ ، اس حکمت عملی میں ہر تجارت کے خطرے سے متعلق منافع کے تناسب کو کنٹرول کرنے کے لئے روک تھام اور روک تھام کی سطح بھی طے کی گئی ہے۔ مجموعی طور پر ، اس حکمت عملی میں رجحانات کی پیروی کرنے کا فائدہ ہے ، اور طویل لکیری رجحانات کے مواقع پر قبضہ کرنے کے لئے ہموار ہے۔
ڈونگ چیانگ چینل کے اشارے کے پیرامیٹرز کو ترتیب دیں ، ڈیفالٹ دورانیہ 20؛
EMA ہموار حرکت پذیری اوسط مقرر کریں، ڈیفالٹ دورانیہ 200؛
اس کے علاوہ، یہ بھی ایک بہت ہی آسان طریقہ ہے.
ایک ٹوٹنے اور واپس قدم پیرامیٹرز، بالترتیب کثیر سر اور خالی سر کے لئے مقرر؛
کیا یہ ایک اعلی یا کم سطح پر ریکارڈ کیا گیا ہے؟
ملٹی ہیڈ سگنل: اگر پچھلی بریکنگ کم ہے اور قیمت ڈونگ چیان اوپری ریل سے اوپر ہے اور ای ایم اے کی اوسط لائن سے اوپر ہے تو ، ملٹی ہیڈ سگنل تیار کریں۔
اوور ہیڈ سگنل: اگر پچھلا بریک اونچائی پر ہے اور قیمت ڈونگ چیان نیچے کی ریل سے نیچے ہے اور EMA کی اوسط سے نیچے ہے تو ، اوور ہیڈ سگنل پیدا کریں۔
کثیر پوزیشن میں داخل ہونے کے بعد ، اسٹاپ نقصان کو ڈونگ چیان کے نیچے ریل میں 5 پوائنٹس کی واپسی کے طور پر ترتیب دیا گیا ہے ، اور اسٹاپ کو اسٹاپ نقصان کے فاصلے سے زیادہ خطرہ منافع کا تناسب سمجھا جاتا ہے۔
خالی سر پوزیشن میں داخل ہونے کے بعد ، اسٹاپ نقصان کو ڈونگ چیان کے ریل پر 5 پوائنٹس واپس لے جانے کے لئے ترتیب دیا گیا ہے ، اور اسٹاپ نقصان کو روکنے کے فاصلے پر خطرہ سے فائدہ کے تناسب سے ضرب کیا گیا ہے۔
اس طرح ، حکمت عملی ، رجحانات کے فیصلے اور توڑنے کے آپریشن کے ساتھ مل کر ، لمبی لائن رجحانات میں مختصر دورانیے کے مواقع کو پکڑنے کے لئے کام کرتی ہے۔ اس کے ساتھ ہی ، اسٹاپ نقصانات کی روک تھام کی ترتیب انفرادی تجارت کے منافع کے خطرے کو کنٹرول کرسکتی ہے۔
طویل مدتی رجحانات کو ٹریک کریں اور اس سے بچنے سے بچنے سے بچیں.
ڈونگ چیانگ چینل ایک لمبی لائن اشارے کے طور پر استعمال کیا جاتا ہے ، جس میں ای ایم اے کی یکساں لائن فلٹرنگ کے ساتھ مل کر ، رجحان کی سمت کا بہتر اندازہ لگایا جاسکتا ہے۔
نقصان کی روک تھام کا طریقہ کار ہر خطرے کو کنٹرول کرتا ہے ، جس سے ممکنہ نقصان کو محدود کیا جاسکتا ہے۔
خطرہ منافع کے تناسب کو بہتر بناتا ہے ، اور اس سے زیادہ منافع کے حصول کے لئے نقصان کا تناسب بڑھایا جاسکتا ہے۔
ریٹرننگ پیرامیٹرز کی لچکدار ترتیب ، جو مختلف مارکیٹوں کے لئے بہترین پیرامیٹرز کے مجموعے کو ایڈجسٹ کرسکتی ہے۔
ڈونگ چیان چینل اور ای ایم اے کی یکساں لائن فلٹرنگ کے اشارے کے طور پر استعمال کیا جاتا ہے ، جس سے غلط سگنل مل سکتے ہیں۔
ٹرانسمیشن کو توڑنے کے لئے آسان ہے، اور رجحان کی واضح پس منظر کی شناخت کی ضرورت ہے.
سٹاپ نقصان سٹاپ بریک فاصلہ مقررہ ہے، مارکیٹ کے اتار چڑھاؤ کی حد کے مطابق ایڈجسٹ نہیں کیا جا سکتا۔
پیرامیٹرز کو بہتر بنانے کے لئے جگہ محدود ہے اور اس بات کی ضمانت نہیں دی جاسکتی ہے کہ یہ اصل میں کام کرے گا.
اس کے علاوہ ، بلیک سوان کے واقعے میں بہت زیادہ نقصانات ہوسکتے ہیں ، کیونکہ تجارتی نظام بہت زیادہ بے ترتیب واقعات کا مقابلہ نہیں کرسکتا ہے۔
مزید اشارے شامل کرنے پر غور کیا جاسکتا ہے ، جیسے کہ کمپن اشارے ، سگنل کے معیار کو بہتر بنانے کے لئے۔
ایک ذہین سٹاپ نقصان کی روک تھام قائم کی جاسکتی ہے ، جو مارکیٹ میں اتار چڑھاؤ کی سطح اور اے ٹی آر اشارے کی حرکیات کے مطابق منافع اور نقصان کی پوزیشن کو ایڈجسٹ کرتی ہے۔
اس کے علاوہ ، یہ بھی ممکن ہے کہ مشین لرننگ اور دیگر طریقوں کو استعمال کرکے پیرامیٹرز کی جانچ اور اصلاح کی جاسکے ، تاکہ یہ حقیقی مارکیٹ سے قریب تر ہو۔
داخلہ کی منطق کو بہتر بنانے کے لئے ، VOLUME یا اتار چڑھاؤ کی شرح کے اشارے کو بطور معاون شرائط طے کریں ، اور اس سے بچنے سے بچیں۔
اس کے علاوہ ، یہ رجحانات کی نگرانی کی حکمت عملی یا مشین لرننگ کے ساتھ مل کر ایک ہائبرڈ حکمت عملی تشکیل دینے پر غور کیا جاسکتا ہے ، جس سے استحکام کو بہتر بنایا جاسکتا ہے۔
اس حکمت عملی کو ایک ٹریکنگ ٹریک کی حکمت عملی کے طور پر استعمال کیا جاتا ہے ، جس کا بنیادی خیال یہ ہے کہ طویل لکیری رجحانات کا اندازہ لگایا جائے ، اور اس سے آگے بڑھنے کا اشارہ کیا جائے ، اور ایک ہی تجارت کے خطرے پر قابو پانے کے لئے اسٹاپ نقصان کا تعین کیا جائے۔ اس حکمت عملی کے کچھ فوائد ہیں ، لیکن اس میں کچھ بہتر بنانے کی گنجائش بھی ہے۔ مجموعی طور پر ، اگر اس میں پیرامیٹرز کی ترتیب ، داخلے کے وقت کے انتخاب اور دیگر تکنیکی اضافے جیسے معاملات کو سنبھال لیا جائے تو یہ ایک عملی رجحانات کی پیروی کرنے والی حکمت عملی ہوسکتی ہے۔ تاہم ، سرمایہ کاروں کو یہ بات ذہن میں رکھنی چاہئے کہ کوئی بھی تجارتی نظام مارکیٹ کے خطرے سے مکمل طور پر گریز نہیں کرسکتا ہے ، اس کے لئے اچھے خطرے کے انتظام کی ضرورت ہے۔
/*backtest
start: 2023-09-16 00:00:00
end: 2023-10-16 00:00:00
period: 4h
basePeriod: 15m
exchanges: [{"eid":"Futures_Binance","currency":"BTC_USDT"}]
*/
//@version=4
// Welcome to my second script on Tradingview with Pinescript
// First of, I'm sorry for the amount of comments on this script, this script was a challenge for me, fun one for sure, but I wanted to thoroughly go through every step before making the script public
// Glad I did so because I fixed some weird things and I ended up forgetting to add the EMA into the equation so our entry signals were a mess
// This one was a lot tougher to complete compared to my MACD crossover trend strategy but I learned a ton from it, which is always good and fun
// Also I'll explain the strategy and how I got there through some creative coding(I'm saying creative because I had to figure this stuff out by myself as I couldn't find any reference codes)
// First things first. This is a Donchian Channel Breakout strategy which follows the following rules
// If the price hits the upperband of the Donchian Channel + price is above EMA and the price previously hit the lowerband of the Donchian Channel it's a buy signal
// If the price hits the lowerband of the Donchian Channel + price is below EMA and the price prevbiously hit the upper band of the Donchian Channel it's a sell signal
// Stop losses are set at the lower or upper band with a 0.5% deviation because we are acting as if those two bands are the resistance in this case
// Last but not least(yes, this gave BY FAR the most trouble to code), the profit target is set with a 1.5 risk to reward ratio
// If you have any suggestions to make my code more efficient, I'll be happy to hear so from you
// So without further ado, let's walk through the code
// The first line is basically standard because it makes backtesting so much more easy, commission value is based on Binance futures fees when you're using BNB to pay those fees in the futures market
// strategy(title="Donchian Channels", shorttitle="DC", overlay=true, default_qty_type = strategy.cash, default_qty_value = 150, initial_capital = 1000, currency = currency.USD, commission_type = "percent", commission_value = 0.036)
// The built-in Donchian Channels + an added EMA input which I grouped with the historical bars from the Donchian Channels
length = input(20, minval=1, group = "Indicators")
lower = lowest(length)
upper = highest(length)
basis = avg(upper, lower)
emaInput = input(title = "EMA Input", type = input.integer, defval = 200, minval = 10, maxval = 400, step = 1, group = "Indicators")
// I've made three new inputs, for risk/reward ratio and for the standard pullback deviation. My advise is to not use the pullback inputs as I'm not 100% sure if they work as intended or not
riskreward = input(title = "Risk/Reward Ratio", type = input.float, defval = 1.50, minval = 0.01, maxval = 100, step = 0.01, group = "Risk/Reward")
pullbackLong = input(title = "Distance from Long pullback %", type = input.float, defval = 0.995, minval = 0.001, maxval = 2, step = 0.001, group = "Risk/Reward")
pullbackShort = input(title = "Distance from Short pullback %", type = input.float, defval = 1.005, minval = 0.001, maxval = 2, step = 0.001, group = "Risk/Reward")
// Input backtest range, you can adjust these in the input options, just standard stuff
fromMonth = input(defval = 1, title = "From Month", type = input.integer, minval = 1, maxval = 12, group = "Backtest Date Range")
fromDay = input(defval = 1, title = "From Day", type = input.integer, minval = 1, maxval = 31, group = "Backtest Date Range")
fromYear = input(defval = 2000, title = "From Year", type = input.integer, minval = 1970, group = "Backtest Date Range")
thruMonth = input(defval = 1, title = "Thru Month", type = input.integer, minval = 1, maxval = 12, group = "Backtest Date Range")
thruDay = input(defval = 1, title = "Thru Day", type = input.integer, minval = 1, maxval = 31, group = "Backtest Date Range")
thruYear = input(defval = 2099, title = "Thru Year", type = input.integer, minval = 1970, group = "Backtest Date Range")
// Date variable also standard stuff
inDataRange = (time >= timestamp(syminfo.timezone, fromYear, fromMonth, fromDay, 0, 0)) and (time < timestamp(syminfo.timezone, thruYear, thruMonth, thruDay, 0, 0))
// I had to makes these variables because the system has to remember whether the previous 'breakout' was a high or a low
// Also, because I based my stoploss on the upper/lower band of the indicator I had to find a way to change this value just once without losing the value, that was added, on the next bar
var previousishigh = false
var previousislow = false
var longprofit = 0.0
var shortprofit = 0.0
var stoplossLong = 0.0
var stoplossShort = 0.0
// These are used as our entry variables
emaCheck = ema(close, emaInput)
longcond = high >= upper and close > emaCheck
shortcond = low <= lower and close < emaCheck
// With these two if statements I'm changing the boolean variable above to true, we need this to decide out entry position
if high >= upper
previousishigh := true
if low <= lower
previousislow := true
// Made a last minute change on this part. To clean up our entry signals we don't want our breakouts, while IN a position, to change. This way we do not instantly open a new position, almost always in the opposite direction, upon exiting one
if strategy.position_size > 0 or strategy.position_size < 0
previousishigh := false
previousislow := false
// Strategy inputs
// Long - previous 'breakout' has to be a low, the current price has to be a new high and above the EMA, we're not allowed to be in a position and ofcourse it has to be within our given data for backtesting purposes
if previousislow == true and longcond and strategy.position_size == 0 and inDataRange
strategy.entry("Long Entry", strategy.long, comment = "Entry Long")
stoplossLong := lower * pullbackLong
longprofit := ((((1 - stoplossLong / close) * riskreward) + 1) * close)
strategy.exit("Long Exit", "Long Entry", limit = longprofit, stop = stoplossLong, comment = "Long Exit")
// Short - Previous 'breakout' has to be a high, current price has to be a new low and lowe than the 200EMA, we're not allowed to trade when we're in a position and it has to be within our given data for backtesting purposes
if previousishigh == true and shortcond and strategy.position_size == 0 and inDataRange
strategy.entry("Short Entry", strategy.short, comment = "Entry Short")
stoplossShort := upper * pullbackShort
shortprofit := (close - ((((1 - close / stoplossShort) * riskreward) * close)))
strategy.exit("Short Exit", "Short Entry", limit = shortprofit, stop = stoplossShort, comment = "Short Exit")
// This plots the Donchian Channels on the chart which is just using the built-in Donchian Channels
plot(basis, "Basis", color=color.blue)
u = plot(upper, "Upper", color=color.green)
l = plot(lower, "Lower", color=color.red)
fill(u, l, color=#0094FF, transp=95, title="Background")
// These plots are to show if the variables are working as intended, it's a mess I know but I didn't have any better ideas, they work well enough for me
// plot(previousislow ? close * 0.95 : na, color=color.red, linewidth=2, style=plot.style_linebr)
// plot(previousishigh ? close * 1.05 : na, color=color.green, style=plot.style_linebr)
// plot(longprofit, color=color.purple)
// plot(shortprofit, color=color.silver)
// plot(stoplossLong)
// plot(stoplossShort)
// plot(strategy.position_size)