
اس حکمت عملی میں متعدد تکنیکی اشارے ، جیسے کہ چلتی اوسط ، اتار چڑھاؤ کے اشارے ، اور ایکویریم لائن کراسنگ کی شکل کے ساتھ مل کر ، اسٹاک کی قیمتوں میں رجحانات اور اتار چڑھاؤ کے نقطہ نظر کی نشاندہی کرنے کے لئے ، خرید و فروخت کے لئے استعمال کیا جاتا ہے۔
اس حکمت عملی کے کچھ اہم حصے یہ ہیں:
منتخب کریں فاصلہ: سیٹ کریں K ٹائم فریم کے لئے منٹ کی تعداد ، جیسے 1 منٹ ، 5 منٹ وغیرہ
حرکت پذیر اوسط کا انتخاب کریں: عام طور پر استعمال ہونے والی EMA ، SMA اور دیگر حرکت پذیر اوسط کے پیرامیٹرز کی تشکیل کریں ، جیسے 10 دن کی لائن ، 20 دن کی لائن ، وغیرہ
شاک اشارے منتخب کریں: شاک اشارے جیسے آر ایس آئی ، ایم اے سی ڈی ، ولیم اشارے کے پیرامیٹرز کو تشکیل دیں۔
خرید و فروخت کے سگنل کا حساب لگائیں: اپنی مرضی کے مطابق افعال کے ذریعہ ، منتقل اوسط اور جھٹکے کے اشارے کی عددی اقدار کا حساب لگائیں۔ جب قلیل مدتی اوسط لائن پر طویل مدتی اوسط لائن کو عبور کرتے ہیں تو خرید سگنل پیدا ہوتا ہے۔ جب قلیل مدتی اوسط لائن کے نیچے طویل مدتی اوسط لائن کو عبور کرتے ہیں تو فروخت سگنل پیدا ہوتا ہے۔
درجہ بندی کا نظام: ہر اشارے کے خرید و فروخت کے سگنل کو عددی طور پر اسکور کیا جاتا ہے ، اور پھر اوسط لیا جاتا ہے ، جس سے مجموعی درجہ بندی کا اشارہ ملتا ہے۔ درجہ بندی کا اشارہ 0 سے زیادہ خریدنے کے سگنل کے لئے ، 0 سے کم فروخت سگنل کے لئے۔
ٹریڈنگ سگنل: خریدنے یا فروخت کرنے کے لئے ایک حتمی ٹریڈنگ سگنل پیدا کرنے کے لئے ، 0 سے زیادہ یا اس سے کم درجہ بندی انڈیکس کے مطابق۔
اس حکمت عملی میں متعدد اشارے استعمال کیے گئے ہیں جو قیمت کے رجحانات اور ٹرن آؤٹ پوائنٹس کو مؤثر طریقے سے پہچان سکتے ہیں ، سگنل کی وشوسنییتا کو بڑھا سکتے ہیں۔ یکساں لائن کراسنگ ایک موثر رجحان سازی تکنیکی سگنل ہے ، جو کہ جھٹکے کے اشارے کے ساتھ مل کر جھوٹے ٹوٹنے سے بچنے میں مدد کرتا ہے۔ درجہ بندی کا نظام بھی تجارتی سگنل کو زیادہ واضح بناتا ہے۔
مندرجہ ذیل طریقوں سے ان خطرات کو کم کیا جا سکتا ہے:
اس حکمت عملی کو مزید بہتر بنانے کے لیے مندرجہ ذیل نکات پر غور کیا جا سکتا ہے۔
مجموعی طور پر ، اس حکمت عملی میں اوسط لائن کی توڑ اور متعدد اشارے شامل ہیں ، جس سے قیمتوں کی نقل و حرکت کو مؤثر طریقے سے پہچانا جاسکتا ہے۔ تاہم ، بہتر بنانے اور خطرے کو کنٹرول کرنے کے لئے مسلسل جانچ کی ضرورت ہے۔ مستقبل میں پورٹ فولیو کے حصص ، پیرامیٹرز کی اصلاح اور نقصان کو روکنے کے لئے بہتری آسکتی ہے۔
اس حکمت عملی میں مساوی لائن کو عبور کرنا بنیادی تجارتی سگنل کے طور پر استعمال کیا جاتا ہے ، جس کی تصدیق متعدد جھٹکے والے اشارے کے ساتھ کی جاتی ہے ، اور اسکورنگ سسٹم کو استعمال کرتے ہوئے واضح خرید و فروخت کے سگنل پیدا کیے جاتے ہیں۔ قیمت کے رجحانات اور ٹرن آؤٹ پوائنٹس کی مؤثر طریقے سے شناخت کرنے کے قابل ، لیکن تجارتی تعدد کو کنٹرول کرنے ، تجارتی لاگت اور خطرے کو کم کرنے کے ساتھ ساتھ پیرامیٹرز کو مستقل طور پر بہتر بنانے کی ضرورت ہے۔ اس میں کچھ عملی قدر اور بہتری کی گنجائش ہے۔
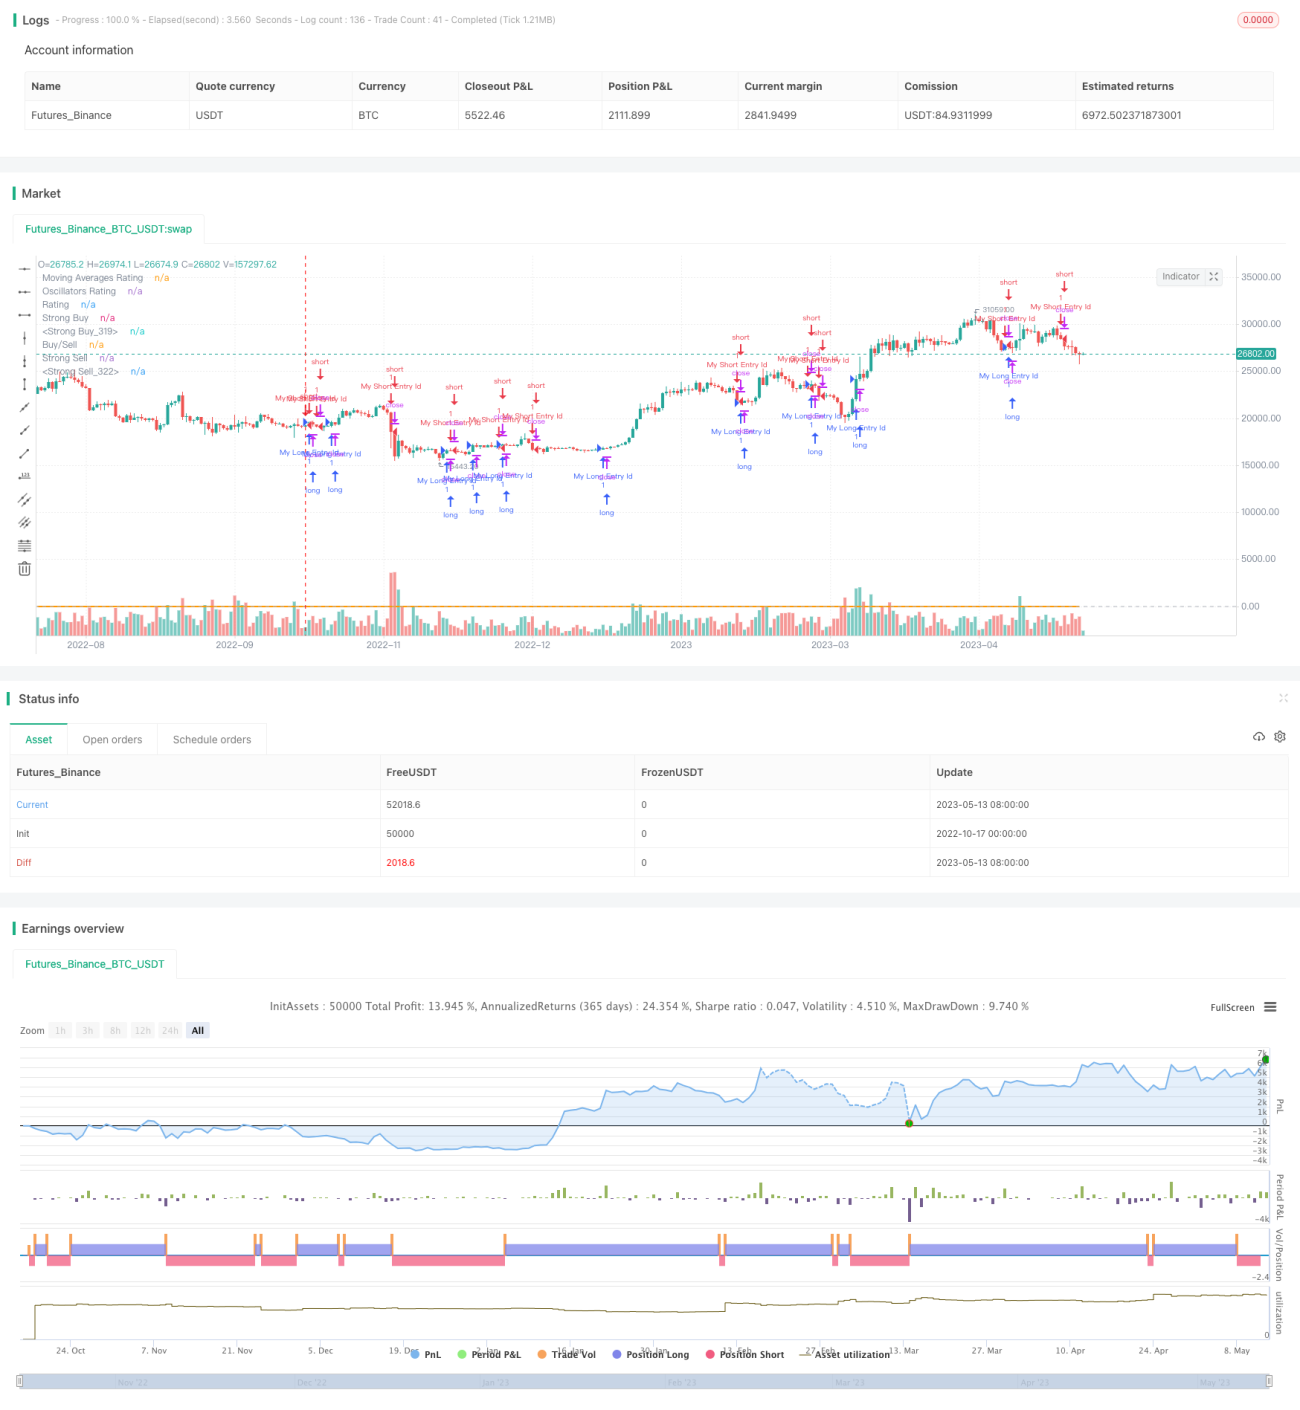
/*backtest
start: 2022-10-17 00:00:00
end: 2023-05-14 00:00:00
period: 1d
basePeriod: 1h
exchanges: [{"eid":"Futures_Binance","currency":"BTC_USDT"}]
*/
//@version=4
strategy("TV Signal", overlay=true, initial_capital = 500, currency = "USD")
// -------------------------------------- GLOBAL SELECTION --------------------------------------------- //
//res = input(defval="5" , title="resolution " , type=resolution)
res_num = input("240", title="Resolution (minutes)", options=["1", "5", "15", "60", "240"] )
res = res_num
src = close
// -----------------------------------MOVING AVERAGES SELECTION----------------------------------------- //
// EMAS input
ema10 = 10
ema20 = 20
ema30 = 30
ema50 = 50
ema100 = 100
ema200 = 200
// SMAS input
sma10 = 10
sma20 = 20
sma30 = 30
sma50 = 50
sma100 = 100
sma200 = 200
// Ichimoku - is not active in the calculation brought to you by TV TEAM for the lolz
// VWMA
vwma20 = 20
// Hull
hma9 = 9
// -----------------------------------OSCILLATORS SELECTION----------------------------------------- //
//RSI
rsi_len = input(14, minval=1, title="RSI Length")
//STOCH K
stoch_k = input(14, minval=1, title="STOCH K")
stoch_d = input(3, minval=1, title="STOCH D")
stoch_smooth = input(3, minval=1, title="STOCH Smooth")
//CCI
cci_len = input(20, minval=1, title="CCI Length")
//Momentum
momentum_len = input(10, minval=1, title="Momentum Length")
//MACD
macd_fast = input(12, title="MACD fast")
macd_slow = input(27, title="MACD slow")
//ADX
adxlen = input(14, title="ADX Smoothing")
dilen = input(14, title="DI Length")
//BBP
bbp_len = input(13, title="BBP EMA Length")
//William Percentage Range
wpr_length = input(14, minval=1, title="William Perc Range Length")
//Ultimate Oscillator
uo_length7 = input(7, minval=1, title="UO Length 7"), uo_length14 = input(14, minval=1, title="UO Length 14"), uo_length28 = input(28, minval=1, title="UO Length 28")
// -------------------------------------- FUNCTIONS - Moving Averages -------------------------------------- //
// Simple Moving Averages Calculation Function - SELL indicator values < price // BUY – indicator values > price
calc_sma_index(len, src, res) =>
sma_val = request.security(syminfo.tickerid, res, sma(src, len))
sma_index = if( sma_val > close )
-1
else
1
sma_index
// Exponential Moving Averages Calculation Function - SELL indicator values < price // BUY – indicator values > price
calc_ema_index(len, src, res) =>
ema_val = request.security(syminfo.tickerid, res, sma(src, len))
ema_index = if( ema_val > close )
-1
else
1
ema_index
// Hull Moving Averages Calculation Function - SELL indicator values < price // BUY – indicator values > price
calc_hull_index(len, src, res) =>
hull_val = request.security(syminfo.tickerid, res, wma(2*wma(src, len/2)-wma(src, len), round(sqrt(len))))
hull_index = if( hull_val > close )
-1
else
1
hull_index
// VW Moving Averages Calculation Function - SELL indicator values < price // BUY – indicator values > price
calc_vwma_index(len, src, res) =>
vwma_val = request.security(syminfo.tickerid, res, vwma(src, len))
vwma_index = if( vwma_val > close )
-1
else
1
vwma_index
// -------------------------------------- FUNCTIONS - Oscillators -------------------------------------- //
// RSI indicator < lines that represent oversold conditions(70) and indicator values are rising = -1
// RSI indicator > lines that represent overbought conditions(30) and indicator values are falling = +1
calc_rsi_index(len, src, res) =>
up = rma(max(change(src), 0), len)
down = rma(-min(change(src), 0), len)
rsi = down == 0 ? 100 : up == 0 ? 0 : 100 - (100 / (1 + up / down))
rsi_res = request.security(syminfo.tickerid, res, rsi)
rsi_change = rsi_res - rsi_res[1]
rsi_index = 0
if( rsi_res > 70 and rsi_change < 0 )
rsi_index := -1
if( rsi_res < 30 and rsi_change > 0 )
rsi_index := 1
rsi_index
// STOCH indicator – main line < lower band (20) and main line crosses the signal line from bottom-up
// STOCH indicato – main line > upper band (80) and main line crosses the signal line from above-down
calc_stoch_index(len_k, len_d, smoothK, res) =>
stoch_k = sma(stoch(close, high, low, len_k), smoothK)
stoch_d = sma(stoch_k, len_d)
res_stoch_k = request.security(syminfo.tickerid, res, stoch_k)
res_stoch_d = request.security(syminfo.tickerid, res, stoch_d)
spread = (res_stoch_k/res_stoch_d -1)*100
stoch_index = 0
if( res_stoch_k > 80 and spread < 0 )
stoch_index := -1
if( res_stoch_k < 20 and spread > 0 )
stoch_index := 1
stoch_index
// CCI indicator – indicator < oversold level (-100) and reversed upwards
// CCI indicator – indicator > overbought level (100) and reversed downwards
calc_cci_index(len, src, res) =>
cci_ma = sma(src, len)
cci = (src - cci_ma) / (0.015 * dev(src, len))
cci_res = request.security(syminfo.tickerid, res, cci)
cci_change = cci_res - cci_res[1]
cci_index = 0
if( cci_res > 100 and cci_change > 0 )
cci_index := -1
if( cci_res < -100 and cci_change < 0 )
cci_index := 1
cci_index
//AWESOME OSCILLATOR – saucer and values are greater than 0 or zero line cross from bottom-up - BUY
//AWESOME OSCILLATOR – saucer and values are lower than 0 or zero line cross from above-down - SELL
calc_awesome_index(src, res) =>
ao = sma(hl2,5) - sma(hl2,34)
ao_res = request.security(syminfo.tickerid, res, ao)
ao_change = ao_res - ao_res[1]
ao_index = 0
if( ao_res > 0 and ao_change > 0 )
ao_index := 1
if( ao_res < 0 and ao_change < 0 )
ao_index := -1
ao_index
// Momentum indicator - indicator values are rising - BUY
// Momentum indicator - indicator values are falling - SELL
calc_momentum_index(len, src, res) =>
mom = src - src[len]
res_mom = request.security(syminfo.tickerid, res, mom)
mom_index = 0
if res_mom>= 0
mom_index := 1
if res_mom <= 0
mom_index := -1
mom_index
// MACD - main line values > signal line values - BUY
// MACD - main line values < signal line values - SELL
calc_macd_index(macd_fast, macd_slow, src, res) =>
macd = ema(src, macd_fast) - ema(src, macd_slow)
res_macd = request.security(syminfo.tickerid, res, macd)
macd_index = 0
if res_macd>= 0
macd_index := 1
if res_macd <= 0
macd_index := -1
macd_index
//STOCHRSI - main line < lower band (20) and main line crosses the signal line from bottom-up
//STOCHRSI - main line > upper band (80) and main line crosses the signal line from above-down
calc_stochrsi_index(len_rsi, len_stoch, smoothK, smoothD, src, res) =>
rsi = rsi(src, len_rsi)
stoch_k = sma(stoch(rsi, rsi, rsi, len_stoch), smoothK)
stoch_d = sma(stoch_k, smoothD)
res_stoch_k = request.security(syminfo.tickerid, res, stoch_k)
res_stoch_d = request.security(syminfo.tickerid, res, stoch_d)
spread = (res_stoch_k/res_stoch_d -1)*100
stochrsi_index = 0
if( res_stoch_k > 80 and spread < 0 )
stochrsi_index := -1
if( res_stoch_k < 20 and spread > 0 )
stochrsi_index := 1
stochrsi_index
//Williams % Range - line is above -20 and values are dropping - Overbough conditions - SELL
//Williams % Range - line is below -80 and values are rising - Oversold conditions - BUY
calc_wpr_index(len, src, res) =>
wpr_upper = highest(len)
wpr_lower = lowest(len)
wpr = 100 * (src - wpr_upper) / (wpr_upper - wpr_lower)
wpr_res = request.security(syminfo.tickerid, res, wpr)
wpr_change = wpr_res - wpr_res[1]
wpr_index = 0
if( wpr_res < -80 and wpr_change > 0 )
wpr_index := 1
if( wpr_res > -20 and wpr_change < 0 )
wpr_index := -1
wpr_index
//Ultimate Oscillator - line is above -20 and values are dropping - Overbough conditions - SELL
//Ultimate Oscillator - line is below -80 and values are rising - Oversold conditions - BUY
average(bp, tr_, length) => sum(bp, length) / sum(tr_, length)
calc_uo_index(len7, len14, len28, res) =>
high_ = max(high, close[1])
low_ = min(low, close[1])
bp = close - low_
tr_ = high_ - low_
avg7 = average(bp, tr_, len7)
avg14 = average(bp, tr_, len14)
avg28 = average(bp, tr_, len28)
uo = 100 * (4*avg7 + 2*avg14 + avg28)/7
uo_res = request.security(syminfo.tickerid, res, uo)
uo_index = 0
if uo_res >= 70
uo_index := 1
if uo_res <= 30
uo_index := -1
uo_index
//Average Directional Index - indicator > 20 and +DI line crossed -DI line from bottom-up
//Average Directional Index - indicator > 20 and +DI line crossed -DI line from above-down
dirmov(len) =>
up = change(high)
down = -change(low)
truerange = rma(tr, len)
plus = fixnan(100 * rma(up > down and up > 0 ? up : 0, len) / truerange)
minus = fixnan(100 * rma(down > up and down > 0 ? down : 0, len) / truerange)
[plus, minus]
adx(dilen, adxlen) =>
[plus, minus] = dirmov(dilen)
sum = plus + minus
adx = 100 * rma(abs(plus - minus) / (sum == 0 ? 1 : sum), adxlen)
adxHigh(dilen, adxlen) =>
[plus, minus] = dirmov(dilen)
plus
adxLow(dilen, adxlen) =>
[plus, minus] = dirmov(dilen)
minus
calc_adx_index(res) =>
sig = adx(dilen, adxlen) //ADX
sigHigh = adxHigh(dilen, adxlen) // DI+
sigLow = adxLow(dilen, adxlen) // DI-
res_sig = request.security(syminfo.tickerid, res, sig)
res_sigHigh = request.security(syminfo.tickerid, res, sigHigh)
res_sigLow = request.security(syminfo.tickerid, res, sigLow)
spread = (res_sigHigh/res_sigLow -1)*100
adx_index = 0
if res_sig >= 20 and spread > 0
adx_index := 1
if res_sig >= 20 and spread < 0
adx_index := -1
adx_index
//Bull Bear Power Index - bear power is below 0 and is weakening -> BUY
//Bull Bear Power Index - bull power is above 0 and is weakening -> SELL
calc_bbp_index(len, src, res ) =>
ema = ema(src, len)
bulls = high - ema
bears = low - ema
bulls_res = request.security(syminfo.tickerid, res, bulls)
bears_res = request.security(syminfo.tickerid, res, bears)
sum = bulls_res + bears_res
bbp_index = 0
if bears_res < 0 and bears_res > bears_res[1]
bbp_index := 1
if bulls_res > 0 and bulls_res < bulls_res[1]
bbp_index := -1
bbp_index
// --------------------------------MOVING AVERAGES CALCULATION------------------------------------- //
sma10_index = calc_sma_index(sma10, src, res)
sma20_index = calc_sma_index(sma20, src, res)
sma30_index = calc_sma_index(sma30, src, res)
sma50_index = calc_sma_index(sma50, src, res)
sma100_index = calc_sma_index(sma100, src, res)
sma200_index = calc_sma_index(sma200, src, res)
ema10_index = calc_ema_index(ema10, src, res)
ema20_index = calc_ema_index(ema20, src, res)
ema30_index = calc_ema_index(ema30, src, res)
ema50_index = calc_ema_index(ema50, src, res)
ema100_index = calc_ema_index(ema100, src, res)
ema200_index = calc_ema_index(ema200, src, res)
hull9_index = calc_ema_index(hma9, src, res)
vwma20_index = calc_ema_index(vwma20, src, res)
ichimoku_index = 0.0 //Ichimoku - is not active in the calculation brought to you by TV TEAM for the lolz
moving_averages_index = ( ema10_index + ema20_index + ema30_index + ema50_index + ema100_index + ema200_index +
sma10_index + sma20_index + sma30_index + sma50_index + sma100_index + sma200_index +
ichimoku_index + vwma20_index + hull9_index ) / 15
// -----------------------------------OSCILLATORS CALCULATION----------------------------------------- //
rsi_index = calc_rsi_index(rsi_len, src, res)
stoch_index = calc_stoch_index(stoch_k, stoch_d, stoch_smooth, res)
cci_index = calc_cci_index(cci_len, src, res)
ao_index = calc_awesome_index(src, res)
mom_index = calc_momentum_index(momentum_len, src, res)
macd_index = calc_macd_index(macd_fast, macd_slow, src, res)
stochrsi_index = calc_stochrsi_index(rsi_len, stoch_k, stoch_d, stoch_smooth, src, res)
wpr_index = calc_wpr_index(wpr_length, src, res)
uo_index = calc_uo_index(uo_length7, uo_length14, uo_length28, res)
adx_index = calc_adx_index(res)
bbp_index = calc_bbp_index(bbp_len , src, res)
oscillators_index = ( rsi_index + stoch_index + adx_index + cci_index + stochrsi_index + ao_index + mom_index + macd_index + wpr_index + uo_index + bbp_index ) / 11
rating_index = ( moving_averages_index + oscillators_index ) / 2
plot(moving_averages_index, color=green, linewidth = 1, title="Moving Averages Rating",transp = 70)
plot(oscillators_index , color=blue, linewidth = 1, title="Oscillators Rating",transp = 70)
plot(rating_index , color=orange, linewidth = 2, title="Rating")
strongbuy = hline(1, "Strong Buy" , color=silver )
buy = hline(0.5, "Strong Buy" , color=green )
normal = hline(0, "Buy/Sell" , color=silver )
sell = hline(-0.5,"Strong Sell", color=red )
strongsell = hline(-1, "Strong Sell", color=silver )
fill(strongbuy,buy, color=green, transp=90)
fill(buy,normal, color=#b2ffb2, transp=90)
fill(sell,normal, color=#F08080, transp=90)
fill(strongsell,sell, color=red, transp=90)
longCondition = rating_index > 0
if (longCondition)
strategy.entry("My Long Entry Id", strategy.long)
shortCondition = rating_index < 0
if (shortCondition)
strategy.entry("My Short Entry Id", strategy.short)