بریک آؤٹ ٹریلنگ اسٹاپ V2 حکمت عملی

جائزہ
اس حکمت عملی میں بریک آؤٹ حکمت عملی اور ٹرینڈ ٹریکنگ اسٹاپ نقصان کی حکمت عملی کے فوائد کو جوڑ دیا گیا ہے ، جس کا مقصد لمبی لائن گراف میں معاون مزاحمت کے بریک آؤٹ سگنل کو پکڑنا ہے ، اور اس کے ساتھ ساتھ چلنے والی اوسط کا استعمال کرتے ہوئے اسٹاپ نقصان کا سراغ لگانا ہے ، جس سے لمبی لائن رجحانات کی سمت میں منافع حاصل کیا جاسکتا ہے ، جبکہ خطرے پر قابو پایا جاسکتا ہے۔
حکمت عملی کا اصول
-
حکمت عملی پہلے مختلف پیرامیٹرز کے ایک گروپ کی حرکت پذیری اوسط کا حساب لگاتی ہے ، جو بالترتیب رجحان کا فیصلہ کرنے ، مزاحمت کی حمایت کرنے ، اور نقصان کی کھوج کے لئے استعمال ہوتی ہے۔
-
اس کے بعد سپورٹ اور مزاحمت کے علاقوں کے طور پر داخل ہونے کے لئے ایک مخصوص مدت کے اندر اندر سب سے زیادہ اور سب سے کم پوائنٹس کو تلاش کریں. جب قیمت ان سپورٹ اور مزاحمت کو توڑ دیتی ہے تو سگنل پیدا ہوتا ہے.
-
اسٹریٹجی کو توڑنے کے لئے اعلی ترین نقطہ پر خریدنے کے لئے زیادہ سگنل خریدنے کے لئے، اور کم سے کم نقطہ پر توڑنے کے لئے کم سگنل کے لئے فروخت کرنے کے لئے.
-
داخل ہونے کے بعد ، اس کی پوزیشن کو توڑنے کے لئے کم سے کم کم سے کم کے طور پر روکنے کی پوزیشن کے طور پر رکھا جائے گا۔
-
جب پوزیشن منافع بخش حالت میں داخل ہوتی ہے تو ، اسٹاپ نقصان کی پوزیشن منتقل ہوجاتی ہے۔ جب قیمت حرکت پذیر اوسط سے نیچے آجاتی ہے تو ، اسٹاپ نقصان کی پوزیشن اس روٹ K لائن کے نچلے حصے پر طے کی جاتی ہے۔
-
اس طرح ، منافع کو لاک کیا جاسکتا ہے ، جبکہ رجحانات کو چلانے کے لئے پوزیشنوں کو کافی جگہ دی جاسکتی ہے۔
-
حکمت عملی کے ساتھ ساتھ اوسط حقیقی اتار چڑھاؤ کو شامل کیا گیا ہے تاکہ یہ یقینی بنایا جاسکے کہ صرف مناسب حدود میں ہی خریدی گئی ہے اور حد سے زیادہ توسیع سے بچنے کے لئے خریدی گئی ہے۔
حکمت عملی کا تجزیہ
-
توڑنے کی حکمت عملی اور رجحان کی پیروی کی روک تھام کی حکمت عملی کے ساتھ مل کر دوہری فوائد.
-
اس کے علاوہ ، یہ بھی کہا گیا ہے کہ اس کی قیمتوں میں اضافے کے ساتھ ، اس کی قیمتوں میں اضافے کے ساتھ ، اس کی قیمتوں میں اضافے کا امکان ہے۔
-
اسٹاپ نقصان کی حکمت عملی نے پوزیشن کی حفاظت کے ساتھ ساتھ پوزیشن کو چلانے کے لئے کافی جگہ دی ہے۔
-
غیر مستحکم شرح فلٹرز کو شامل کریں تاکہ غیر معمولی اضافے سے بچنے کے لئے غیر معمولی خرابی سے بچنے کے لۓ.
-
خود کار طریقے سے ٹرانزیکشن، جزوی وقت انوائس کے لئے موزوں <unk>
-
مختلف دورانیہ اوسط لائن کے لئے اپنی مرضی کے مطابق آپریشن.
-
سٹاپ نقصان کا سراغ لگانے کے طریقوں کو لچکدار طریقے سے ایڈجسٹ کریں۔
حکمت عملی کے خطرے کا تجزیہ
-
توڑنے کی حکمت عملی جعلی توڑنے کے خطرے سے دوچار ہے۔
-
اس کے نتیجے میں ، ایک بار جب آپ نے ایک ٹرانسمیشن کی کوشش کی ہے تو ، آپ کو ایک ٹرانسمیشن کی ضرورت ہوتی ہے ، اور اس کے نتیجے میں آپ کو ایک ٹرانسمیشن کی ضرورت ہوتی ہے۔
-
کچھ کامیابیوں کو پکڑنے کے لئے بہت مختصر ہوسکتا ہے۔ مزید مواقع تلاش کرنے کے لئے ٹائم لائن کو کم کیا جاسکتا ہے۔
-
ٹریکنگ سٹاپ زلزلے کے حالات میں بہت بار بار اسٹاپ ہوسکتا ہے۔ آپ کو مناسب طریقے سے اسٹاپ نقصان کی فاصلے کو چھوڑنا چاہئے۔
-
اتار چڑھاؤ کی شرح فلٹرنگ شاید کچھ مواقع سے محروم ہوجائیں۔ فلٹرنگ پیرامیٹرز کو کم کیا جاسکتا ہے۔
حکمت عملی کی اصلاح کی سمت
-
مختلف اوسط لائن پیرامیٹرز کے مجموعے کی جانچ کریں اور بہترین پیرامیٹرز تلاش کریں۔
-
مختلف بریک کی تصدیق کے طریقہ کار کی جانچ کریں ، جیسے راستے ، K لائن شکل ، وغیرہ۔
-
مختلف سٹاپ ٹریکنگ طریقوں کو آزمائیں اور بہترین سٹاپ کو تلاش کریں.
-
پیسہ مینجمنٹ کی حکمت عملی کو بہتر بنانا ، جیسے پوزیشن اسکور۔
-
اعداد و شمار کے تکنیکی اشارے کو فلٹر کرنے میں شامل کریں ، فلٹرنگ کی درستگی کو بہتر بنائیں۔
-
اس حکمت عملی کو مختلف اقسام میں آزمائیں۔
-
مشین لرننگ الگورتھم کو شامل کرنے سے حکمت عملی کے اثرات میں اضافہ ہوتا ہے۔
خلاصہ کریں۔
اس حکمت عملی میں بریک تھرو اور ٹرینڈ ٹریکنگ اسٹاپ تھرو کو مربوط کیا گیا ہے ، جس کی مدد سے منافع کی گنجائش کو بہتر بنایا جاسکتا ہے ، اگر لمبی لائن کا صحیح فیصلہ کیا جائے۔ کلیدی بات یہ ہے کہ لمبی لائن کے مواقع سے فائدہ اٹھانے کے لئے بہترین پیرامیٹرز کا مجموعہ تلاش کیا جائے ، اور اچھی فنڈ مینجمنٹ حکمت عملی کے ساتھ مل کر ، خطرے کو کنٹرول کیا جاسکے۔ اس حکمت عملی کو مزید بہتر بنانے کے ذریعہ ایک زیادہ قابل اعتماد لمبی لائن ٹرینڈ حکمت عملی بننے کا امکان ہے۔
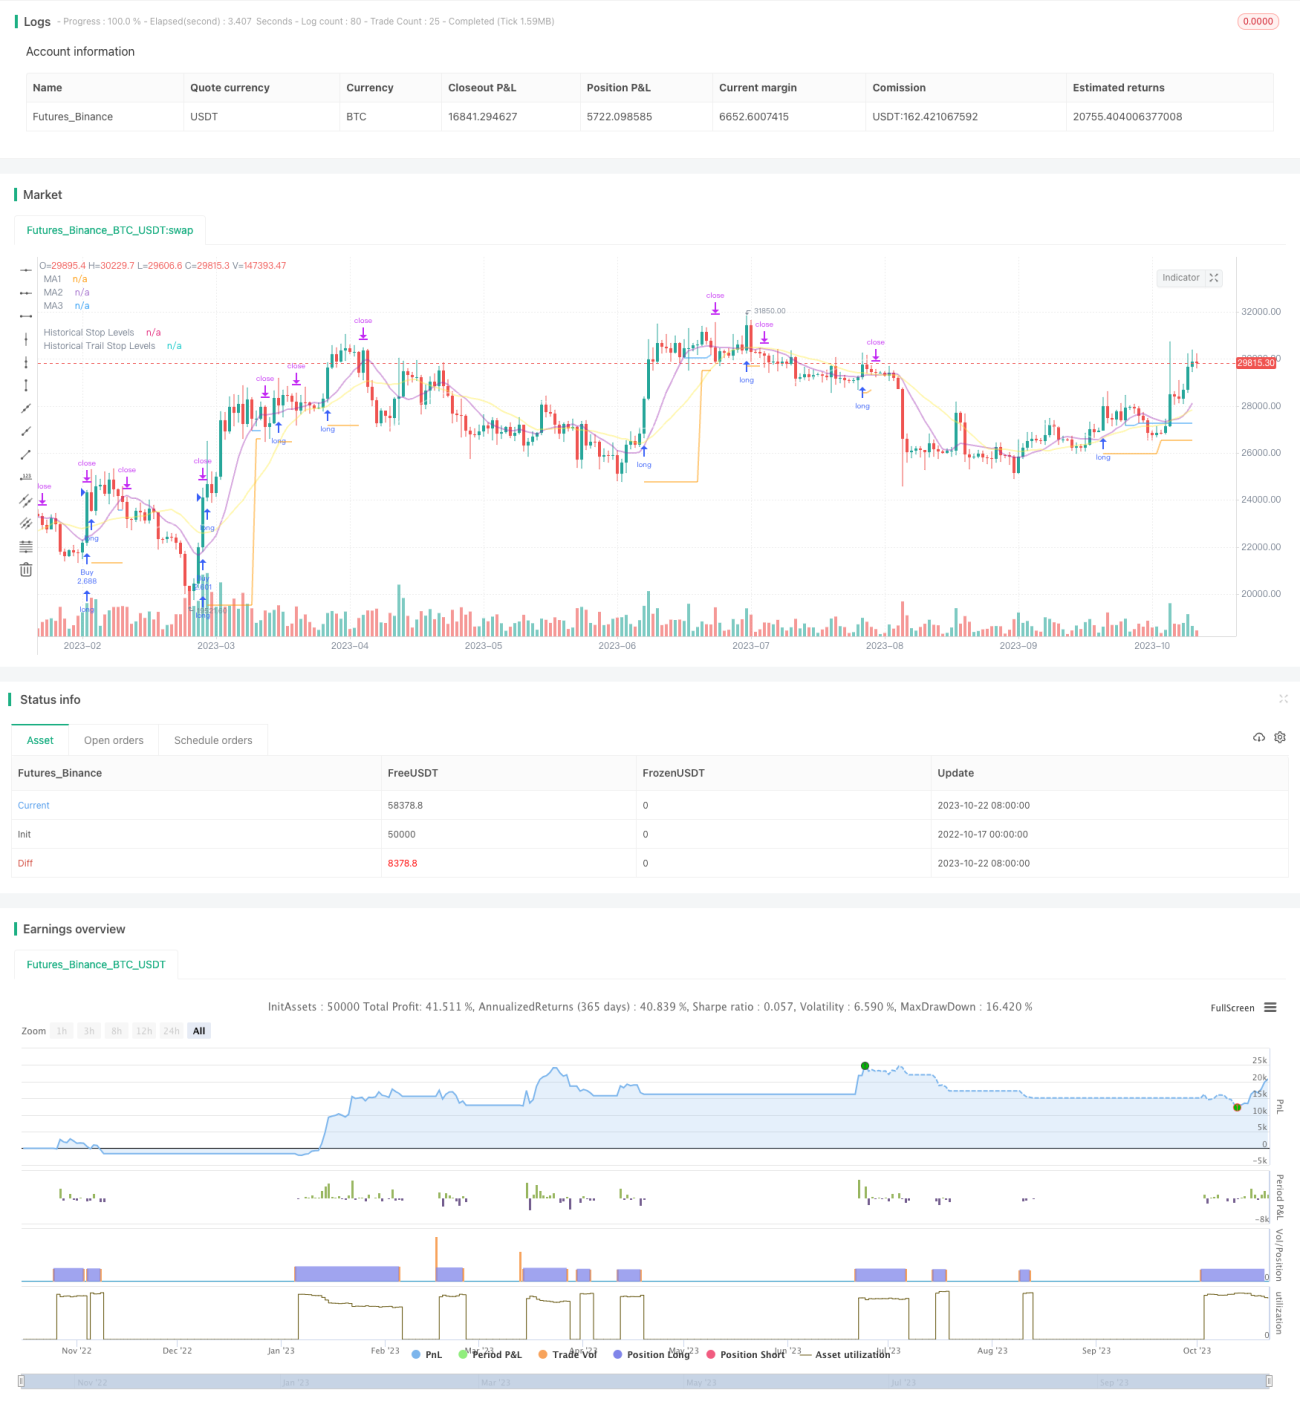
/*backtest
start: 2022-10-17 00:00:00
end: 2023-10-23 00:00:00
period: 1d
basePeriod: 1h
exchanges: [{"eid":"Futures_Binance","currency":"BTC_USDT"}]
*/

// This source code is subject to the terms of the Mozilla Public License 2.0 at https://mozilla.org/MPL/2.0/
// © millerrh

// The intent of this strategy is to buy breakouts with a tight stop on smaller timeframes in the direction of the longer term trend.- 1