کثیر جہتی اشارے کی فیصلہ سازی پر مبنی قلیل مدتی رجحان کی حکمت عملی

جائزہ
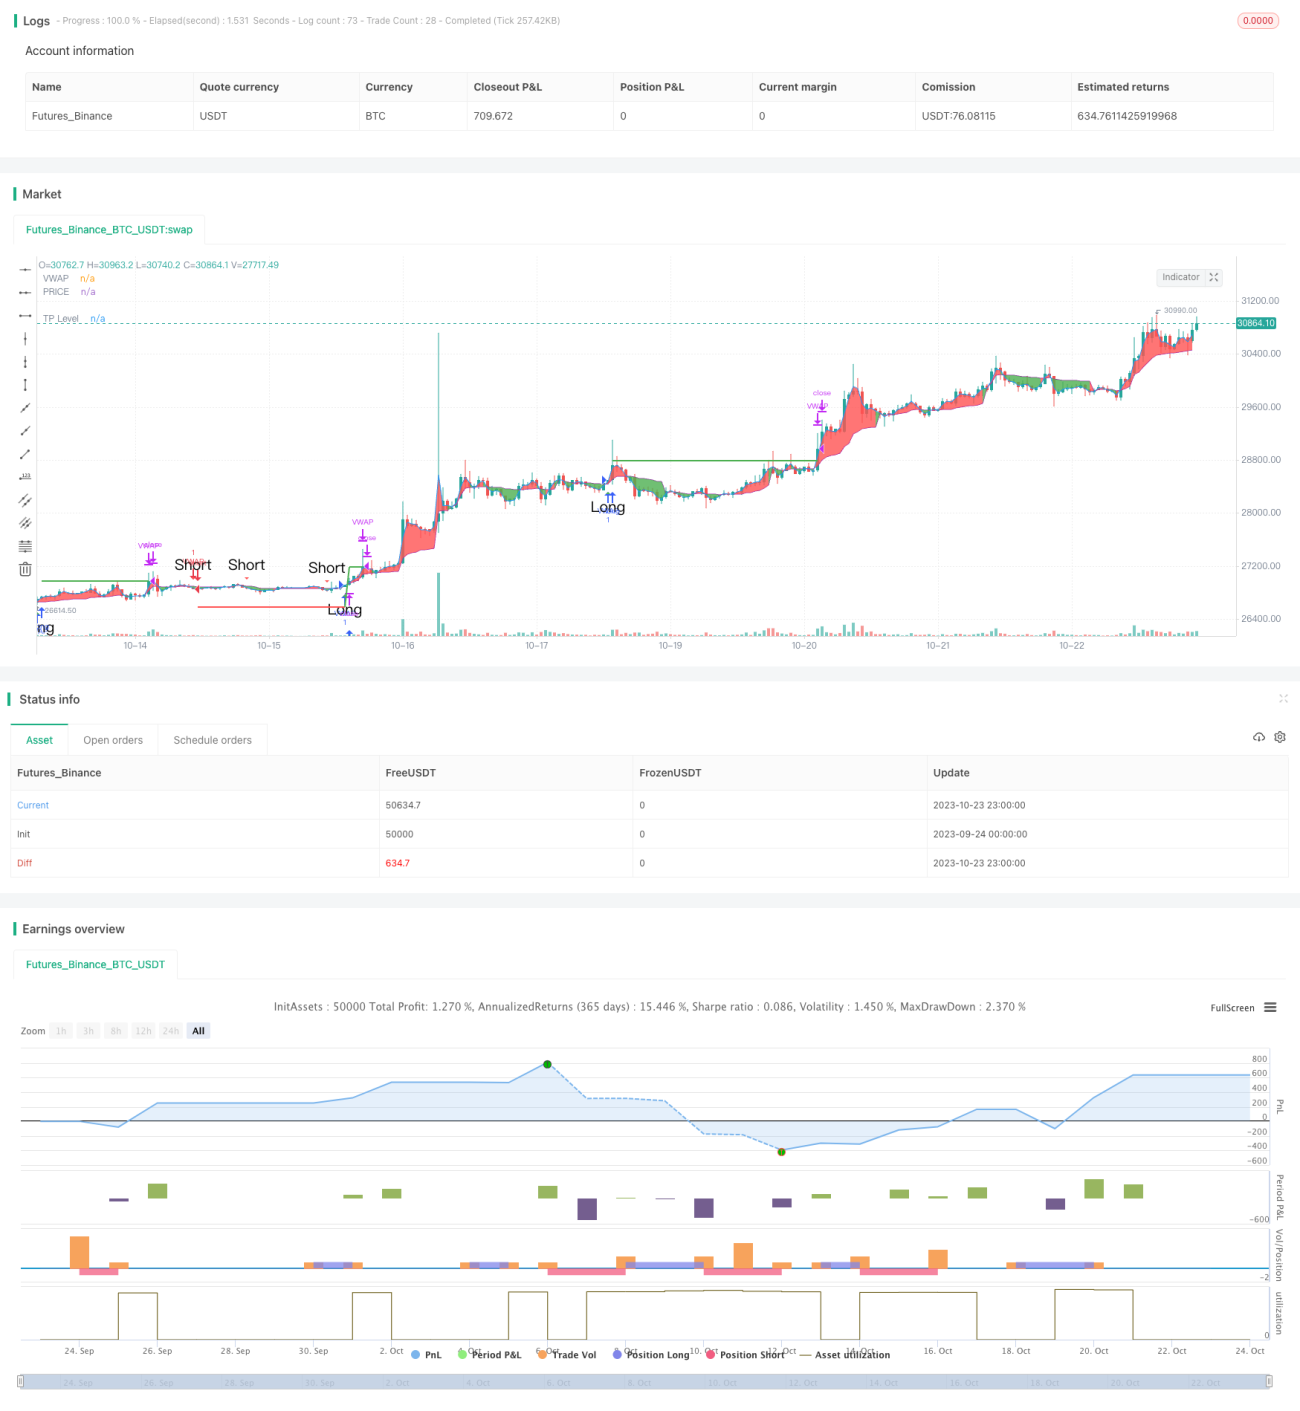
اس حکمت عملی میں تین مختلف جہتوں کے تکنیکی اشارے شامل ہیں ، یعنی معاون مزاحمت کی سطح ، اوسط لائن سسٹم اور اوپربور اوور سیل اشارے ، جو ان کے جامع اشارے کی بنیاد پر قلیل مدتی رجحان کی سمت کا تعین کرتے ہیں تاکہ زیادہ سے زیادہ جیت حاصل کی جاسکے۔
حکمت عملی کا اصول
کوڈ میں سب سے پہلے قیمت کی حمایت اور مزاحمت کی سطح کا حساب لگایا جاتا ہے ، جس میں معیاری اتار چڑھاؤ کا محور اور فیبونیکی سپورٹ اور مزاحمت کی سطح شامل ہے ، اور اسے چارٹ پر پیش کیا جاتا ہے۔ جب قیمت ان اہم سطحوں کو توڑ دیتی ہے تو ، اسے اہم رجحان سگنل سمجھا جاتا ہے۔
اس کے بعد VWAP اور اوسط قیمتوں کے وزن میں چلنے والی اوسط کا حساب لگایا جاتا ہے ، اور ان کے سنہری کراس اور ڈیڈ لاک سگنل کا فیصلہ کیا جاتا ہے۔ یہ درمیانی اور طویل مدتی رجحان کا فیصلہ ہے۔
آخر میں ، اسٹوکاسٹک آر ایس آئی کے اشارے کا حساب لگائیں ، اس کا فیصلہ کریں کہ اس کا سنہری کراس اور ڈیڈ فورک سگنل اوور بیئر اوور سیل اشارے میں سے ہے۔
ان تین جہتوں کے اشارے کو جوڑ کر ، اگر معاون مزاحمت ، وی ڈبلیو اے پی کی اوسط لائن ، اور اسٹوکاسٹک آر ایس آئی نے بیک وقت خریدنے کا اشارہ دیا تو ، ایک سے زیادہ آرڈر کھولا جائے گا۔ اگر تینوں نے بیک وقت فروخت کا اشارہ دیا تو ، ایک خالی آرڈر کھولا جائے گا۔
طاقت کا تجزیہ
اس حکمت عملی کا سب سے بڑا فائدہ یہ ہے کہ اس میں تین مختلف جہتوں کے اشارے شامل ہیں ، جس سے فیصلہ زیادہ جامع اور درست ہے ، جیت کی شرح زیادہ ہے۔ پہلے ، مزاحمت کی سطح بڑے رجحان کا فیصلہ کرتی ہے۔ اس کے بعد وی ڈبلیو اے پی نے درمیانی لمبی لائن کا فیصلہ کیا ہے۔ آخر میں اسٹوکاسٹک آر ایس آئی نے اوورلوڈ اور اوورلوڈ کا فیصلہ کیا۔ تین جہتی اشارے ایک ساتھ سگنل دیتے ہیں ، جعلی سگنل کو زیادہ سے زیادہ فلٹر کرسکتے ہیں ، اور انٹری کی کامیابی کی شرح کو بہتر بناتے ہیں۔
اس کے علاوہ ، حکمت عملی میں ایک روک تھام کا فنکشن شامل کیا گیا ہے ، جس سے منافع کا ایک خاص تناسب لاک کیا جاسکتا ہے ، جو فنڈ مینجمنٹ کے لئے فائدہ مند ہے۔
خطرے کا تجزیہ
اس حکمت عملی کا بنیادی خطرہ یہ ہے کہ ڈوڈو فاریکس پر انحصار کرنے والے اشارے بیک وقت سگنل دیتے ہیں ، اگر کچھ اشارے غلط سگنل دیتے ہیں تو اس سے فیصلہ سازی کی غلطی ہوسکتی ہے۔ مثال کے طور پر ، اسٹوکاسٹک آر ایس آئی نے اووربائڈ سگنل جاری کیا ہے ، لیکن وی ڈبلیو اے پی اور سپورٹ مزاحمت کا فیصلہ ابھی بھی پُرسکون ہے ، اس وقت خریدنے کی جگہ سے محروم ہوسکتا ہے اور اس میں داخل نہیں ہوتا ہے۔
اس کے علاوہ ، اشارے کے پیرامیٹرز کی غلط ترتیب بھی سگنل فیصلے کی غلطی کا سبب بن سکتی ہے ، جس میں بار بار جانچ پڑتال کرکے زیادہ سے زیادہ پیرامیٹرز تلاش کرنے کی ضرورت ہوتی ہے۔
اس کے علاوہ ، اسٹاک مارکیٹ میں مختصر مدت میں اکثر بلیک سوان واقعات رونما ہوتے ہیں ، جس کی وجہ سے اشارے ناکام ہوجاتے ہیں۔ اس خطرے سے بچنے کے لئے ، آپ کو اسٹاپ نقصان کی حکمت عملی میں شامل کیا جاسکتا ہے ، تاکہ ایک ہی نقصان سے زیادہ نقصان سے بچا جاسکے۔
اصلاح کی سمت
اس حکمت عملی کو مزید بہتر بنانے کے لیے درج ذیل نکات پر غور کیا جا سکتا ہے:
-
مزید اشارے شامل کریں ، جیسے ٹرانزیکشن اشارے ، رجحان کی طاقت اور کمزوری کا اندازہ لگائیں ، اور فیصلہ سازی کی درستگی کو بہتر بنائیں۔
-
مشین لرننگ ماڈل شامل کریں ، کثیر جہتی اشارے کی تربیت کریں ، اور خود بخود بہترین تجارتی حکمت عملی تلاش کریں۔
-
مختلف اقسام کے پیرامیٹرز کے مطابق اصلاح کریں ، موافقت کے پیرامیٹرز مرتب کریں۔
-
نقصانات کو روکنے کی حکمت عملی میں اضافہ اور خطرے کو بہتر طور پر کنٹرول کرنے کے لئے واپسی پر قابو پانے والی پوزیشنوں کے سائز کے مطابق.
-
مجموعہ کو بہتر بنانے کے لئے، کم متعلقہ نسلوں کو تلاش کرنے کے لئے مجموعہ کو کم کرنے کے لئے، مجموعہ کو کم کرنے کے لئے.
خلاصہ کریں۔
یہ حکمت عملی مجموعی طور پر قلیل مدتی رجحانات کی تجارت کے لئے بہترین موزوں ہے۔ یہ کثیر جہتی اشارے کا استعمال کرتے ہوئے فیصلے کرتا ہے ، بہت سارے شور کو فلٹر کرتا ہے ، جیت کی شرح زیادہ ہے۔ تاہم ، اشارے کے غلط سگنل کے خطرے پر بھی توجہ دی جانی چاہئے ، اور اس حکمت عملی کو بہتر بنانے کے ساتھ ، یہ ایک موثر اور مستحکم شارٹ لائن حکمت عملی بننے کا امکان ہے۔
- 1