تجارتی ریورسل پوائنٹس کی شناخت کے لیے متعدد اشارے کا استعمال کرتے ہوئے مقداری تجارتی حکمت عملی

جائزہ
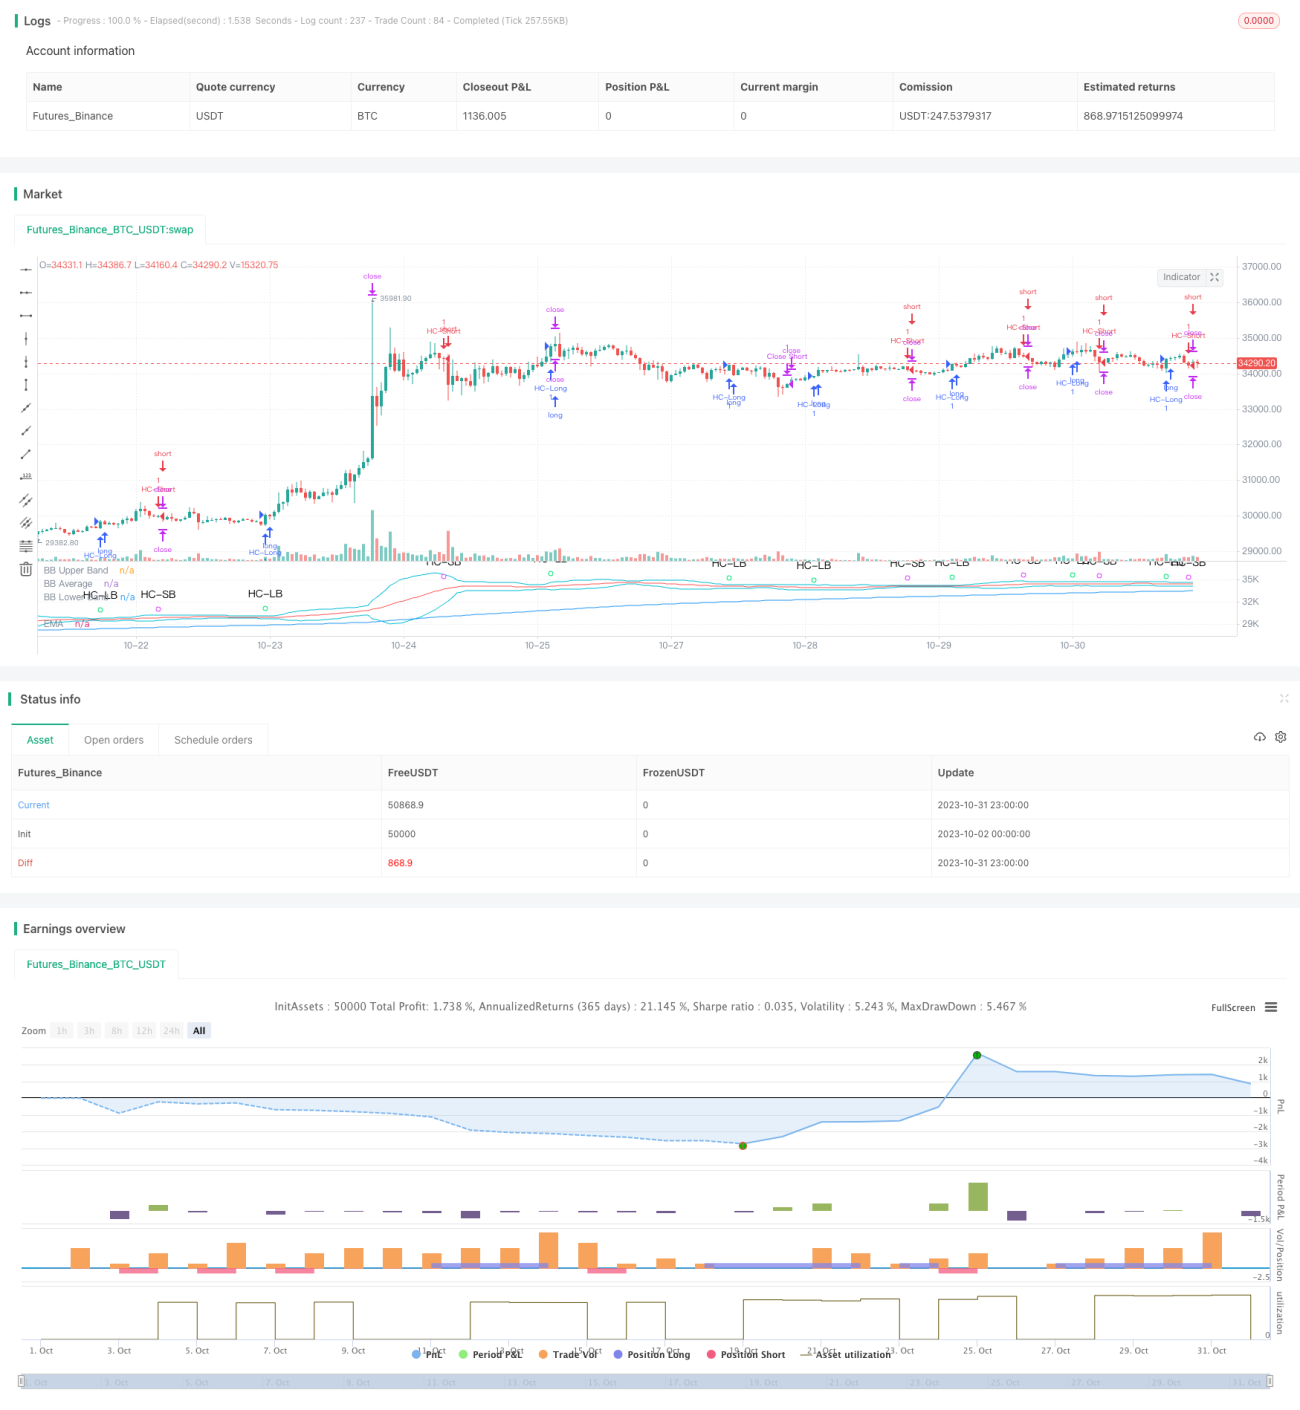
اس حکمت عملی میں ای ایم اے کی اوسط ، وی ڈبلیو اے پی ، ایم اے سی ڈی ، بولنگر بینڈ اور شاف ٹرینڈ سائیکل کے پانچ بڑے اشارے استعمال کیے گئے ہیں۔ اس حکمت عملی میں قیمتوں میں کسی حد کے اندر پلٹنے کے مقامات کی نشاندہی کی گئی ہے ، خرید و فروخت کے اشارے جاری کیے گئے ہیں۔ حکمت عملی کا فائدہ یہ ہے کہ مختلف مارکیٹ اشارے کے استعمال کے مطابق اس کا مجموعہ ایڈجسٹ کیا جاسکتا ہے ، جعلی سگنل کا امکان کم کیا جاسکتا ہے ، منافع کی امکان کو بہتر بنایا جاسکتا ہے۔ لیکن اس میں اشارے کے پیچھے کی شناخت میں تبدیلی اور پیرامیٹرز کی غلط ترتیب کا خطرہ بھی موجود ہے۔ مجموعی طور پر ، حکمت عملی کی سوچ واضح ہے اور اس کی عملی قدر مضبوط ہے۔
حکمت عملی کا اصول
-
EMA اوسط لائن بڑے رجحان کی سمت کا تعین کرتی ہے ، صرف رجحان کی سمت میں خریدتی ہے
-
وی ڈبلیو اے پی کا کہنا ہے کہ ادارے کی جانب سے فنڈز کی منتقلی صرف ادارے کی جانب سے خریدنے کی سمت میں ہوتی ہے۔
-
MACD مختصر لائنوں کے رجحانات اور متحرک تبدیلیوں کا تعین کرتا ہے۔ MACD لائنوں کو توڑنے والے سگنل لائنوں کو خرید / فروخت کے اشارے کے طور پر دیکھا جاتا ہے
-
بولنگر بینڈ فیصلہ کرتے ہیں کہ آیا قیمت زیادہ ہے یا زیادہ فروخت ہوئی ہے ، قیمتوں میں نیچے کی طرف جانے والی ٹریک کو خرید / فروخت کے اشارے کے طور پر دیکھا جاتا ہے
-
شاف ٹرینڈ سائیکل نے قلیل مدتی گھومنے والی سمٹ ڈھانچے کا فیصلہ کیا ، جس میں اعلی یا کم حد سے تجاوز کرنا خرید / فروخت کا اشارہ سمجھا جاتا ہے
-
جب پانچ بڑے اشارے ایک جیسے سگنل دیتے ہیں تو خرید و فروخت کا حکم دیا جاتا ہے
-
اسٹاپ نقصان اور اسٹاپ آؤٹ پٹ کا تعین کریں اور فنڈ مینجمنٹ کو بہتر بنائیں
اسٹریٹجک فوائد
- کثیر اشارے کا مجموعہ غلط سگنل کے امکانات کو کم کرتا ہے
ای ایم اے، وی ڈبلیو اے پی، میکڈ، بی بی اور ایس ٹی سی جیسے متعدد اشارے کا مجموعہ استعمال کرتے ہوئے ، ایک دوسرے کی توثیق کی جاسکتی ہے ، جس سے کسی ایک اشارے سے پیدا ہونے والے جعلی سگنل کو کم کیا جاسکتا ہے ، جس سے سگنل کی وشوسنییتا میں اضافہ ہوتا ہے۔
- اشارے حسب ضرورت
ایک اشارے کا استعمال کرنے یا نہ کرنے کا انتخاب کرنے کی اجازت دیتا ہے۔ حکمت عملی کو زیادہ ہدف اور موافقت بخش بنانے کے لئے مختلف اقسام اور مارکیٹ کے حالات کے مطابق اشارے کا مجموعہ کیا جاسکتا ہے۔
- فنڈ مینجمنٹ کی اصلاح
اسٹاپ نقصان اور روکنے کے مقامات کا تعین ، جو انفرادی نقصان کو محدود کرتا ہے ، اور منافع کے کچھ حصوں کو لاک کرتا ہے ، تاکہ فنڈز کا بہتر انتظام کیا جاسکے۔
- حکمت عملی واضح ہے
سادہ اور بدیہی اشارے کا استعمال کرتے ہوئے ، اور تفصیلی کوڈ کی تشریح کے ساتھ ، پوری حکمت عملی کی سوچ واضح ہے ، سمجھنے اور ترمیم کرنے میں آسان ہے۔
- عملی
متعدد اشارے وسیع پیمانے پر استعمال ہوتے ہیں ، پیرامیٹرز کی ترتیب معقول ہے ، براہ راست ریل اسٹیک ٹریڈنگ میں استعمال کیا جاسکتا ہے ، اور بہت زیادہ اصلاح کی ضرورت کے بغیر اچھے نتائج حاصل کیے جاسکتے ہیں۔
اسٹریٹجک رسک
- پیمائش میں تاخیر سے تبدیلیوں کا خطرہ
ای ایم اے ، ایم اے سی ڈی جیسے اشارے قیمتوں میں تبدیلی کی شناخت میں کچھ تاخیر کا شکار ہیں ، اور ممکنہ طور پر بہترین خریدنے کے وقت سے محروم ہیں۔
- غلط پیرامیٹرز کا خطرہ
اگر اشارے کے پیرامیٹرز کو غلط طریقے سے ترتیب دیا گیا ہے تو ، بہت سارے جھوٹے سگنل پیدا ہوں گے ، جو حکمت عملی کو صحیح طریقے سے کام نہیں کرسکیں گے۔
- غیر یقینی جیت کا خطرہ
کثیر اشارے کا مجموعہ جیت کی شرح کو بہتر بنا سکتا ہے ، لیکن اس بات کی ضمانت نہیں دی جاسکتی ہے کہ ہر تجارت منافع بخش ہو۔ مارکیٹ کے ماحول میں تبدیلی جیت کی شرح کو کم کرسکتی ہے۔
- سٹاپ نقصان کا نقطہ بہت کم خطرہ ہے
اگر اسٹاپ نقصان کا نقطہ بہت چھوٹا ہے تو ، قیمتوں میں معمول کی اتار چڑھاؤ کے دوران اسٹاپ نقصان کا خاتمہ ہوسکتا ہے ، جس سے غیر ضروری نقصانات میں اضافہ ہوتا ہے۔
حکمت عملی کی اصلاح کی سمت
- سگنل کی وشوسنییتا کا تعین کرنے کے لئے مشین لرننگ ماڈل شامل کریں
ماڈل کو تربیت دی جاسکتی ہے کہ وہ کثیر اشارے والے سگنل کی وشوسنییتا کا اندازہ لگائے ، سگنل کو اسکور کرے ، اور جعلی سگنل کو کم کرے۔
- پیمائش کے لئے پیمائش کے اشارے میں اضافہ
قیمتوں میں اضافے کی نشاندہی کرنے کے لئے او بی وی جیسے مقداری اشارے شامل کریں ، جس سے خریداری کی یقین دہانی ہوسکے۔
- اسٹاپ نقصان کی حکمت عملی کو بہتر بنائیں
اس حکمت عملی کے لئے موزوں موزوں اسٹاپ نقصان یا لاک منافع کی حکمت عملیوں کا مطالعہ کیا جاسکتا ہے ، اور فنڈ مینجمنٹ کو بہتر بنایا جاسکتا ہے۔
- پیرامیٹرز کی اصلاح
زیادہ منظم ریٹرننگ کے ذریعے ہر اشارے کے پیرامیٹرز کو بہتر بنانا ، حکمت عملی کی مجموعی استحکام کو بہتر بنانا۔
- روبوٹ ٹریڈنگ میں اضافہ
ٹرانزیکشن API سے منسلک ، خودکار آرڈرنگ کی اجازت دیتا ہے ، اور حکمت عملی کو حقیقی طور پر بغیر کسی کی نگرانی کے کام کرنے کی اجازت دیتا ہے۔
خلاصہ کریں۔
یہ حکمت عملی متعدد تکنیکی اشارے کی طاقت کو مربوط کرتی ہے ، اس کی سوچ واضح ہے ، یہ عملی ہے ، اور اس کو صوابدیدی تجارت کے فیصلے کے حوالہ کے طور پر استعمال کیا جاسکتا ہے ، یا یہ براہ راست الگورتھمک تجارت میں استعمال کیا جاسکتا ہے۔ تاہم ، اس کو مخصوص اقسام اور مارکیٹ کے ماحول کے مطابق بہتر بنانے کی ضرورت ہے ، جو خطرے کو کم کرنے اور استحکام کو بڑھانے کے لئے ہے ، اور آخر کار مستحکم منافع کو برقرار رکھنے کے لئے۔
/*backtest
start: 2023-10-02 00:00:00
end: 2023-11-01 00:00:00
period: 1h
basePeriod: 15m
exchanges: [{"eid":"Futures_Binance","currency":"BTC_USDT"}]
*/

//@version=4

// This source code is subject to the terms of the Mozilla Public License 2.0 at https://mozilla.org/MPL/2.0/
// © MakeMoneyCoESTB2020- 1