
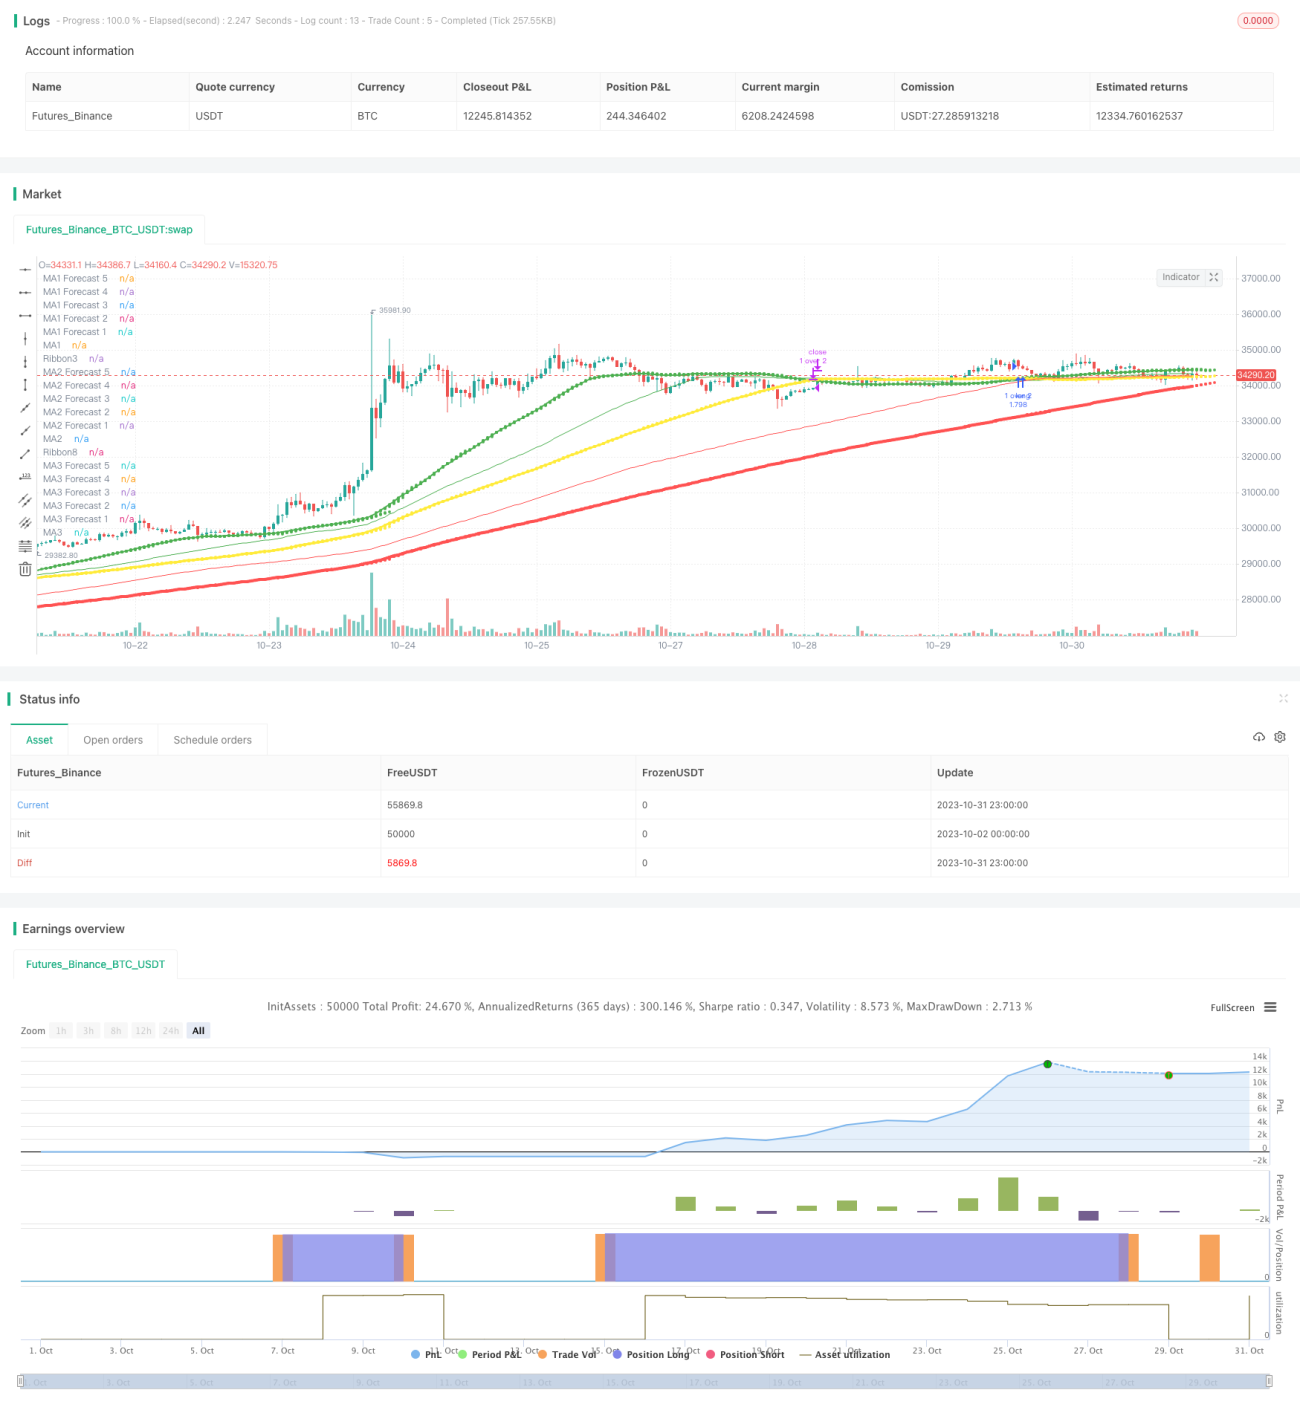
یہ حکمت عملی ایک ٹریڈنگ حکمت عملی ہے جس میں تین حرکت پذیر اوسط پر مبنی رجحانات کی پیروی کی جاتی ہے۔ یہ ایک ہی وقت میں تین مختلف ادوار کی متحرک اوسط پر مبنی ایک سے زیادہ فاریکس فیصلے کرتا ہے ، جو ایک عام رجحانات کی پیروی کرنے والی حکمت عملی ہے۔
اس حکمت عملی میں 3 حرکت پذیر اوسط استعمال کی جاتی ہیں: MA1، MA2 اور MA3۔ 3 حرکت پذیر اوسط ادوار صارف کے ذریعہ ترتیب دیئے جاتے ہیں ، عام طور پر MA1 < MA2 < MA3 ، جیسے MA1 50 ادوار ، MA2 100 ادوار ، MA3 200 ادوار۔
حکمت عملی MA1 کو بنیادی تجارتی فیصلے کے حوالہ کے طور پر لیتی ہے۔ جب مختصر مدت کے MA1 پر طویل مدت کے MA2 یا MA3 کو توڑیں تو زیادہ کام کریں؛ جب MA1 کے نیچے MA2 یا MA3 کو توڑیں تو خالی کریں۔
حکمت عملی صرف MA1 اور MA2 کے کراس کو تجارت کرنے کا انتخاب کرسکتا ہے ، یا صرف MA1 اور MA3 کے کراس کو تجارت کرسکتا ہے ، یا ایک ہی وقت میں دونوں کراسوں کو تجارت کرسکتا ہے۔
جب کراس سگنل ظاہر ہوتا ہے تو ، مارکیٹ کی قیمت کا استعمال کرتے ہوئے ایک ہی پوزیشن کھولیں۔ اسٹاپ اسٹاپ نقصان کو ایک خاص فیصد کے قریب مقرر کیا گیا ہے ، جیسے 30٪ اسٹاپ اسٹاپ اور 15٪ اسٹاپ نقصان۔
حکمت عملی کو بہتر بنانے کے لئے ، ایم اے لائن کے دورانیہ پیرامیٹرز کو ایڈجسٹ کیا جاسکتا ہے ، اسٹاپ اسٹاپ نقصان کی فیصد کو ایڈجسٹ کیا جاسکتا ہے ، اور دیگر اشارے فلٹر سگنل شامل کیے جاسکتے ہیں۔
حرکت پذیر اوسط کے کثیر گروپوں کا استعمال کرتے ہوئے فیصلے کرنے کے لئے ، جعلی توڑ کو مؤثر طریقے سے فلٹر کیا جاسکتا ہے۔
مختلف دورانیہ کے ایم اے کے جوڑے کا استعمال کرتے ہوئے ، رجحانات میں متحرک پوزیشنوں کو ایڈجسٹ کیا جاسکتا ہے ، جس سے رجحانات کی پیروی کی جاسکتی ہے۔
صرف گولڈن کراس یا صرف ڈیتھ کراس یا دونوں کے ساتھ تجارت کرنے کا لچکدار انتخاب۔
اسٹاپ نقصان کا طریقہ کار انفرادی نقصان کو مؤثر طریقے سے کنٹرول کرسکتا ہے۔
رجحانات کی حکمت عملی پر عمل کریں ، اور ہنگامہ خیز حالات میں نقصان کا شکار ہوں۔
اگر ایم اے سائیکل کی ترتیب غلط ہے تو ، اس سے زیادہ بار بار تجارت ہوسکتی ہے ، جس سے جیت کی شرح کم ہوسکتی ہے۔
ایک بار ناکامی کے بعد ، اگر وقت پر بند نہ کیا گیا تو ، اس سے زیادہ نقصان ہوسکتا ہے۔
اگر اسٹاپ اسٹاپ نقصان کی ترتیب بہت نرمی سے ہوتی ہے تو ، انفرادی نقصانات بہت زیادہ ہوسکتے ہیں۔
MA کے پیرامیٹرز کو بہتر بنائیں اور بہترین پیرامیٹرز کا مجموعہ تلاش کریں۔
دوسرے اشارے شامل کرنے کے لئے فلٹر کریں ، داخلے کے وقت کو بہتر بنائیں۔ جیسے MACD ، KDJ وغیرہ۔
اسٹاپ نقصان کو بہتر بنائیں تاکہ حکمت عملی کے منافع کے خطرے کو بہتر بنایا جاسکے۔
پوزیشن مینجمنٹ میں اضافہ ، جیسے پوزیشنوں کی فکسڈ تعداد یا فنڈ مینجمنٹ۔
اسٹاپ لائن سلائڈ پوائنٹس میں اضافے کے لئے اسٹاپ نقصان کی حکمت عملی کو بہتر بنائیں۔
یہ حکمت عملی مجموعی طور پر ایک عام رجحان ٹریکنگ حکمت عملی ہے ، جس کا فیصلہ متعدد گروپ ایم اے کے کراسنگ کے ذریعہ کیا جاتا ہے۔ یہ ایک نسبتا stable مستحکم رجحان ٹریکنگ حکمت عملی ہے۔ اس کو پیرامیٹرز کی اصلاح ، اشارے کے فلٹرنگ ، پوزیشن مینجمنٹ وغیرہ کے ذریعہ مزید بہتر بنایا جاسکتا ہے۔ لیکن بنیادی نظریہ سادہ اور واضح ہے ، جو ابتدائی سیکھنے اور مشق کے لئے موزوں ہے۔ اگر پیرامیٹرز کو مناسب طریقے سے بہتر بنایا جائے تو ، اس حکمت عملی کو رجحان کے واضح بازار میں مستحکم منافع حاصل کیا جاسکتا ہے۔
/*backtest
start: 2023-10-02 00:00:00
end: 2023-11-01 00:00:00
period: 1h
basePeriod: 15m
exchanges: [{"eid":"Futures_Binance","currency":"BTC_USDT"}]
*/
//@version=4
//
// Pine Script v4
// @author BigBitsIO
// Script Library: https://www.tradingview.com/u/BigBitsIO/#published-scripts
//
// study(title, shorttitle, overlay, format, precision)
// https://www.tradingview.com/pine-script-reference/#fun_strategy
strategy(shorttitle = "TManyMA Strategy - STA - Stops", title="Triple Many Moving Averages", overlay=true, pyramiding=1, default_qty_type=strategy.percent_of_equity, default_qty_value=100)
// MA#Period is a variable used to store the indicator lookback period. In this case, from the input.
// input - https://www.tradingview.com/pine-script-docs/en/v4/annotations/Script_inputs.html
MA1Period = input(50, title="MA1 Period", minval=1, step=1)
MA1Type = input(title="MA1 Type", defval="SMA", options=["RMA", "SMA", "EMA", "WMA", "HMA", "DEMA", "TEMA", "VWMA"])
MA1Source = input(title="MA1 Source", type=input.source, defval=close)
MA1Resolution = input(title="MA1 Resolution", defval="00 Current", options=["00 Current", "01 1m", "02 3m", "03 5m", "04 15m", "05 30m", "06 45m", "07 1h", "08 2h", "09 3h", "10 4h", "11 1D", "12 1W", "13 1M"])
MA1Visible = input(title="MA1 Visible", type=input.bool, defval=true) // Will automatically hide crossBovers containing this MA
MA2Period = input(100, title="MA2 Period", minval=1, step=1)
MA2Type = input(title="MA2 Type", defval="SMA", options=["RMA", "SMA", "EMA", "WMA", "HMA", "DEMA", "TEMA", "VWMA"])
MA2Source = input(title="MA2 Source", type=input.source, defval=close)
MA2Resolution = input(title="MA2 Resolution", defval="00 Current", options=["00 Current", "01 1m", "02 3m", "03 5m", "04 15m", "05 30m", "06 45m", "07 1h", "08 2h", "09 3h", "10 4h", "11 1D", "12 1W", "13 1M"])
MA2Visible = input(title="MA2 Visible", type=input.bool, defval=true) // Will automatically hide crossovers containing this MA
MA3Period = input(200, title="MA3 Period", minval=1, step=1)
MA3Type = input(title="MA3 Type", defval="SMA", options=["RMA", "SMA", "EMA", "WMA", "HMA", "DEMA", "TEMA", "VWMA"])
MA3Source = input(title="MA3 Source", type=input.source, defval=close)
MA3Resolution = input(title="MA3 Resolution", defval="00 Current", options=["00 Current", "01 1m", "02 3m", "03 5m", "04 15m", "05 30m", "06 45m", "07 1h", "08 2h", "09 3h", "10 4h", "11 1D", "12 1W", "13 1M"])
MA3Visible = input(title="MA3 Visible", type=input.bool, defval=true) // Will automatically hide crossovers containing this MA
ShowCrosses = input(title="Show Crosses", type=input.bool, defval=false)
ForecastBias = input(title="Forecast Bias", defval="Neutral", options=["Neutral", "Bullish", "Bearish"])
ForecastBiasPeriod = input(14, title="Forecast Bias Period")
ForecastBiasMagnitude = input(1, title="Forecast Bias Magnitude", minval=0.25, maxval=20, step=0.25)
ShowForecasts = input(title="Show Forecasts", type=input.bool, defval=true)
ShowRibbons = input(title="Show Ribbons", type=input.bool, defval=true)
TradeMA12Crosses = input(title="Trade MA 1-2 Crosses", type=input.bool, defval=true)
TradeMA13Crosses = input(title="Trade MA 1-3 Crosses", type=input.bool, defval=true)
TradeMA23Crosses = input(title="Trade MA 2-3 Crosses", type=input.bool, defval=true)
TakeProfitPercent = input(30, title="Take Profit Percent", minval=0.01, step=0.5)
StopLossPercent = input(15, title="Stop Loss Percent", minval=0.01, step=0.5)
// MA# is a variable used to store the actual moving average value.
// if statements - https://www.tradingview.com/pine-script-reference/#op_if
// MA functions - https://www.tradingview.com/pine-script-reference/ (must search for appropriate MA)
// custom functions in pine - https://www.tradingview.com/wiki/Declaring_Functions
ma(MAType, MASource, MAPeriod) =>
if MAType == "SMA"
sma(MASource, MAPeriod)
else
if MAType == "EMA"
ema(MASource, MAPeriod)
else
if MAType == "WMA"
wma(MASource, MAPeriod)
else
if MAType == "RMA"
rma(MASource, MAPeriod)
else
if MAType == "HMA"
wma(2*wma(MASource, MAPeriod/2)-wma(MASource, MAPeriod), round(sqrt(MAPeriod)))
else
if MAType == "DEMA"
e = ema(MASource, MAPeriod)
2 * e - ema(e, MAPeriod)
else
if MAType == "TEMA"
e = ema(MASource, MAPeriod)
3 * (e - ema(e, MAPeriod)) + ema(ema(e, MAPeriod), MAPeriod)
else
if MAType == "VWMA"
vwma(MASource, MAPeriod)
res(MAResolution) =>
if MAResolution == "00 Current"
timeframe.period
else
if MAResolution == "01 1m"
"1"
else
if MAResolution == "02 3m"
"3"
else
if MAResolution == "03 5m"
"5"
else
if MAResolution == "04 15m"
"15"
else
if MAResolution == "05 30m"
"30"
else
if MAResolution == "06 45m"
"45"
else
if MAResolution == "07 1h"
"60"
else
if MAResolution == "08 2h"
"120"
else
if MAResolution == "09 3h"
"180"
else
if MAResolution == "10 4h"
"240"
else
if MAResolution == "11 1D"
"1D"
else
if MAResolution == "12 1W"
"1W"
else
if MAResolution == "13 1M"
"1M"
// https://www.tradingview.com/pine-script-reference/#fun_request.security
MA1 = request.security(syminfo.tickerid, res(MA1Resolution), ma(MA1Type, MA1Source, MA1Period))
MA2 = request.security(syminfo.tickerid, res(MA2Resolution), ma(MA2Type, MA2Source, MA2Period))
MA3 = request.security(syminfo.tickerid, res(MA3Resolution), ma(MA3Type, MA3Source, MA3Period))
// Plotting crossover/unders for all combinations of crosses
// Crossovers no longer detected in label code, they need to be re-used for strategy - crosses and visibility must be set
MA12Crossover = MA1Visible and MA2Visible and crossover(MA1, MA2)
MA12Crossunder = MA1Visible and MA2Visible and crossunder(MA1, MA2)
MA13Crossover = MA1Visible and MA3Visible and crossover(MA1, MA3)
MA13Crossunder = MA1Visible and MA3Visible and crossunder(MA1, MA3)
MA23Crossover = MA2Visible and MA3Visible and crossover(MA2, MA3)
MA23Crossunder = MA2Visible and MA3Visible and crossunder(MA2, MA3)
// https://www.tradingview.com/pine-script-reference/v4/#fun_label%7Bdot%7Dnew
if ShowCrosses and MA12Crossunder
lun1 = label.new(bar_index, na, tostring(MA1Period)+' '+MA1Type+' crossed under '+tostring(MA2Period)+' '+MA2Type,
color=color.red,
textcolor=color.red,
style=label.style_xcross, size=size.small)
label.set_y(lun1, MA1)
if ShowCrosses and MA12Crossover
lup1 = label.new(bar_index, na, tostring(MA1Period)+' '+MA1Type+' crossed over '+tostring(MA2Period)+' '+MA2Type,
color=color.green,
textcolor=color.green,
style=label.style_xcross, size=size.small)
label.set_y(lup1, MA1)
if ShowCrosses and MA13Crossunder
lun2 = label.new(bar_index, na, tostring(MA1Period)+' '+MA1Type+' crossed under '+tostring(MA3Period)+' '+MA3Type,
color=color.red,
textcolor=color.red,
style=label.style_xcross, size=size.small)
label.set_y(lun2, MA1)
if ShowCrosses and MA13Crossover
lup2 = label.new(bar_index, na, tostring(MA1Period)+' '+MA1Type+' crossed over '+tostring(MA3Period)+' '+MA3Type,
color=color.green,
textcolor=color.green,
style=label.style_xcross, size=size.small)
label.set_y(lup2, MA1)
if ShowCrosses and MA23Crossunder
lun3 = label.new(bar_index, na, tostring(MA2Period)+' '+MA2Type+' crossed under '+tostring(MA3Period)+' '+MA3Type,
color=color.red,
textcolor=color.red,
style=label.style_xcross, size=size.small)
label.set_y(lun3, MA2)
if ShowCrosses and MA23Crossover
lup3 = label.new(bar_index, na, tostring(MA2Period)+' '+MA2Type+' crossed over '+tostring(MA3Period)+' '+MA3Type,
color=color.green,
textcolor=color.green,
style=label.style_xcross, size=size.small)
label.set_y(lup3, MA2)
// plot - This will draw the information on the chart
// plot - https://www.tradingview.com/pine-script-docs/en/v4/annotations/plot_annotation.html
plot(MA1Visible ? MA1 : na, color=color.green, linewidth=2, title="MA1")
plot(MA2Visible ? MA2 : na, color=color.yellow, linewidth=3, title="MA2")
plot(MA3Visible ? MA3 : na, color=color.red, linewidth=4, title="MA3")
// Forecasting - forcasted prices are calculated using our MAType and MASource for the MAPeriod - the last X candles.
// it essentially replaces the oldest X candles, with the selected source * X candles
// Bias - We'll add an "adjustment" for each additional candle being forecasted based on ATR of the previous X candles
// custom functions in pine - https://www.tradingview.com/wiki/Declaring_Functions
bias(Bias, BiasPeriod) =>
if Bias == "Neutral"
0
else
if Bias == "Bullish"
(atr(BiasPeriod) * ForecastBiasMagnitude)
else
if Bias == "Bearish"
((atr(BiasPeriod) * ForecastBiasMagnitude) * -1) // multiplying by -1 to make it a negative, bearish bias
// Note - Can not show forecasts on different resolutions at the moment, x-axis is an issue
Bias = bias(ForecastBias, ForecastBiasPeriod) // 14 is default atr period
MA1Forecast1 = (request.security(syminfo.tickerid, res(MA1Resolution), ma(MA1Type, MA1Source, MA1Period - 1)) * (MA1Period - 1) + ((MA1Source * 1) + (Bias * 1))) / MA1Period
MA1Forecast2 = (request.security(syminfo.tickerid, res(MA1Resolution), ma(MA1Type, MA1Source, MA1Period - 2)) * (MA1Period - 2) + ((MA1Source * 2) + (Bias * 2))) / MA1Period
MA1Forecast3 = (request.security(syminfo.tickerid, res(MA1Resolution), ma(MA1Type, MA1Source, MA1Period - 3)) * (MA1Period - 3) + ((MA1Source * 3) + (Bias * 3))) / MA1Period
MA1Forecast4 = (request.security(syminfo.tickerid, res(MA1Resolution), ma(MA1Type, MA1Source, MA1Period - 4)) * (MA1Period - 4) + ((MA1Source * 4) + (Bias * 4))) / MA1Period
MA1Forecast5 = (request.security(syminfo.tickerid, res(MA1Resolution), ma(MA1Type, MA1Source, MA1Period - 5)) * (MA1Period - 5) + ((MA1Source * 5) + (Bias * 5))) / MA1Period
plot(MA1Resolution == "00 Current" and ShowForecasts and MA1Visible ? MA1Forecast1 : na, color=color.green, linewidth=1, style=plot.style_circles, title="MA1 Forecast 1", offset=1, show_last=1)
plot(MA1Resolution == "00 Current" and ShowForecasts and MA1Visible ? MA1Forecast2 : na, color=color.green, linewidth=1, style=plot.style_circles, title="MA1 Forecast 2", offset=2, show_last=1)
plot(MA1Resolution == "00 Current" and ShowForecasts and MA1Visible ? MA1Forecast3 : na, color=color.green, linewidth=1, style=plot.style_circles, title="MA1 Forecast 3", offset=3, show_last=1)
plot(MA1Resolution == "00 Current" and ShowForecasts and MA1Visible ? MA1Forecast4 : na, color=color.green, linewidth=1, style=plot.style_circles, title="MA1 Forecast 4", offset=4, show_last=1)
plot(MA1Resolution == "00 Current" and ShowForecasts and MA1Visible ? MA1Forecast5 : na, color=color.green, linewidth=1, style=plot.style_circles, title="MA1 Forecast 5", offset=5, show_last=1)
MA2Forecast1 = (request.security(syminfo.tickerid, res(MA2Resolution), ma(MA2Type, MA2Source, MA2Period - 1)) * (MA2Period - 1) + ((MA1Source * 1) + (Bias * 1))) / MA2Period
MA2Forecast2 = (request.security(syminfo.tickerid, res(MA2Resolution), ma(MA2Type, MA2Source, MA2Period - 2)) * (MA2Period - 2) + ((MA1Source * 2) + (Bias * 2))) / MA2Period
MA2Forecast3 = (request.security(syminfo.tickerid, res(MA2Resolution), ma(MA2Type, MA2Source, MA2Period - 3)) * (MA2Period - 3) + ((MA1Source * 3) + (Bias * 3))) / MA2Period
MA2Forecast4 = (request.security(syminfo.tickerid, res(MA2Resolution), ma(MA2Type, MA2Source, MA2Period - 4)) * (MA2Period - 4) + ((MA1Source * 4) + (Bias * 4))) / MA2Period
MA2Forecast5 = (request.security(syminfo.tickerid, res(MA2Resolution), ma(MA2Type, MA2Source, MA2Period - 5)) * (MA2Period - 5) + ((MA1Source * 5) + (Bias * 5))) / MA2Period
plot(MA2Resolution == "00 Current" and ShowForecasts and MA2Visible ? MA2Forecast1 : na, color=color.yellow, linewidth=1, style=plot.style_circles, title="MA2 Forecast 1", offset=1, show_last=1)
plot(MA2Resolution == "00 Current" and ShowForecasts and MA2Visible ? MA2Forecast2 : na, color=color.yellow, linewidth=1, style=plot.style_circles, title="MA2 Forecast 2", offset=2, show_last=1)
plot(MA2Resolution == "00 Current" and ShowForecasts and MA2Visible ? MA2Forecast3 : na, color=color.yellow, linewidth=1, style=plot.style_circles, title="MA2 Forecast 3", offset=3, show_last=1)
plot(MA2Resolution == "00 Current" and ShowForecasts and MA2Visible ? MA2Forecast4 : na, color=color.yellow, linewidth=1, style=plot.style_circles, title="MA2 Forecast 4", offset=4, show_last=1)
plot(MA2Resolution == "00 Current" and ShowForecasts and MA2Visible ? MA2Forecast5 : na, color=color.yellow, linewidth=1, style=plot.style_circles, title="MA2 Forecast 5", offset=5, show_last=1)
MA3Forecast1 = (request.security(syminfo.tickerid, res(MA3Resolution), ma(MA3Type, MA3Source, MA3Period - 1)) * (MA3Period - 1) + ((MA1Source * 1) + (Bias * 1))) / MA3Period
MA3Forecast2 = (request.security(syminfo.tickerid, res(MA3Resolution), ma(MA3Type, MA3Source, MA3Period - 2)) * (MA3Period - 2) + ((MA1Source * 2) + (Bias * 2))) / MA3Period
MA3Forecast3 = (request.security(syminfo.tickerid, res(MA3Resolution), ma(MA3Type, MA3Source, MA3Period - 3)) * (MA3Period - 3) + ((MA1Source * 3) + (Bias * 3))) / MA3Period
MA3Forecast4 = (request.security(syminfo.tickerid, res(MA3Resolution), ma(MA3Type, MA3Source, MA3Period - 4)) * (MA3Period - 4) + ((MA1Source * 4) + (Bias * 4))) / MA3Period
MA3Forecast5 = (request.security(syminfo.tickerid, res(MA3Resolution), ma(MA3Type, MA3Source, MA3Period - 5)) * (MA3Period - 5) + ((MA1Source * 5) + (Bias * 5))) / MA3Period
plot(MA3Resolution == "00 Current" and ShowForecasts and MA3Visible ? MA3Forecast1 : na, color=color.red, linewidth=1, style=plot.style_circles, title="MA3 Forecast 1", offset=1, show_last=1)
plot(MA3Resolution == "00 Current" and ShowForecasts and MA3Visible ? MA3Forecast2 : na, color=color.red, linewidth=1, style=plot.style_circles, title="MA3 Forecast 2", offset=2, show_last=1)
plot(MA3Resolution == "00 Current" and ShowForecasts and MA3Visible ? MA3Forecast3 : na, color=color.red, linewidth=1, style=plot.style_circles, title="MA3 Forecast 3", offset=3, show_last=1)
plot(MA3Resolution == "00 Current" and ShowForecasts and MA3Visible ? MA3Forecast4 : na, color=color.red, linewidth=1, style=plot.style_circles, title="MA3 Forecast 4", offset=4, show_last=1)
plot(MA3Resolution == "00 Current" and ShowForecasts and MA3Visible ? MA3Forecast5 : na, color=color.red, linewidth=1, style=plot.style_circles, title="MA3 Forecast 5", offset=5, show_last=1)
// Ribbon related code
// For Ribbons to work - they must use the same MAType, MAResolution and MASource. This is to ensure the ribbons are fair between one to the other.
// Ribbons also will usually look better if MA1Period < MA2Period and MA2Period < MA3Period
// custom functions in pine - https://www.tradingview.com/wiki/Declaring_Functions
// This function is used to calculate the period to be used on a ribbon based on existing MAs
rperiod(P1, P2, Step, Ribbons) =>
((abs(P1 - P2)) / (Ribbons + 1) * Step) + min(P1, P2)
// divide by +1 so that 5 lines can show. Divide by 5 and one line shows up on another MA
// MA1-MA2
Ribbon1 = request.security(syminfo.tickerid, res(MA1Resolution), ma(MA1Type, MA1Source, rperiod(MA1Period, MA2Period, 1, 5)))
Ribbon2 = request.security(syminfo.tickerid, res(MA1Resolution), ma(MA1Type, MA1Source, rperiod(MA1Period, MA2Period, 2, 5)))
Ribbon3 = request.security(syminfo.tickerid, res(MA1Resolution), ma(MA1Type, MA1Source, rperiod(MA1Period, MA2Period, 3, 5)))
Ribbon4 = request.security(syminfo.tickerid, res(MA1Resolution), ma(MA1Type, MA1Source, rperiod(MA1Period, MA2Period, 4, 5)))
Ribbon5 = request.security(syminfo.tickerid, res(MA1Resolution), ma(MA1Type, MA1Source, rperiod(MA1Period, MA2Period, 5, 5)))
plot(ShowRibbons and MA1Type == MA2Type and MA1Resolution == MA2Resolution and MA1Source == MA2Source ? Ribbon1 : na, color=color.green, linewidth=1, style=plot.style_line, title="Ribbon1", transp=90)
plot(ShowRibbons and MA1Type == MA2Type and MA1Resolution == MA2Resolution and MA1Source == MA2Source ? Ribbon2 : na, color=color.green, linewidth=1, style=plot.style_line, title="Ribbon2", transp=85)
plot(ShowRibbons and MA1Type == MA2Type and MA1Resolution == MA2Resolution and MA1Source == MA2Source ? Ribbon3 : na, color=color.green, linewidth=1, style=plot.style_line, title="Ribbon3", transp=80)
plot(ShowRibbons and MA1Type == MA2Type and MA1Resolution == MA2Resolution and MA1Source == MA2Source ? Ribbon4 : na, color=color.yellow, linewidth=1, style=plot.style_line, title="Ribbon4", transp=75)
plot(ShowRibbons and MA1Type == MA2Type and MA1Resolution == MA2Resolution and MA1Source == MA2Source ? Ribbon5 : na, color=color.yellow, linewidth=1, style=plot.style_line, title="Ribbon5", transp=70)
// MA2-MA3
Ribbon6 = request.security(syminfo.tickerid, res(MA2Resolution), ma(MA2Type, MA2Source, rperiod(MA2Period, MA3Period, 1, 5)))
Ribbon7 = request.security(syminfo.tickerid, res(MA2Resolution), ma(MA2Type, MA2Source, rperiod(MA2Period, MA3Period, 2, 5)))
Ribbon8 = request.security(syminfo.tickerid, res(MA2Resolution), ma(MA2Type, MA2Source, rperiod(MA2Period, MA3Period, 3, 5)))
Ribbon9 = request.security(syminfo.tickerid, res(MA2Resolution), ma(MA2Type, MA2Source, rperiod(MA2Period, MA3Period, 4, 5)))
Ribbon10 = request.security(syminfo.tickerid, res(MA2Resolution), ma(MA2Type, MA2Source, rperiod(MA2Period, MA3Period, 5, 5)))
plot(ShowRibbons and MA2Type == MA3Type and MA2Resolution == MA3Resolution and MA2Source == MA3Source ? Ribbon6 : na, color=color.yellow, linewidth=1, style=plot.style_line, title="Ribbon6", transp=70)
plot(ShowRibbons and MA2Type == MA3Type and MA2Resolution == MA3Resolution and MA2Source == MA3Source ? Ribbon7 : na, color=color.yellow, linewidth=1, style=plot.style_line, title="Ribbon7", transp=75)
plot(ShowRibbons and MA2Type == MA3Type and MA2Resolution == MA3Resolution and MA2Source == MA3Source ? Ribbon8 : na, color=color.red, linewidth=1, style=plot.style_line, title="Ribbon8", transp=80)
plot(ShowRibbons and MA2Type == MA3Type and MA2Resolution == MA3Resolution and MA2Source == MA3Source ? Ribbon9 : na, color=color.red, linewidth=1, style=plot.style_line, title="Ribbon9", transp=85)
plot(ShowRibbons and MA2Type == MA3Type and MA2Resolution == MA3Resolution and MA2Source == MA3Source ? Ribbon10 : na, color=color.red, linewidth=1, style=plot.style_line, title="Ribbon10", transp=90)
// Strategy Specific
ProfitTarget = (close * (TakeProfitPercent / 100)) / syminfo.mintick
LossTarget = (close * (StopLossPercent / 100)) / syminfo.mintick
if MA12Crossover and TradeMA12Crosses
//https://www.tradingview.com/pine-script-reference/#fun_strategy{dot}entry
strategy.entry("1 over 2", true) // buy by market
strategy.exit("profit or loss", "1 over 2", profit = ProfitTarget, loss = LossTarget)
if MA12Crossunder and TradeMA12Crosses
//https://www.tradingview.com/pine-script-reference/#fun_strategy{dot}close
strategy.close("1 over 2") // sell by market
if MA13Crossover and TradeMA13Crosses
//https://www.tradingview.com/pine-script-reference/#fun_strategy{dot}entry
strategy.entry("1 over 3", true) // buy by market
strategy.exit("profit or loss", "1 over 3", profit = ProfitTarget, loss = LossTarget)
if MA13Crossunder and TradeMA13Crosses
//https://www.tradingview.com/pine-script-reference/#fun_strategy{dot}close
strategy.close("1 over 3") // sell by market
if MA23Crossover and TradeMA23Crosses
//https://www.tradingview.com/pine-script-reference/#fun_strategy{dot}entry
strategy.entry("2 over 3", true) // buy by market
strategy.exit("profit or loss", "2 over 3", profit = ProfitTarget, loss = LossTarget)
if MA23Crossunder and TradeMA23Crosses
//https://www.tradingview.com/pine-script-reference/#fun_strategy{dot}close
strategy.close("2 over 3") // sell by market