سپر Ichimoku رجحان کی حکمت عملی

جائزہ
ایک سے زیادہ حکمت عملی ایک سے زیادہ اشارے کی بنیاد پر تجارتی فیصلے کرنے کی رجحان ٹریڈنگ حکمت عملی ہے۔ یہ حکمت عملی موجودہ رجحان کی سمت کا فیصلہ کرنے کے لئے ایک سے زیادہ اشارے کی تبدیلی کی لائن ، بیس لائن اور کلاؤڈ بینڈ کے تعلقات کا استعمال کرتی ہے ، اور قیمت کی واپسی کے ساتھ مل کر داخلے کے لئے ہے۔
ایک سے زیادہ حکمت عملی بنیادی طور پر درمیانی لمبی لائنوں کے رجحانات کی تجارت کے لئے موزوں ہے ، اور بڑے رجحانات میں منافع بخش ہے۔ اس حکمت عملی میں ایک مضبوط رجحان کی شناخت کی صلاحیت بھی ہے۔
حکمت عملی کا اصول
ایک سے زیادہ حکمت عملی میں ٹریڈنگ کی سمت کا تعین کرنے کے لئے مندرجہ ذیل عوامل پر غور کیا جاتا ہے:
-
**تبدیلی کی لائن اور بیس لائن کا تعلق:**جب ٹرانسمیشن لائن اوپر کی طرف بڑھتی ہے، نیچے کی طرف بڑھتی ہے
-
**بادلوں کے رنگ:**جب بادل سبز ہوں تو اُونگھیں دیکھیں، جب سرخ ہوں تو گھٹائیں
-
**قیمتوں میں تبدیلی:**قیمتوں کی واپسی کی تبدیلی کی لائن اور بیس لائن سے باہر داخل ہونے کی ضرورت ہے
اس حکمت عملی کے تحت ٹریڈنگ سگنل یہ ہیں:
ایک اور سگنل:
- تبادلوں کی لائن بیس لائن سے زیادہ ہے
- قیمتوں میں تبدیلی کی لائن اور بیس لائن سے زیادہ
- مبدل لائن اور بیس لائن بادلوں کے بینڈ سے اوپر
- قیمتوں میں تبدیلی کی لائن اور بیس لائن سے نیچے کی واپسی
اس کا مطلب ہے:
- بیس لائن سے نیچے ٹرانسمیشن لائن
- قیمتوں میں تبدیلی کی لائن اور بیس لائن سے نیچے
- بادلوں کے بینڈ سے نیچے کنورٹ لائن اور بیس لائن
- قیمتوں میں تبدیلی کی لائن اور بیس لائن سے اوپر کی واپسی
جب ایک ہی وقت میں زیادہ / خالی سگنل کو پورا کیا جاتا ہے تو ، پوزیشن کے حالات کے مطابق پوزیشن کھولنے کا آپریشن کیا جاتا ہے۔
طاقت کا تجزیہ
ٹاپ ون حکمت عملی کے فوائد یہ ہیں:
-
ایک سے زیادہ اشارے کے مجموعے کا استعمال کرتے ہوئے رجحان کی سمت کا تعین کرنے کے لئے اعلی درستگی
-
منتقلی کی لائن اور بیس لائن مختصر مدت کے رجحانات کو واضح طور پر طے کرتی ہے ، اور بادل کی پٹی طویل مدتی رجحانات کا فیصلہ کرتی ہے
-
شرط یہ ہے کہ قیمتوں میں واپسی کی لکیروں سے بچنے کے لئے قیمتوں میں واپسی کی لکیروں سے بچنے کے لئے
-
خطرے کے کنٹرول میں حالیہ مدت کے لئے سب سے زیادہ کم قیمت کا تعین کرنے کی روک تھام کو اپنانا ، جو انفرادی نقصان کو مؤثر طریقے سے کنٹرول کرے
-
مستحکم آمدنی کے لئے معقول منافع سے زیادہ نقصانات
-
طویل اور درمیانی لائن رجحان ٹریڈنگ کے لئے موزوں ہے
-
حکمت عملی کے خیالات واضح اور سمجھنے میں آسان ہیں ، پیرامیٹرز کو بہتر بنانے کے لئے کافی جگہ ہے
-
مارکیٹ کے مختلف ماحول میں کام کرتا ہے
خطرے کا تجزیہ
ایک سے زیادہ حکمت عملیوں کے خطرات یہ ہیں:
-
ہلچل والے بازاروں میں ، اسٹاپ نقصانات کو کثرت سے متحرک کیا جاسکتا ہے ، جس سے منافع متاثر ہوتا ہے۔
-
جب رجحانات میں تیزی سے تبدیلی آتی ہے تو ، بروقت پوزیشنوں کو تبدیل کرنے میں ناکامی ، ممکنہ طور پر نقصان کا باعث بن سکتی ہے۔
-
سیٹ کی جیت اور نقصان کا تناسب تمام اقسام کے لئے موزوں نہیں ہے، مختلف معیار کے لئے ایڈجسٹ پیرامیٹرز کی ضرورت ہے
-
جب بادلوں کے بینڈ کو توڑنے کے بعد لفٹ کی جگہ محدود ہو تو ، ممکنہ منافع محدود ہوسکتا ہے
-
بار بار جانچ کی ضرورت ہوتی ہے اور بار بار پیرامیٹرز کو ایڈجسٹ کرنے کے لئے مناسب نہیں ہے
مندرجہ ذیل طریقوں سے خطرے کو کم کیا جا سکتا ہے:
-
اصلاحی پیرامیٹرز جو مختلف دورانیہ اور نسل کی خصوصیات کے مطابق ہیں
-
دوسرے اشارے کے ساتھ مل کر انٹری سگنلز کو فلٹر کریں تاکہ ہلکے بازار میں جعلی توڑ سے بچا جاسکے
-
متحرک طور پر اسٹاپ نقصان کی پوزیشن کو ایڈجسٹ کریں تاکہ اسٹاپ نقصان کے متحرک ہونے کا امکان کم ہوجائے
-
مختلف منافع اور نقصان کی ترتیب کی جانچ پڑتال
-
رجحان سگنل کی طاقت کا تعین کرنے کے لئے چارٹ کی شکل جیسے طریقوں کا استعمال کرنا
اصلاح کی سمت
ایک سے زیادہ حکمت عملی کو بہتر بنانے کے لئے:
-
ٹرانسمیشن لائن اور بیس لائن پیرامیٹرز کو بہتر بنانے کے لئے جو تجارت شدہ قسم کی خصوصیات کے مطابق ہے
-
کلاؤڈ بینڈ پیرامیٹرز کو بہتر بنائیں تاکہ کلاؤڈ بینڈ طویل مدتی رجحانات کا زیادہ درست اندازہ لگائیں
-
زیادہ سے زیادہ روکنے والے الگورتھم جیسے اے ٹی آر کے مطابق روکنے یا متحرک روکنے
-
دوسرے اشارے کے ساتھ مل کر سگنل فلٹرنگ ، فلٹرنگ کے مزید حالات ترتیب دیں ، اور غلط اندراج کے امکانات کو کم کریں
-
مختلف اقسام اور دورانیہ پر حکمت عملی کی خصوصیات کو اپنانے کے لئے منافع اور نقصان کے تناسب کی ترتیب کو بہتر بنائیں
-
مارٹینگلز کی طرح پوزیشنوں کا انتظام کریں ، مختلف مارکیٹ میں اتار چڑھاو کی تعدد کے مطابق
-
اعلی استحکام کے لئے پیرامیٹرز کو بہتر بنانے کے لئے مشین لرننگ کے طریقوں کا استعمال
-
مختلف ٹریڈنگ ٹائم فریموں کو ترتیب دیں اور رات اور ڈسک کے درمیان ٹریڈنگ کی خصوصیات کو ایڈجسٹ کریں
خلاصہ کریں۔
مجموعی طور پر ، ایک سے زیادہ حکمت عملی ایک ایسی حکمت عملی ہے جو درمیانی اور لمبی لمبی رجحانات کی تجارت کے لئے موزوں ہے۔ اس میں ایک سے زیادہ اشارے کا استعمال رجحان کی سمت کا تعین کرنے کے لئے واضح طور پر فائدہ مند ہے ، اور قیمت کی واپسی کے ساتھ مل کر داخلے کو مؤثر طریقے سے غلط داخلے سے بچایا جاسکتا ہے۔ آپٹیمائزیشن پیرامیٹرز کی ترتیب سے ، حکمت عملی کو زیادہ اقسام اور زیادہ ادوار پر مستحکم منافع حاصل کرنے کی اجازت دی جاسکتی ہے۔ یہ حکمت عملی سمجھنے میں آسان ہے ، اور اس میں بہت زیادہ اصلاح کی گنجائش ہے ، جو حکمت عملی کی تحقیق اور سیکھنے کے لئے بنیادی حکمت عملی میں سے ایک کے طور پر موزوں ہے۔
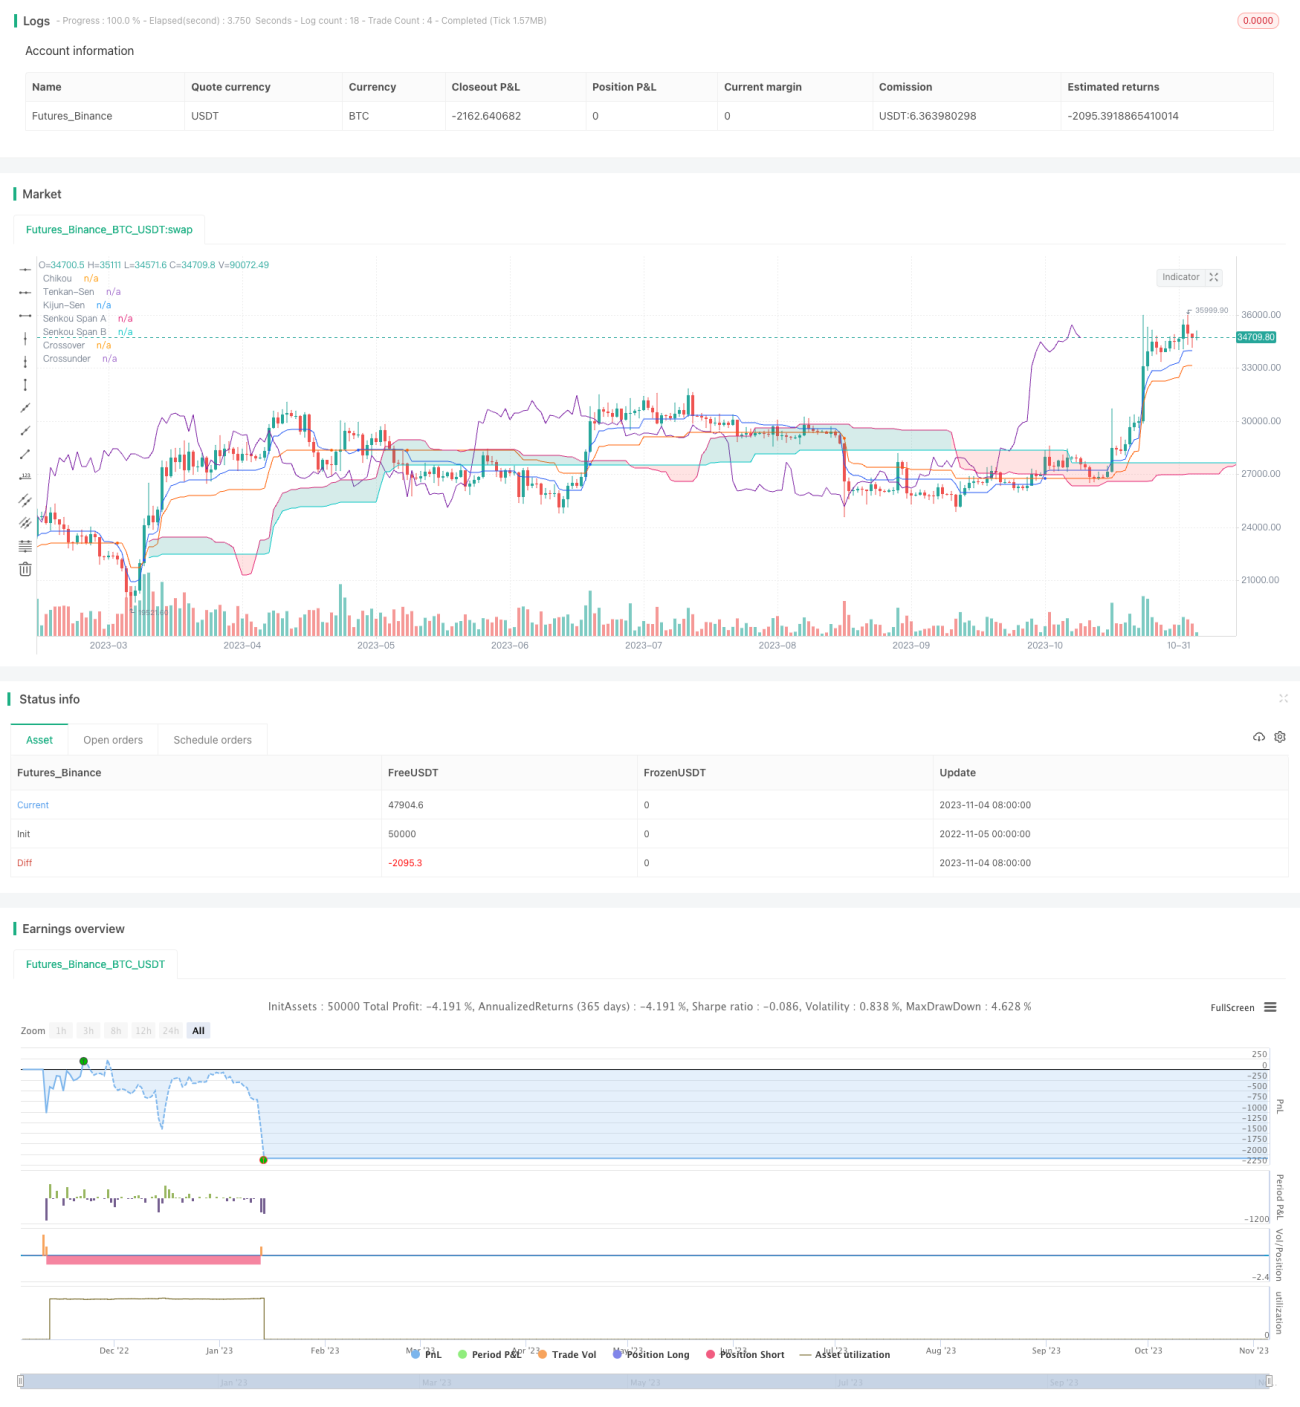
/*backtest
start: 2022-11-05 00:00:00
end: 2023-11-05 00:00:00
period: 1d
basePeriod: 1h
exchanges: [{"eid":"Futures_Binance","currency":"BTC_USDT"}]
*/

// Strategy based on the the SuperIchi indicator.
//
// Strategy was designed for the purpose of back testing.
// See strategy documentation for info on trade entry logic.- 1