فلائنگ ڈریگن ٹرینڈ اسٹریٹیجی


تخلیق کی تاریخ: 2023-11-07 14:57:23 آخر میں ترمیم کریں: 2023-11-07 14:57:23
کاپی: 0 کلکس کی تعداد: 845
1
پر توجہ دیں
1617
پیروکار

فلائنگ ڈریگن ٹرینڈ اسٹریٹیجی

جائزہ

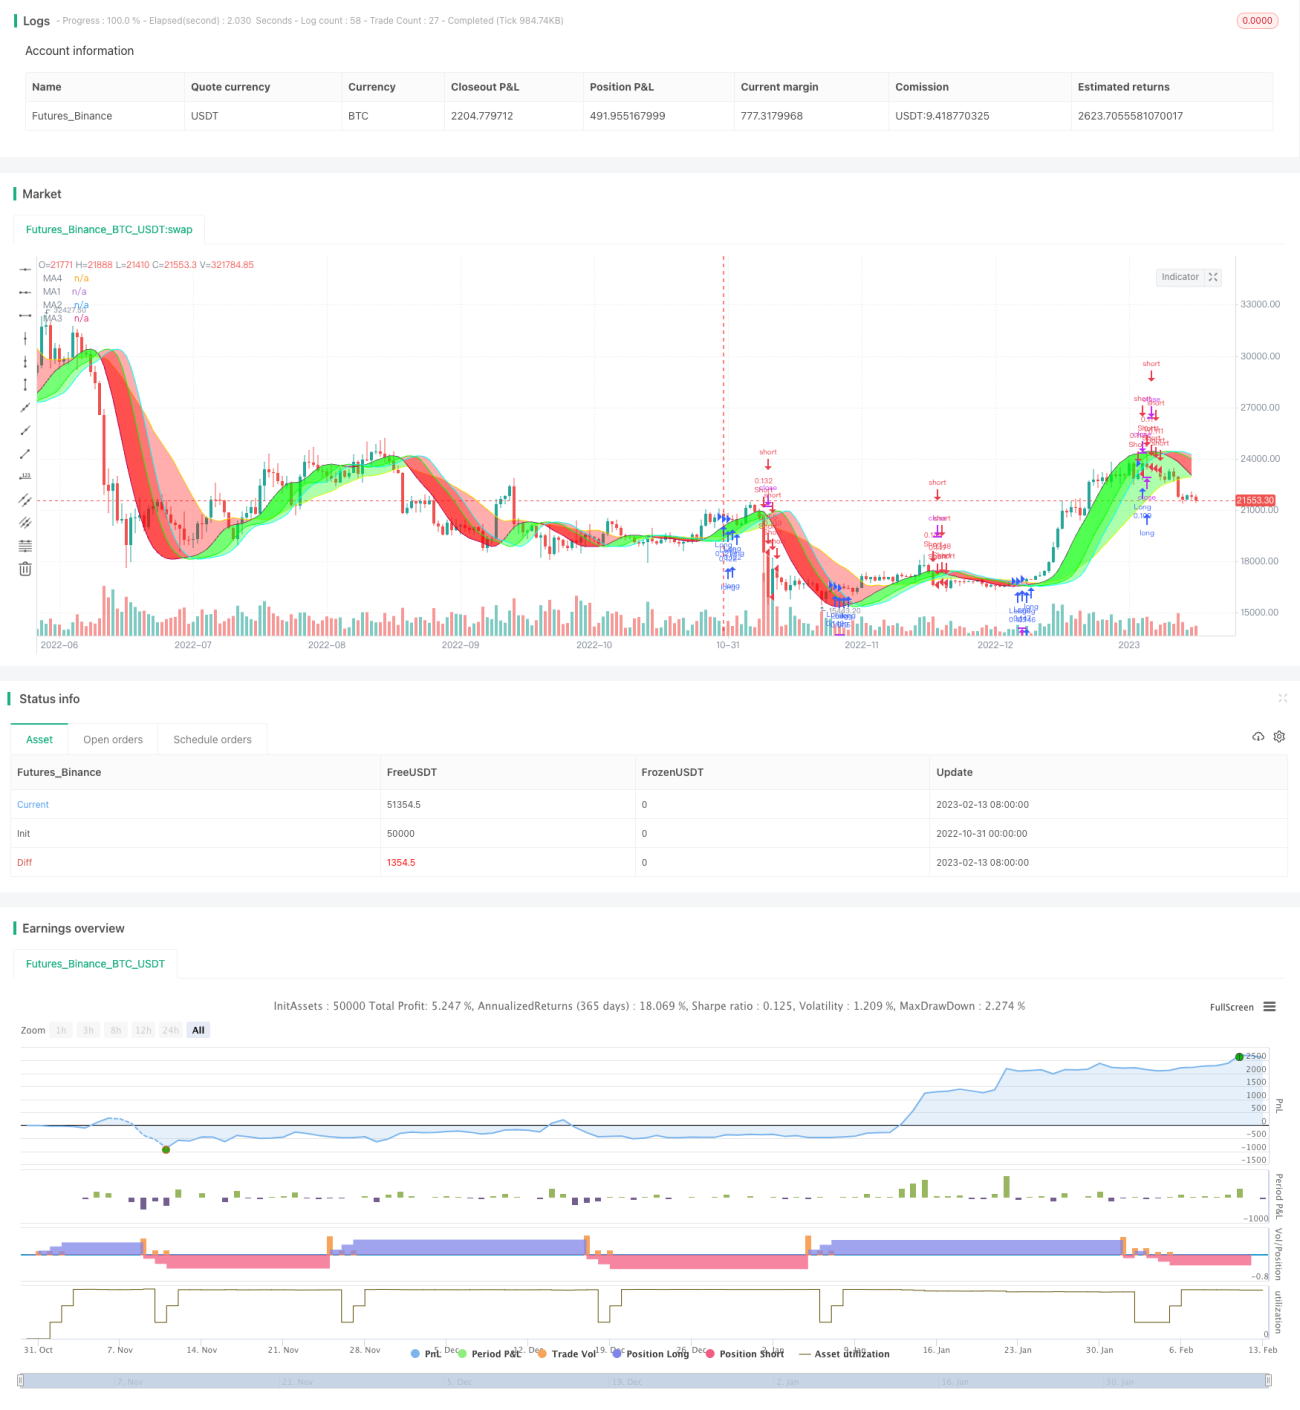
فائی لون رجحانات کی حکمت عملی رجحانات کا فیصلہ کرنے اور ٹریڈنگ سگنل پیدا کرنے کے لئے مختلف رنگوں کی رجحانات کی بینڈ کو نقشہ بنانے کے لئے ، قسم ، لمبائی اور منتقل اوسط کی نقل کو ایڈجسٹ کرکے رجحانات کا فیصلہ کرتی ہے۔ یہ حکمت عملی رجحانات کی درستگی اور تجارتی خطرے کے مابین توازن پیدا کرنے کے لئے مختلف وقت کے ادوار میں بہترین پیرامیٹرز کا مجموعہ تلاش کرسکتی ہے۔

حکمت عملی کا اصول

اس حکمت عملی میں ٹریڈ بینڈ کو دو حرکت پذیر اوسط کے ساتھ تیار کیا گیا ہے ، جن کی تعداد MA1 اور MA4 ہے۔ MA1 ایک تیز رفتار حرکت پذیر اوسط ہے ، اور MA4 ایک آہستہ چلنے والی اوسط ہے۔ اس کے ساتھ ہی ، MA1 نے 3 آفسیٹ (Offset1 ، Offset2 ، Offset3) قائم کیے ہیں ، جس سے MA2 ، MA3 کی تشکیل ہوتی ہے۔ جب قیمت کی لائن مختلف حرکت پذیر اوسطوں سے گزرتی ہے تو ، مختلف سطح کے تجارتی سگنل بنائے جاتے ہیں۔

صارف کو 5 خطرے کی سطحوں کا انتخاب کرنے کی اجازت ہے ، مختلف خطرے کی سطحوں کے تحت ، مختلف متحرک اوسطوں کو عبور کرنے سے ہی تجارتی سگنل تیار ہوتا ہے۔ اعلی سے کم خطرے کی ترتیب میں: MA1 آفسیٹ 1 ، MA2 ، MA3 ، MA4 ، تمام رجحانات کے رنگ یکساں ہیں۔ رجحان کے رنگ کا رنگ موجودہ رجحان کی سمت کو ظاہر کرتا ہے ، سبز بڑھتے ہوئے رجحان کے لئے ، سرخ گرنے والے رجحان کے لئے ہے۔

اس کے علاوہ، اس حکمت عملی کو روکنے کے نقصان کا استعمال کرنے کی اجازت دیتا ہے اور طویل، مختصر یا دو طرفہ تجارت کا انتخاب کرسکتا ہے.

طاقت کا تجزیہ

  • مارکیٹ کے وسیع تر ماحول کے لئے مختلف ٹائم فریموں میں بہترین پیرامیٹرز کا مجموعہ تلاش کریں
  • مختلف اقسام کے لئے مرضی کے مطابق کیا جا سکتا ہے کہ ایک سے زیادہ منتخب کر سکتے ہیں منتقل اوسط اقسام فراہم کرتا ہے
  • اس حکمت عملی کے مرکز میں ایڈجسٹ ایڈجسٹمنٹ ہے، جس سے رجحانات کا تعین زیادہ درست ہے.
  • منتخب کردہ خطرے کے درجے جو خطرے اور واپسی کے درمیان توازن تلاش کرتے ہیں
  • زیادہ سے زیادہ پیرامیٹرز کو لچکدار طریقے سے جوڑا جاسکتا ہے ، بہتر بنانے کے لئے زیادہ جگہ
  • بصری ٹریڈنگ سگنلز کے لئے بصری رجحانات کے بینڈ
  • خطرے کو کنٹرول کرنے کے لئے نقصان کی روک تھام کی حمایت کریں

خطرے کا تجزیہ

  • اعلی خطرے کی درجہ بندی کے تحت، غلط سگنل پیدا کرنے کے لئے آسان، خطرے کی درجہ بندی کو کم یا پیرامیٹرز کو ایڈجسٹ کرنا چاہئے
  • جب رجحان الٹ جاتا ہے تو ، لگاتار نقصان کو روکنے اور باہر نکلنے کا خطرہ ہوسکتا ہے
  • مختلف اقسام کے لئے الگ الگ ٹیسٹ اور اصلاح کے پیرامیٹرز کی ضرورت ہوتی ہے ، تمام پر ایک ہی پیرامیٹرز لاگو نہیں ہوسکتے ہیں
  • ہائی فریکوئینسی ٹریڈنگ کے لئے، ایک تیز رفتار منتقل اوسط کے لئے ایڈجسٹ کرنے کی ضرورت ہے ایک سست رفتار منتقل اوسط کی قیادت
  • غیر مناسب پیرامیٹرز کی اصلاح سے زیادہ حساسیت یا سست روی کا سبب بن سکتا ہے ، جس کی وجہ سے متعدد ٹیسٹ کی اصلاح کی ضرورت ہوتی ہے

خطرے کو کنٹرول اور کم کرنے کے لئے خطرے کی درجہ بندی کو کم کرنے، پیرامیٹرز کے مجموعے کی جانچ میں اضافہ، مختلف اقسام کے لئے پیرامیٹرز کو بہتر بنانے کے ذریعے کنٹرول اور کم کیا جا سکتا ہے.

اصلاح کی سمت

  • مختلف قسم کے منتقل اوسط مجموعے کی کوشش کریں
  • زیادہ لمبائی پیرامیٹرز کی جانچ کریں اور بہترین لمبائی تلاش کریں
  • آپ کو آپ کی رفتار کو ایڈجسٹ کرنے کے لئے ہوشیار رہنا چاہئے، یہ آپ کو بہتر بنانے کی کلید ہے.
  • مختلف اقسام کے مطابق سیگمنٹ آپٹیمائزیشن پیرامیٹرز
  • اسٹاپ نقصان کی جگہ کو بہتر بنائیں اور اس پر غور کریں کہ آیا آپ کو روکنے کی ضرورت ہے
  • مختلف پوزیشن کھولنے کے اصولوں کا مجموعہ آزمائیں
  • فلٹر کو بہتر بنانے کی ضرورت کا اندازہ لگانا
  • رجحان کی طاقت کے اشارے شامل کرنے پر غور کریں

خلاصہ کریں۔

فیلون رجحانات کی حکمت عملی نے ایک بصری رجحان ٹریڈنگ سسٹم ڈیزائن کیا ہے۔ اس حکمت عملی کے پیرامیٹرز کو ایڈجسٹ کیا جاسکتا ہے ، جو مختلف اقسام اور مارکیٹ کے حالات کے لئے بہتر طور پر بہتر بنایا جاسکتا ہے ، اور استحکام اور حساسیت کے مابین بہترین توازن تلاش کیا جاسکتا ہے۔ متعدد پیرامیٹرز کے مجموعے میں کافی حد تک اصلاح کی گنجائش ہے۔ مجموعی طور پر ، اس حکمت عملی کا نظریہ جدید ، منطقی ہے ، اور اس کی بہت طاقت ور عملی ہے۔ اگر پیرامیٹرز کو صحیح طریقے سے بہتر بنایا جائے تو ، یہ ایک بہت ہی طاقتور رجحانات کا نظام بن سکتا ہے۔

حکمت عملی کا ماخذ کوڈ
/*backtest
start: 2022-10-31 00:00:00
end: 2023-02-14 00:00:00
period: 1d
basePeriod: 1h
exchanges: [{"eid":"Futures_Binance","currency":"BTC_USDT"}]
*/

// This source code is subject to the terms of the Mozilla Public License 2.0 at https://mozilla.org/MPL/2.0/
// © MarkoP010 2023

//@version=5
//The basic idea of the strategy is to select the best set of MAs, types, lenghts and offsets, which draws red trend bands for downtrend (and green for uptrend).
//Strategy executes by selected risk level either when there is MA crossover with price (MA1 Offset1 on Highest risk level, MA2 on Low risk level) or three bands with the same color on at the same time (on Lowest risk level).
//Strategy plots user selectable Moving Average lines and a colored trend band between the MA lines. The trend bands can be turned off individually if required.
//The Offset option shifts the selected MA with the set number of steps to the right. That is where the Magic happens and the Dragon roars!

//Strategy version 1.0
strategy("Flying Dragon Trend Strategy", shorttitle="FD Trend Strategy", overlay=true, pyramiding=3, initial_capital=100000, default_qty_type=strategy.percent_of_equity, default_qty_value=5, commission_type=strategy.commission.cash_per_order, commission_value=10, calc_on_order_fills=false, process_orders_on_close=true)

strDirection = input.string(defval="Both", title="Strategy Direction", options=["Both", "Long", "Short"], group="Strategy") //Strategy direction selector by DashTrader
strSelection = strDirection == "Long" ? strategy.direction.long : strDirection == "Short" ? strategy.direction.short : strategy.direction.all //Strategy direction selector by DashTrader
strategy.risk.allow_entry_in(strSelection)

riskLevel = input.string(defval="Medium", title="Risk Level", options=["Highest", "High", "Medium", "Low", "Lowest"], tooltip="Strategy execution criteria. When Highest then MA1 Offset1 crossover with price, when Low then MA2 Offset crossover, when Lowest then all the Bands are the same color.", group="Strategy")

useStop = input(defval=false, title="Use Stop Loss", inline="SL", group="Strategy")
stopPrct = input.int(defval=10, title=" %", minval=0, maxval=100, step=1, inline="SL", group="Strategy") / 100

//Moving Averages function
MA(source, length, type) =>
    type == "EMA" ? ta.ema(source, length) :
     type == "HMA" ? ta.hma(source, length) :
     type == "RMA" ? ta.rma(source, length) :
     type == "SMA" ? ta.sma(source, length) :
     type == "SWMA" ? ta.swma(source) :
     type == "VWMA" ? ta.vwma(source, length) :
     type == "WMA" ? ta.wma(source, length) :
     na

//Inputs
ma1Type = input.string(defval="HMA", title="", inline="MA1", options=["EMA", "HMA", "RMA", "SMA","SWMA", "VWMA", "WMA"], group="Leading Moving Average") 
ma1Length = input.int(defval=35, title="",minval=1, inline="MA1", group="Leading Moving Average")
ma1Source = input(defval=close, title="", tooltip="For short timeframes, minutes to hours, instead of Default values try Lowest risk level and HMA75 with Offsets 0,1,4 and SMA12 with Offset 6.", inline="MA1", group="Leading Moving Average")
ma1Color  = input(defval=color.purple, title="", inline="MA-1", group="Leading Moving Average")
//useMa1Offset = input(defval=false, title="Use offset to MA-1", inline="MA1", group="Leading Moving Average")
ma1Offset = input.int(defval=0, title="Offset1 Steps", minval=0, maxval=10, step=1, tooltip="The Magic happens here! The offset to move the line to the right.", inline="MA-1", group="Leading Moving Average")
ma1 = MA(ma1Source, ma1Length, ma1Type)[ma1Offset]

ma2Color  = input(defval=color.lime, title="", inline="MA-2", group="Leading Moving Average")
//useMa2Offset = input(defval=true, title="Use offset to MA2", inline="MA-2", group="Leading Moving Average")
ma2Offset = input.int(defval=4, title="Offset2 Steps", minval=0, maxval=10, step=1, tooltip="The Magic happens here! The offset to move the line to the right.", inline="MA-2", group="Leading Moving Average")
ma2 = ma1[ma2Offset]

ma3Color  = input(defval=color.aqua, title="", inline="MA-3", group="Leading Moving Average")
//useMa3Offset = input(defval=false, title="Use offset to MA3", inline="MA-3", group="Leading Moving Average")
ma3Offset = input.int(defval=6, title="Offset3 Steps", minval=0, maxval=10, step=1, tooltip="The Magic happens here! The offset to move the line to the right.", inline="MA-3", group="Leading Moving Average")
ma3 = ma1[ma3Offset]

ma4Type = input.string(defval="SMA", title="", inline="MA4", options=["EMA", "HMA", "RMA", "SMA","SWMA", "VWMA", "WMA"], group="Lagging Moving Average") 
ma4Length = input.int(defval=22, title="",minval=1, inline="MA4", group="Lagging Moving Average")
ma4Source = input(defval=close, title="", inline="MA4", group="Lagging Moving Average")
ma4Color  = input(defval=color.yellow, title="", inline="MA-4", group="Lagging Moving Average")
//useMa4Offset = input(defval=true, title="Use offset to MA4", inline="MA-4", group="Lagging Moving Average")
ma4Offset = input.int(defval=2, title="Offset Steps", minval=0, maxval=10, step=1, tooltip="The Magic happens here! The offset to move the line to the right.", inline="MA-4", group="Lagging Moving Average")
ma4 = MA(ma4Source, ma4Length, ma4Type)[ma4Offset]

bandTransp = input.int(defval=60, title="Band Transparency", minval=20, maxval=80, step=10, group="Banding")
useBand1 = input(defval=true, title="Band 1", inline="Band", group="Banding")
band1Transp = useBand1 ? bandTransp : 100
band1clr = ma1 > ma2 ? color.new(#00ff00, transp=band1Transp) : color.new(#ff0000, transp=band1Transp)
useBand2 = input(defval=true, title="Band 2", inline="Band", group="Banding")
band2Transp = useBand2 ? bandTransp : 100
band2clr = ma1 > ma3 ? color.new(#00ff00, transp=band2Transp) : color.new(#ff0000, transp=band2Transp)
useBand3 = input(defval=true, title="Band 3", tooltip="Up trend green, down trend red. Colors get reversed if MA1 lenght is greater than MA2 lenght, or they are different type and MA2 quicker. In that case, just reverse your selections for MA1 and MA2, or let it be as is.", inline="Band", group="Banding")
band3Transp = useBand3 ? bandTransp : 100
band3clr = ma1 > ma4 ? color.new(#00ff00, transp=band3Transp) : color.new(#ff0000, transp=band3Transp)

//Graphs
piirto1 = plot(ma1, color = ma1Color, title="MA1")
piirto2 = plot(ma2, color = ma2Color, title="MA2")
piirto3 = plot(ma3, color = ma3Color, title="MA3")
piirto4 = plot(ma4, color = ma4Color, title="MA4")

fill(piirto1, piirto2, color=band1clr)
fill(piirto1, piirto3, color=band2clr)
fill(piirto1, piirto4, color=band3clr)

//Strategy entry and stop conditions

longCondition = riskLevel == "Highest" ? ma1Source > ma1 : riskLevel == "High" ? ma1Source > ma2 : riskLevel == "Medium" ? ma1Source > ma3 : riskLevel == "Low" ? ma1Source > ma4 : riskLevel == "Lowest" ? ma1 > ma2 and ma1 > ma3 and ma1 > ma4 : na
shortCondition = riskLevel == "Highest" ? ma1Source < ma1 : riskLevel == "High" ? ma1Source < ma2 : riskLevel == "Medium" ? ma1Source < ma3 : riskLevel == "Low" ? ma1Source < ma4 : riskLevel == "Lowest" ? ma1 < ma2 and ma1 < ma3 and ma1 < ma4 : na

stopLprice = useStop == true ? strategy.position_avg_price * (1-stopPrct) : na
stopSprice = useStop == true ? strategy.position_avg_price * (1+stopPrct) : na

if (longCondition)
    strategy.entry("Long",strategy.long)
    strategy.exit("Long Stop", "Long", stop=stopLprice)    
if (shortCondition)
    strategy.entry("Short",strategy.short)
    strategy.exit("Short Stop", "Short", stop=stopSprice)

//End