متعدد موونگ ایوریج گیپ دو طرفہ تجارتی حکمت عملی

جائزہ
اس حکمت عملی میں ولیمز کے نئے اعلی اور کم اشارے کا استعمال کیا گیا ہے جس میں فاریکس ٹریڈنگ کے لئے کثیر مساوی لائنوں کے ساتھ فریکچر ٹریڈنگ کے لئے فاریکس ٹریڈنگ کے لئے فاریکس ٹریڈنگ کے لئے فریکچر سگنل کی شناخت کی گئی ہے ، اور آر ایس آئی اشارے کے ذریعہ جعلی سگنلوں کو فلٹر کرنے کے لئے ایک موثر دو طرفہ تجارت کی اجازت دی گئی ہے۔
حکمت عملی کا اصول
-
ولیمز نیو ہائی اینڈ نیو لو انڈیکس ایک خاص دورانیے میں اعلی ترین اور کم ترین قیمتوں کا تعین کرتے ہوئے ، خریدنے اور فروخت کرنے کے سگنل جاری کرتا ہے۔
-
20 ، 50 اور 100 دن کی اوسط لائنیں ایک سے زیادہ اوسط لائنیں بناتی ہیں ، اور جب قیمت ان میں سے دو اوسط لائنوں کو توڑ دیتی ہے تو ، ایک تجارتی سگنل جاری کیا جاتا ہے۔
-
RSI اشارے اوورلوڈ اور اوورلوڈ علاقوں کا تعین کرنے کے لئے استعمال کیا جاتا ہے جو غیر یقینی اشارے کو فلٹر کرنے کے لئے استعمال کیا جاتا ہے.
-
حکمت عملی یہ فیصلہ کرتی ہے کہ کون سے دو اوسط لائنوں کو توڑنا ہے ، ولیمز اشارے کے اشارے اور آر ایس آئی فلٹرنگ کے ساتھ مل کر ، مستحکم خرید و فروخت کے اشارے پیدا کرتے ہیں۔
-
انٹری کا فیصلہ: جب قلیل مدتی اوسط نیچے سے اوپر کی طرف سے طویل مدتی اوسط سے ٹوٹ جاتا ہے اور ولیمز کے نئے کم اور RSI کم سگنل ایک ساتھ ہوتے ہیں تو ، زیادہ کام کریں۔ جب قلیل مدتی اوسط اوپر سے نیچے کی طرف سے طویل مدتی اوسط سے ٹوٹ جاتا ہے اور ولیمز کے نئے اعلی اور RSI اعلی سگنل ایک ساتھ ہوتے ہیں تو ، خالی کریں۔
-
سٹاپ نقصان سٹاپ: مقررہ تناسب سٹاپ نقصان سٹاپ مقرر کریں۔
اسٹریٹجک فوائد
-
ولیمز اشارے اہم حمایت مزاحمت کا درست اندازہ لگانے اور الٹ سگنل کی شناخت کرتا ہے۔
-
ایک سے زیادہ اوسط لائن ٹوٹنے کا فیصلہ ، ایک ہی اوسط لائن کے جھٹکے سے غلط سگنل سے بچنے کے لئے۔
-
RSI اشارے جعلی سگنلوں کو فلٹر کرنے میں معاون ہیں ، جس سے انٹری ٹائمنگ زیادہ درست اور قابل اعتماد ہے۔
-
فکسڈ اسٹاپ نقصان روکنے کا نظام خطرے کو کنٹرول کرتا ہے ، جس سے منافع اور نقصان زیادہ واضح ہوجاتا ہے۔
-
ریورس اشارے اور رجحان اشارے کی دوہری توثیق کے ساتھ مل کر ، ٹریڈنگ سگنل کو زیادہ درست اور قابل اعتماد بناتا ہے۔
اسٹریٹجک رسک
-
تجارتی قسم کا انتخاب غلط ہے ، مختلف قسم کے پیرامیٹرز کو ایڈجسٹ کرنے کی ضرورت ہے۔
-
سائیکل کا انتخاب غیر معقول ہے ، مختلف سائیکلوں کے لئے پیرامیٹرز کو ایڈجسٹ کرنے کی ضرورت ہے۔
-
فکسڈ اسٹاپ نقصان کی روک تھام مارکیٹ کی تبدیلیوں کے مطابق ایڈجسٹ نہیں کی جاسکتی ہے ، اور اس کی روک تھام بہت جلد یا ناکافی ہوسکتی ہے۔
-
اوسط لکیری ہلچل غلط سگنل پیدا کرنے کے لئے آسان ہے.
-
اشارے کی ترسیل کے وقت سگنل میں تاخیر ہوتی ہے۔
حکمت عملی کی اصلاح کی سمت
-
مختلف ٹرانزیکشن اقسام کے مطابق متحرک اصلاح کے پیرامیٹرز <unk>
-
خود کار طریقے سے ایڈجسٹمنٹ سٹاپ نقصان کی روک تھام کے نظام کو شامل کرنے کے لئے، منافع کو زیادہ معقول بنانے کے لئے.
-
غلط سگنل کو کم کرنے کے لئے مزید اشارے فلٹرز جیسے MACD ، Stochastic وغیرہ شامل کریں۔
-
مشین سیکھنے کے الگورتھم کو شامل کریں جو خود بخود بہترین تجارتی اوقات کی نشاندہی کرے۔
-
رجحانات کے بارے میں مزید معلومات کے ساتھ رجحانات کی نشاندہی کرنے والے اشارے۔
خلاصہ کریں۔
اس حکمت عملی میں متعدد تکنیکی تجزیہ ٹولز جیسے ولیمز اشارے ، اوسط اشارے اور آر ایس آئی اشارے کا استعمال کیا گیا ہے ، جس میں غلط سگنل کو کم کرنے کے لئے دوہری تصدیق کی گئی ہے ، جس سے واپسی کے مواقع کو مؤثر طریقے سے پکڑا جاسکتا ہے ، اور اسٹریپ اسٹاپ کنٹرول کے خطرات کے ساتھ کام کیا جاتا ہے۔ مجموعی طور پر ، یہ ایک قابل اعتماد اور عملی دو طرفہ تجارتی حکمت عملی ہے۔ اگلے مرحلے میں پیرامیٹرز کی اصلاح ، اسٹاپ نقصان کی اصلاح اور ماڈل انضمام جیسے طریقوں سے حکمت عملی کی تاثیر کو مزید بڑھانا ہے۔
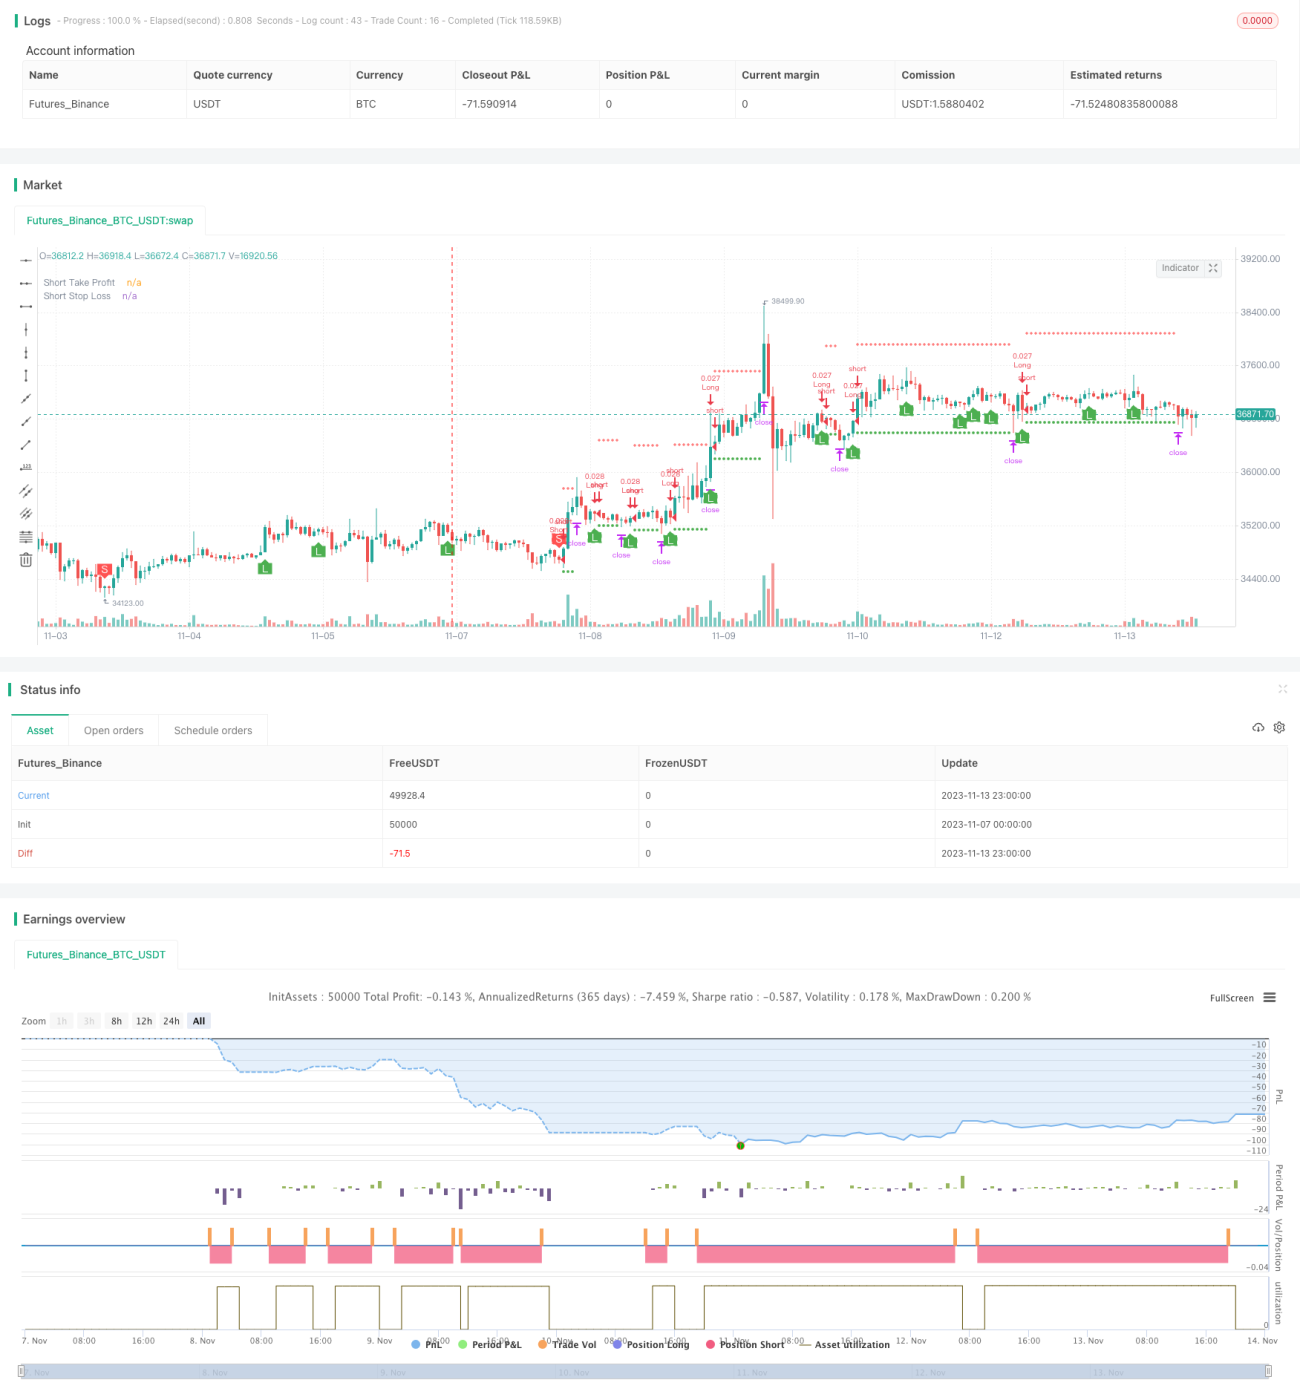
/*backtest
start: 2023-11-07 00:00:00
end: 2023-11-14 00:00:00
period: 1h
basePeriod: 15m
exchanges: [{"eid":"Futures_Binance","currency":"BTC_USDT"}]
*/

// This source code is subject to the terms of the Mozilla Public License 2.0 at https://mozilla.org/MPL/2.0/
// © B_L_A_C_K_S_C_O_R_P_I_O_N
// v 1.1
- 1