
اس حکمت عملی پر مبنی سپر مضبوط اشاریہ فلیٹ منتقل اوسط اور نسبتا مضبوط اشاریہ، ڈیزائن کیا گیا ہے ڈبل رجحان ٹریکنگ کے طریقہ کار، درست طریقے سے رجحان کا تعین کر سکتے ہیں، اور ایک مناسب سٹاپ نقصان روکنے کے نقطہ مقرر. حکمت عملی سٹاپ نقصان کے ساتھ رجحان کی پیروی کی، سٹاپ نقصان کے مطابق سٹاپ نقصان اور ڈبل رجحان کا تعین کرنے کی خصوصیات ہے، انفرادی تجارت کے خطرے کو مؤثر طریقے سے کنٹرول کر سکتے ہیں، رجحان کی صورت حال میں سپر مضبوط آمدنی حاصل.
سپر ٹرینڈ انڈیکس سستے منتقل اوسط کا حساب لگائیں ، اہم رجحانات کی سمت کا تعین کریں۔ سپر ٹرینڈ انڈیکس سستے منتقل اوسط رجحانات کی سمت کا درست اندازہ لگانے اور مثالی داخلہ نقطہ فراہم کرنے کے قابل ہے۔
نسبتا strong مضبوط انڈیکس ((آر ایس آئی) کا حساب لگائیں ، جو رجحانات کا اندازہ لگانے میں معاون ہے۔ آر ایس آئی کی اونچائی میں اوور بائڈ زون ہوتا ہے ، جو بیل مارکیٹ کا رجحان ظاہر کرتا ہے۔ جب آر ایس آئی کی اونچائی میں اوور سیل زون ہوتا ہے ، تو یہ بیر مارکیٹ کا رجحان ظاہر کرتا ہے۔
جب بند ہونے والی قیمت سپر پاور انڈیکس فلیٹ مووینگ ایوریج سے تجاوز کر جائے تو اس سے زیادہ رقم کمائی جائے۔ جب بند ہونے والی قیمت سپر پاور انڈیکس فلیٹ مووینگ ایوریج سے نیچے آجائے تو اس سے کم رقم کمائی جائے۔
معقول طور پر اسٹاپ نقصان کا تعین کریں۔ جب زیادہ کام کیا جائے تو ، معقول منافع کو روکنے کے لئے انتہائی مضبوط اشاریہ کی ہموار حرکت پذیر اوسط کے ساتھ معقول منافع کو روکنے کے لئے انتہائی مضبوط اشاریہ کی ہموار حرکت پذیر اوسط کا استعمال کریں۔ جب خالی ہو تو ، معقول منافع کو روکنے کے لئے انتہائی مضبوط اشاریہ کی ہموار حرکت پذیر اوسط کا استعمال کریں۔
اسٹاپ نقصان کا نقطہ اس کے ساتھ ساتھ حرکت پذیر ہوتا ہے۔ اگر تجارت فائدہ مند سمت میں چلتی ہے تو ، اسٹاپ نقصان کی لکیر فائدہ مند سمت میں منتقل ہوتی ہے ، جس سے منافع کو یقینی بنایا جاتا ہے۔
جب RSI سپر مضبوط اشاریہ کے ساتھ ہموار حرکت پذیر اوسط کی سمت سے مطابقت رکھتا ہے تو ، اس کا مطلب یہ ہے کہ اس وقت رجحان مضبوط ہے ، اس وقت حکمت عملی کھیل میں داخل ہوگی۔ جب RSI سپر مضبوط اشاریہ کے ساتھ ہموار حرکت پذیر اوسط کی سمت سے متضاد ہے تو ، اس کا مطلب یہ ہے کہ رجحان کا رخ موڑنے کا امکان ہے ، اس وقت حکمت عملی عارضی طور پر باہر نکل جاتی ہے۔
ڈبل رجحانات کے فیصلے کا طریقہ کار غلط سگنل کو کم کرنے اور حکمت عملی کی استحکام کو بڑھانے میں مدد کرتا ہے۔
سٹاپ نقصان نقطہ رجحان کے ساتھ چلتا ہے، زیادہ سے زیادہ منافع کو لاک کرنے کے لئے، بہت جلد نقصان کو روکنے سے بچنے کے لئے.
RSI اشارے کا استعمال کرتے ہوئے، آپ کو کچھ کمزور ٹریڈنگ سگنل کو فلٹر کر سکتے ہیں.
منافع کو زیادہ سے زیادہ کرنے کے لئے معقول طور پر اسٹاپ پوزیشن کا تعین کریں۔
حکمت عملی کے پیرامیٹرز کو ایڈجسٹ کیا جاسکتا ہے اور مختلف اقسام اور حالات کی خصوصیات کے مطابق بہتر بنایا جاسکتا ہے۔
حکمت عملی کی واپسی کو کنٹرول کیا جاسکتا ہے ، اور اس میں خطرے کے انتظام کی مضبوط صلاحیت ہے۔
اگر کسی اچانک واقعے کا سامنا کرنا پڑتا ہے ، جیسے اہم پالیسی کی خبریں ، مارکیٹ میں شدید اتار چڑھاؤ ہوسکتا ہے ، جس کی وجہ سے روک تھام کی حد کو توڑ دیا جاتا ہے ، جس سے زیادہ نقصان ہوتا ہے۔ روک تھام کی حد کو مناسب طریقے سے نرمی دی جاسکتی ہے ، یا کسی بڑے خطرے سے متعلق واقعے سے پہلے وقت پر باہر نکل سکتے ہیں۔
پیرامیٹرز کی غلط ترتیب ، جس کی وجہ سے اسٹاپ نقصان کی روک تھام کی غیر معقول ترتیب ہوسکتی ہے ، نقصان کو بڑھا سکتی ہے یا منافع کو کم کرسکتی ہے۔ بار بار جانچ پڑتال کے ذریعے بہترین پیرامیٹرز کا مجموعہ تلاش کیا جاسکتا ہے۔
کثیر فضائیہ کے اختلاط کے مرحلے میں ، آر ایس آئی اور سپر پاور انڈیکس کی ہموار حرکت پذیر اوسط سے کچھ انحراف ہوسکتا ہے ، جس کی وجہ سے حکمت عملی غلط تجارتی سگنل پیدا کرتی ہے۔ اس وقت ، آپ عارضی طور پر تجارت سے باز رہ سکتے ہیں ، اور واضح رجحانات کے آنے کا انتظار کر سکتے ہیں۔
اے ٹی آر سائیکل پیرامیٹرز کو بہتر بنائیں تاکہ یہ مختلف اقسام کی خصوصیات کے مطابق ہو۔
RSI پیرامیٹرز کی ترتیبات کو بہتر بنانے کے لئے ، زیادہ مستحکم اور قابل اعتماد معاون رجحانات کے فیصلے کے لئے شرائط تلاش کریں۔
دوسرے اشارے کے ساتھ مل کر ، جیسے برین بینڈ ، کے ڈی جے ، وغیرہ ، زیادہ درست انٹری اور آؤٹ بیس کی بنیاد طے کریں۔
منافع کی سطح کو بہتر بنانے کے لئے مختلف اسٹاپ اسٹاپ حکمت عملیوں کی جانچ کریں ، جیسے ٹریک اسٹاپ ، سیڑھی اسٹاپ ، شیڈ لائن اسٹاپ وغیرہ۔
واپسی کے نتائج کے مطابق پوزیشن مینجمنٹ کی حکمت عملی کو ایڈجسٹ کریں ، تاکہ ایک ہی تجارت کا خطرہ کم ہو۔
اس حکمت عملی میں مجموعی طور پر مضبوط استحکام اور مستقل منافع بخش صلاحیت ہے۔ ڈبل ٹرینڈ فیصلے کا طریقہ کار شور کو مؤثر طریقے سے فلٹر کرسکتا ہے ، نقصان کو روکنے کی حکمت عملی منافع کو مقفل کرسکتی ہے اور خطرے کو کنٹرول کرسکتی ہے۔ پیرامیٹرز کی ترتیب اور داخلے اور باہر نکلنے کی شرائط کو مستقل طور پر بہتر بنانے سے ، حکمت عملی مختلف مارکیٹ کے ماحول میں اچھی کارکردگی کا مظاہرہ کرسکتی ہے۔ مجموعی طور پر ، یہ حکمت عملی کوانٹم ٹریڈنگ کے لئے ایک عمدہ حکمت عملی کے نمونہ کے طور پر کام کرسکتی ہے ، جس پر توجہ دینے کے لئے تحقیق اور اطلاق کے قابل ہے۔
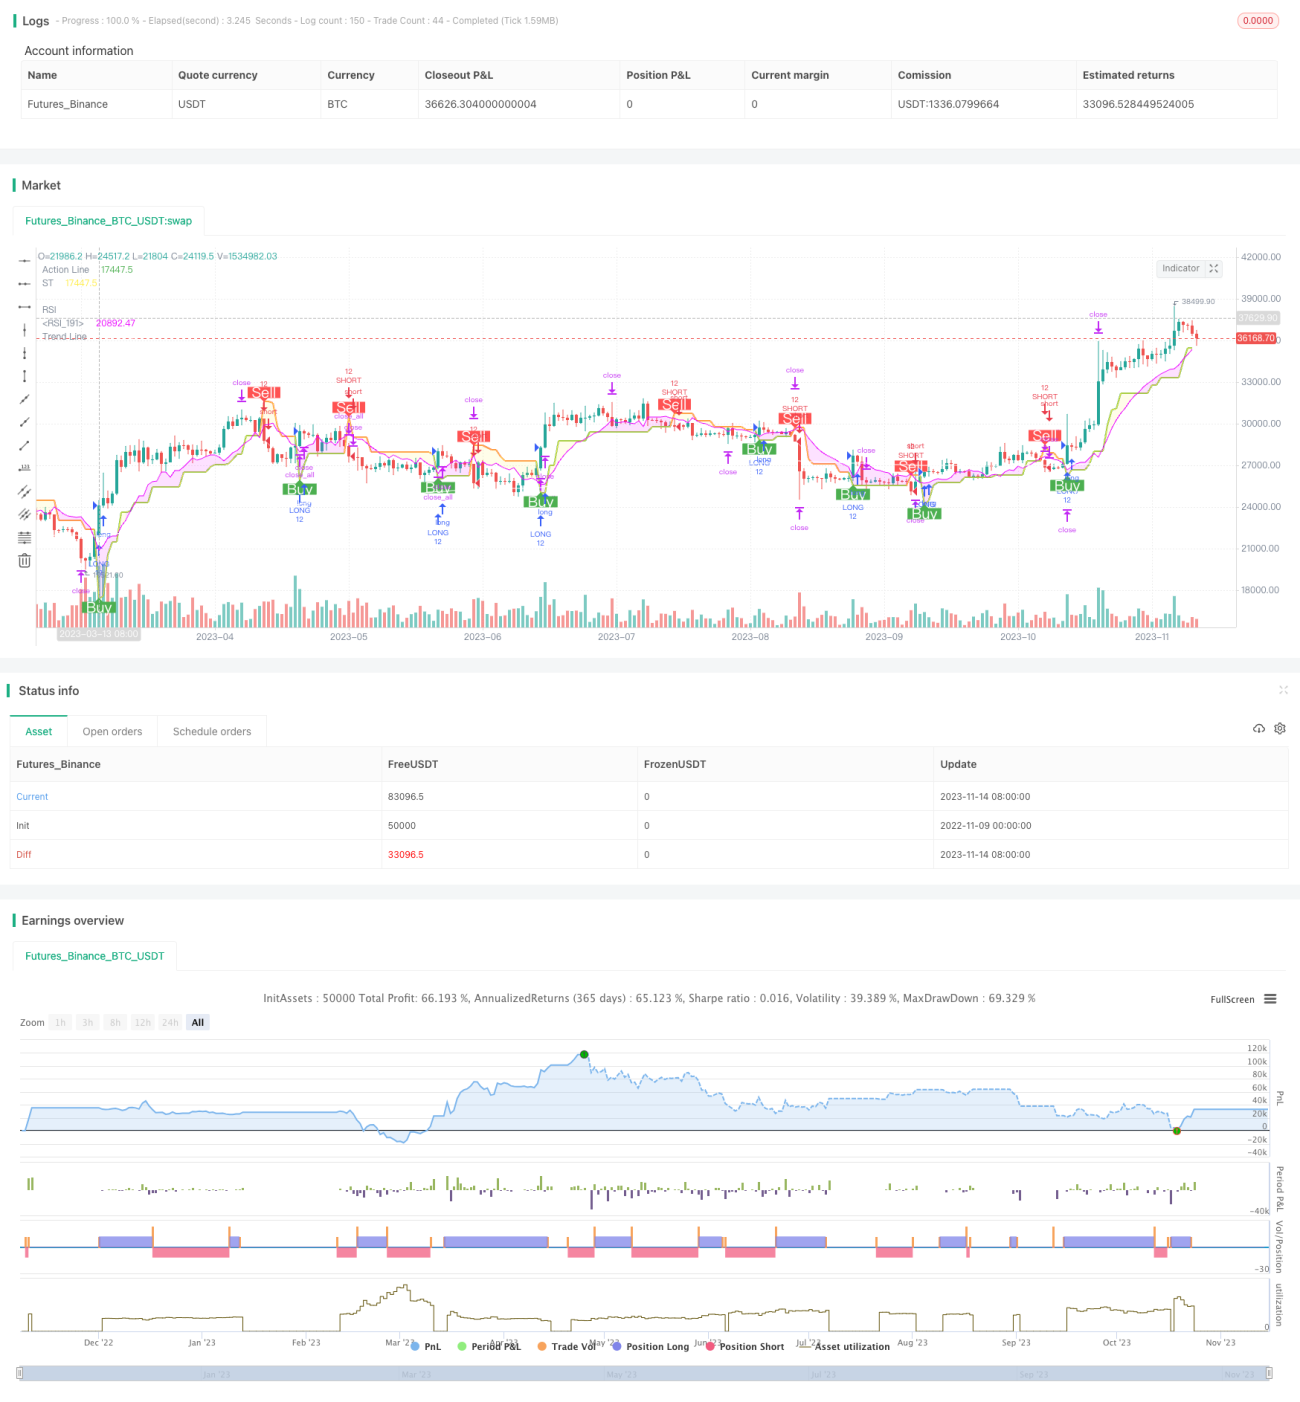
/*backtest
start: 2022-11-09 00:00:00
end: 2023-11-15 00:00:00
period: 1d
basePeriod: 1h
exchanges: [{"eid":"Futures_Binance","currency":"BTC_USDT"}]
*/
//@version=5
//
// ▒▒▒▒▒▒▒▒▒▒▒▒▒▒▒▒▒▒▒▒▒▒▒▒▒▒▒▒▒▒▒▒▒▒▒▒▒▒▒▒▒▒▒▒▒▒▒▒▒▒▒▒▒▒▒▒▒▒▒▒▒▒▒▒▒▒▒▒▒▒▒▒▒▒▒▒▒▒▒▒▒▒▒▒▒▒▒▒▒▒▒▒▒▒▒▒▒▒▒▒▒▒▒▒▒▒▒▒▒▒▒▒▒▒
// -----------------------------------------------------------------------------
// Copyright 2019 Mauricio Pimenta | exit490
// SuperTrend with Trailing Stop Loss script may be freely distributed under the MIT license.
//
// Permission is hereby granted, free of charge,
// to any person obtaining a copy of this software and associated documentation files (the "Software"),
// to deal in the Software without restriction, including without limitation the rights to use, copy, modify, merge,
// publish, distribute, sublicense, and/or sell copies of the Software, and to permit persons to whom the Software is furnished to do so,
// subject to the following conditions:
//
// The above copyright notice and this permission notice shall be included in all copies or substantial portions of the Software.
//
// THE SOFTWARE IS PROVIDED "AS IS", WITHOUT WARRANTY OF ANY KIND,
// EXPRESS OR IMPLIED, INCLUDING BUT NOT LIMITED TO THE WARRANTIES OF MERCHANTABILITY,
// FITNESS FOR A PARTICULAR PURPOSE AND NONINFRINGEMENT. IN NO EVENT SHALL THE AUTHORS OR COPYRIGHT HOLDERS BE LIABLE FOR ANY CLAIM,
// DAMAGES OR OTHER LIABILITY, WHETHER IN AN ACTION OF CONTRACT, TORT OR OTHERWISE, ARISING FROM,
// OUT OF OR IN CONNECTION WITH THE SOFTWARE OR THE USE OR OTHER DEALINGS IN THE SOFTWARE.
//
// -----------------------------------------------------------------------------
//
// Authors: @exit490
// Revision: v1.0.0
// Date: 5-Aug-2019
//
// Description
// ===========
// SuperTrend is a moving stop and reversal line based on the volatility (ATR).
// The strategy will ride up your stop loss when price moviment 1%.
// The strategy will close your operation when the market price crossed the stop loss.
// The strategy will close operation when the line based on the volatility will crossed
//
// The strategy has the following parameters:
//
// INITIAL STOP LOSS - Where can isert the value to first stop.
// POSITION TYPE - Where can to select trade position.
// ATR PERIOD - To select number of bars back to execute calculation
// ATR MULTPLIER - To add a multplier factor on volatility
// BACKTEST PERIOD - To select range.
//
// -----------------------------------------------------------------------------
// Disclaimer:
// 1. I am not licensed financial advisors or broker dealers. I do not tell you
// when or what to buy or sell. I developed this software which enables you
// execute manual or automated trades multplierFactoriplierFactoriple trades using TradingView. The
// software allows you to set the criteria you want for entering and exiting
// trades.
// 2. Do not trade with money you cannot afford to lose.
// 3. I do not guarantee consistent profits or that anyone can make money with no
// effort. And I am not selling the holy grail.
// 4. Every system can have winning and losing streaks.
// 5. Money management plays a large role in the results of your trading. For
// example: lot size, account size, broker leverage, and broker margin call
// rules all have an effect on results. Also, your Take Profit and Stop Loss
// settings for individual pair trades and for overall account equity have a
// major impact on results. If you are new to trading and do not understand
// these items, then I recommend you seek education materials to further your
// knowledge.
//
// YOU NEED TO FIND AND USE THE TRADING SYSTEM THAT WORKS BEST FOR YOU AND YOUR
// TRADING TOLERANCE.
//
// I HAVE PROVIDED NOTHING MORE THAN A TOOL WITH OPTIONS FOR YOU TO TRADE WITH THIS PROGRAM ON TRADINGVIEW.
//
// I accept suggestions to improve the script.
// If you encounter any problems I will be happy to share with me.
// -----------------------------------------------------------------------------
//
// ▒▒▒▒▒▒▒▒▒▒▒▒▒▒▒▒▒▒▒▒▒▒▒▒▒▒▒▒▒▒▒▒▒▒▒▒▒▒▒▒▒▒▒▒▒▒▒▒▒▒▒▒▒▒▒▒▒▒▒▒▒▒▒▒▒▒▒▒▒▒▒▒▒▒▒▒▒▒▒▒▒▒▒▒▒▒▒▒▒▒▒▒▒▒▒▒▒▒▒▒▒▒▒▒▒▒▒▒▒▒▒▒▒▒ //
strategy(title='DEO SESSSION', shorttitle='DEO S', overlay=true, precision=8, calc_on_order_fills=true, calc_on_every_tick=true, backtest_fill_limits_assumption=0, default_qty_type=strategy.percent_of_equity, default_qty_value=100, initial_capital=1000, currency=currency.USD, linktoseries=true)
//
// ▒▒▒▒▒▒▒▒▒▒▒▒▒▒▒▒▒▒▒▒▒▒▒▒▒▒▒▒▒▒▒▒▒▒▒▒▒▒▒▒▒▒▒▒▒▒▒▒▒▒▒▒▒▒▒▒▒▒▒▒▒▒▒▒▒▒▒▒▒▒▒▒▒▒▒▒▒▒▒▒▒▒▒▒▒▒▒▒▒▒▒▒▒▒▒▒▒▒▒▒▒▒▒▒▒▒▒▒▒▒▒▒▒▒ //
// === BACKTEST RANGE ===
backTestSectionFrom = input(title='════════════ FROM ════════════', defval=true)
// selected dates
i_startTime = input(title="START FILTER", defval=timestamp("02 Jan 2023 00:00 +0000"), group="RISK MANAGEMENT", tooltip="Start date & time to begin searching for setups")
i_endTime = input(title="END FILTER", defval=timestamp("12 Dec 2100 00:00 +0000"), group="RISK MANAGEMENT", tooltip="End date & time to stop searching for setups")
afterStartDate = true
//
// ▒▒▒▒▒▒▒▒▒▒▒▒▒▒▒▒▒▒▒▒▒▒▒▒▒▒▒▒▒▒▒▒▒▒▒▒▒▒▒▒▒▒▒▒▒▒▒▒▒▒▒▒▒▒▒▒▒▒▒▒▒▒▒▒▒▒▒▒▒▒▒▒▒▒▒▒▒▒▒▒▒▒▒▒▒▒▒▒▒▒▒▒▒▒▒▒▒▒▒▒▒▒▒▒▒▒▒▒▒▒▒▒▒▒ //
parameterSection = input(title='══════════ STRATEGY ══════════', defval=true)
// === INPUT TO SELECT POSITION ===
positionType = input.string(defval='LONG', title='Position Type', options=['LONG', 'SHORT'])
// === INPUT TO SELECT INITIAL STOP LOSS
initialStopLossPercent = input.float(defval=3.0, minval=0.0, title='Initial Stop Loss')
// === INPUT TO SELECT BARS BACK
barsBack = input(title='ATR Period', defval=1)
// === INPUT TO SELECT MULTPLIER FACTOR
multplierFactor = input.float(title='ATR multplierFactoriplier', step=0.1, defval=3.0)
RSI = input.int(title='RSI', defval=7, minval=1, maxval=100)
calcSection = input(title='══════════ LOT CALC ══════════', defval=true)
accountBalance = input.float(title="ACCOUNT BALANCE", defval=250000, minval=1, group="INPUTS")
entryPrice = input.float(title="ENTRY PRICE", defval=100, minval=1, group="INPUTS")
slPrice = input.float(title="STOP LOSS PRICE", defval=100, minval=1, group="INPUTS")
riskPer = input.float(title="RISK USD", defval=1, minval=0.1, group="INPUTS")
lotSize = input.float(title="LOT SIZE", defval=10, minval=0.1, group="INPUTS")
RiskSize = riskPer
qtyLongTargetPrice = math.abs((RiskSize / ((entryPrice - slPrice) * syminfo.pointvalue)) / lotSize)
trendcSection = input(title='══════════ TREND LINE ══════════', defval=true)
// ema trend
tLen = input.int(200, minval=1, title="Trend Line")
tSrc = input(close, title="Source")
thisEma = ta.ema(tSrc, tLen)
plot(thisEma, title = "Trend Line",color=#ffffff)
MTSection = input(title='══════════ MT LOGIN ══════════', defval=true)
exchange = input.string(defval='MT5', title='EXCHANGE', options=['MT4', 'MT5'])
mtLogin= input.string(defval="", title='MT LOGIN', group = "mt")
mtPassword =input.string(defval='', title='MT PASSWORD', group = "mt")
mtServer =input.string(defval='', title='MT SERVER', group = "mt")
mtIsOn = input.string(defval='ON', title='STRATEGY ON', options=['ON', 'OFF'])
mtEntryMode = input.string(defval='CLOSE OPEN', title='ENTRY MODE', options=['CLOSE OPEN', 'OPEN'])
displaySection = input(title='══════════ DISPLAY LOGIN ══════════', defval=true)
displayTable = input(title="DISPLAY TABLE", defval=false, group = 'PRODUCTION', tooltip = "MAKES YOUR STRATEGY TRIGGER SLOWER")
//
// ▒▒▒▒▒▒▒▒▒▒▒▒▒▒▒▒▒▒▒▒▒▒▒▒▒▒▒▒▒▒▒▒▒▒▒▒▒▒▒▒▒▒▒▒▒▒▒▒▒▒▒▒▒▒▒▒▒▒▒▒▒▒▒▒▒▒▒▒▒▒▒▒▒▒▒▒▒▒▒▒▒▒▒▒▒▒▒▒▒▒▒▒▒▒▒▒▒▒▒▒▒▒▒▒▒▒▒▒▒▒▒▒▒▒ //
// LOGIC TO FIND DIRECTION WHEN THERE IS TREND CHANGE ACCORDING VOLATILITY
atr = multplierFactor * ta.atr(barsBack)
longStop = hl2 - atr
longStopPrev = nz(longStop[1], longStop)
longStop := close[1] > longStopPrev ? math.max(longStop, longStopPrev) : longStop
shortStop = hl2 + atr
shortStopPrev = nz(shortStop[1], shortStop)
shortStop := close[1] < shortStopPrev ? math.min(shortStop, shortStopPrev) : shortStop
direction = 1
direction := nz(direction[1], direction)
direction := direction == -1 and close > shortStopPrev ? 1 : direction == 1 and close < longStopPrev ? -1 : direction
longColor = color.blue
shortColor = color.blue
var valueToPlot = 0.0
var colorToPlot = color.white
if direction == 1
valueToPlot := longStop
colorToPlot := color.green
colorToPlot
else
valueToPlot := shortStop
colorToPlot := color.red
colorToPlot
//RSI
src = close
ep = 2 * RSI - 1
auc = ta.ema(math.max(src - src[1], 0), ep)
adc = ta.ema(math.max(src[1] - src, 0), ep)
x1 = (RSI - 1) * (adc * 70 / (100 - 70) - auc)
ub = x1 >= 0 ? src + x1 : src + x1 * (100 - 70) / 70
x2 = (RSI - 1) * (adc * 30 / (100 - 30) - auc)
lb = x2 >= 0 ? src + x2 : src + x2 * (100 - 30) / 30
//Affichage
plot(math.avg(ub, lb), color=color.white ,linewidth=1, title='RSI')
plot(valueToPlot == 0.0 ? na : valueToPlot, title='Action Line', linewidth=2, color=color.new(colorToPlot, 0))
plotshape(direction == 1 and direction[1] == -1 ? longStop : na, title='Buy', style=shape.labelup, location=location.absolute, size=size.normal, text='Buy', textcolor=color.new(color.white, 0), color=color.new(color.green, 0))
plotshape(direction == -1 and direction[1] == 1 ? shortStop : na, title='Sell', style=shape.labeldown, location=location.absolute, size=size.normal, text='Sell', textcolor=color.new(color.white, 0), color=color.new(color.red, 0))
p_ma1 = plot(valueToPlot, title = "ST", color = color.rgb(255, 236, 66))
p_ma2 = plot(math.avg(ub, lb), title = "RSI", color = color.rgb(234, 0, 255))
// Definitions: Trends
TrendUp1() =>
valueToPlot > math.avg(ub, lb)
TrendDown1() =>
valueToPlot < math.avg(ub, lb)
trendColor1 = TrendUp1() ? color.rgb(255, 236, 66, 85): TrendDown1() ? color.rgb(234, 0, 255, 85) : color.rgb(255, 255, 255, 85)
fill(p_ma1, p_ma2, color=trendColor1)
longCondition () =>
ta.crossover(close, valueToPlot)
shortCondition () =>
ta.crossunder(close, valueToPlot)
IsLongShort() =>
strategy.position_size != 0
getNewLotSize() =>
math.abs(riskPer / (close - valueToPlot))
// plot(getNewLotSize(), "new lot size")
newLotS = getNewLotSize()
alertManagement = str.tostring(exchange) + "," + str.tostring(mtLogin) + "," +str.tostring(mtPassword) + ","
alertManagement += str.tostring(mtServer) + "," + str.tostring(newLotS)
// alertManagement += str.tostring(stopLoss) + "," + str.tostring(applyingSL) + "," + str.tostring(applyTrailingStop) + ","
// alertManagement += str.tostring(exchange) + "," + str.tostring(exchangeAccount) + "," + str.tostring(slAmount) + "," + str.tostring(closeTpAmount) + ","
// alertManagement += str.tostring(exchangeLeverage) + "," + str.tostring(exchangeLeverageType) + ","
// alertManagement += str.tostring(mtLogin) + "," + str.tostring(mtPassword) + "," + str.tostring(mtServer) + "," + str.tostring(mtLot) + ","
// alertManagement += str.tostring(mtTp) + "," + str.tostring(mtTs) + "," + str.tostring(orderStrategy)
// alertManagement = "alertManagement"
myStop = 0.0
myTarget = 0.0
if (longCondition())
qtyLongTargetPrice := math.abs((RiskSize / ((close - valueToPlot) * syminfo.pointvalue)) / lotSize)
if IsLongShort()
strategy.close_all(comment = "close all entries")
strategy.entry("LONG", strategy.long, qty=12, comment="LONG", alert_message=alertManagement)
strategy.exit("TPL", "LONG", stop=valueToPlot, limit= close + (close - valueToPlot), comment="Target", alert_message=alertManagement)
if (shortCondition())
qtyLongTargetPrice := math.abs((RiskSize / ((close - valueToPlot) * syminfo.pointvalue)) / lotSize)
if IsLongShort()
strategy.close_all(comment = "close all entries")
strategy.entry("SHORT", strategy.short, qty=12, comment="SHORT", alert_message=alertManagement)
strategy.exit("TPS", "SHORT", stop=valueToPlot, limit= close + (close - valueToPlot), comment="Target", alert_message=alertManagement)
// Calculate the average profit per open trade
// avgProfit = profitSum / strategy.opentrades
getTotalProfit()=>
// Sum the profit of all open trades
profitSum = 0.0
for tradeNumber = 0 to strategy.closedtrades - 1
if strategy.closedtrades.profit(tradeNumber) > 0
profitSum += strategy.closedtrades.profit(tradeNumber)
result = profitSum
getTotalLoss()=>
// Sum the profit of all open trades
lossSum = 0.0
for tradeNumber = 0 to strategy.closedtrades - 1
if strategy.closedtrades.profit(tradeNumber) < 0
lossSum += strategy.closedtrades.profit(tradeNumber)
result = lossSum
maxLossRun()=>
lossRun = 0.0
currentMaxLoss = 0.0
for tradeNo = 0 to strategy.closedtrades - 1
if strategy.closedtrades.profit(tradeNo) < 0.0
lossRun += strategy.closedtrades.profit(tradeNo)
else
currentMaxLoss := math.min(currentMaxLoss, lossRun)
lossRun := 0.0
result = currentMaxLoss
TotalTrades() =>
strategy.closedtrades + strategy.opentrades
maxDrawDown() =>
maxDrawdown = 0.0
for tradeNo = 0 to strategy.closedtrades - 1
maxDrawdown := math.max(maxDrawdown, strategy.closedtrades.max_drawdown(tradeNo))
result = maxDrawdown
maxRunUp() =>
maxRunup = 0.0
for tradeNo = 0 to strategy.closedtrades - 1
maxRunup := math.max(maxRunup, strategy.closedtrades.max_runup(tradeNo))
result = maxRunup
tradeMaxLossReached() =>
maxLoss = 0.0
for tradeNo = 0 to strategy.closedtrades - 1
maxLoss := math.min(maxLoss, strategy.closedtrades.profit(tradeNo))
result = maxLoss
tradingStartTime() =>
strategy.closedtrades.entry_time(0)
daysBetween(t1, t2) => (t1 - t2) / 86400000
// Table
var InfoPanel = table.new(position = position.bottom_right, columns = 2, rows = 40, border_width = 1)
ftable(_table_id, _column, _row, _text, _bgcolor) =>
table.cell(_table_id, _column, _row, _text, 0, 0, color.black, text.align_right, text.align_center, size.small, _bgcolor)
tfString(int timeInMs) =>
// @function Produces a string corresponding to the input time in days, hours, and minutes.
// @param (series int) A time value in milliseconds to be converted to a string variable.
// @returns (string) A string variable reflecting the amount of time from the input time.
float s = timeInMs / 100000
float m = s / 60
float h = m / 60
float d = h / 24
float mo = d / 30.416
int tm = math.floor(m % 60)
int tr = math.floor(h % 24)
int td = math.floor(d % 30.416)
int tmo = math.floor(mo % 12)
int ys = math.floor(d / 365)
string result =
switch
d == 30 and tr == 10 and tm == 30 => "1M"
d == 7 and tr == 0 and tm == 0 => "1W"
=>
string yStr = ys ? str.tostring(ys) + "Y " : ""
string moStr = tmo ? str.tostring(tmo) + "M " : ""
string dStr = td ? str.tostring(td) + "D " : ""
string hStr = tr ? str.tostring(tr) + "H " : ""
string mStr = tm ? str.tostring(tm) + "min" : ""
yStr + moStr + dStr + hStr + mStr
if displayTable
maxLossRunInMarket= maxLossRun()
maxLossReached = tradeMaxLossReached()
tradeMaxLossReached = tradeMaxLossReached()
tradingInDays=daysBetween(time, tradingStartTime())
totalTrades=TotalTrades()