چاندنی ٹریکر ڈبل مثلث بریک آؤٹ حکمت عملی

جائزہ
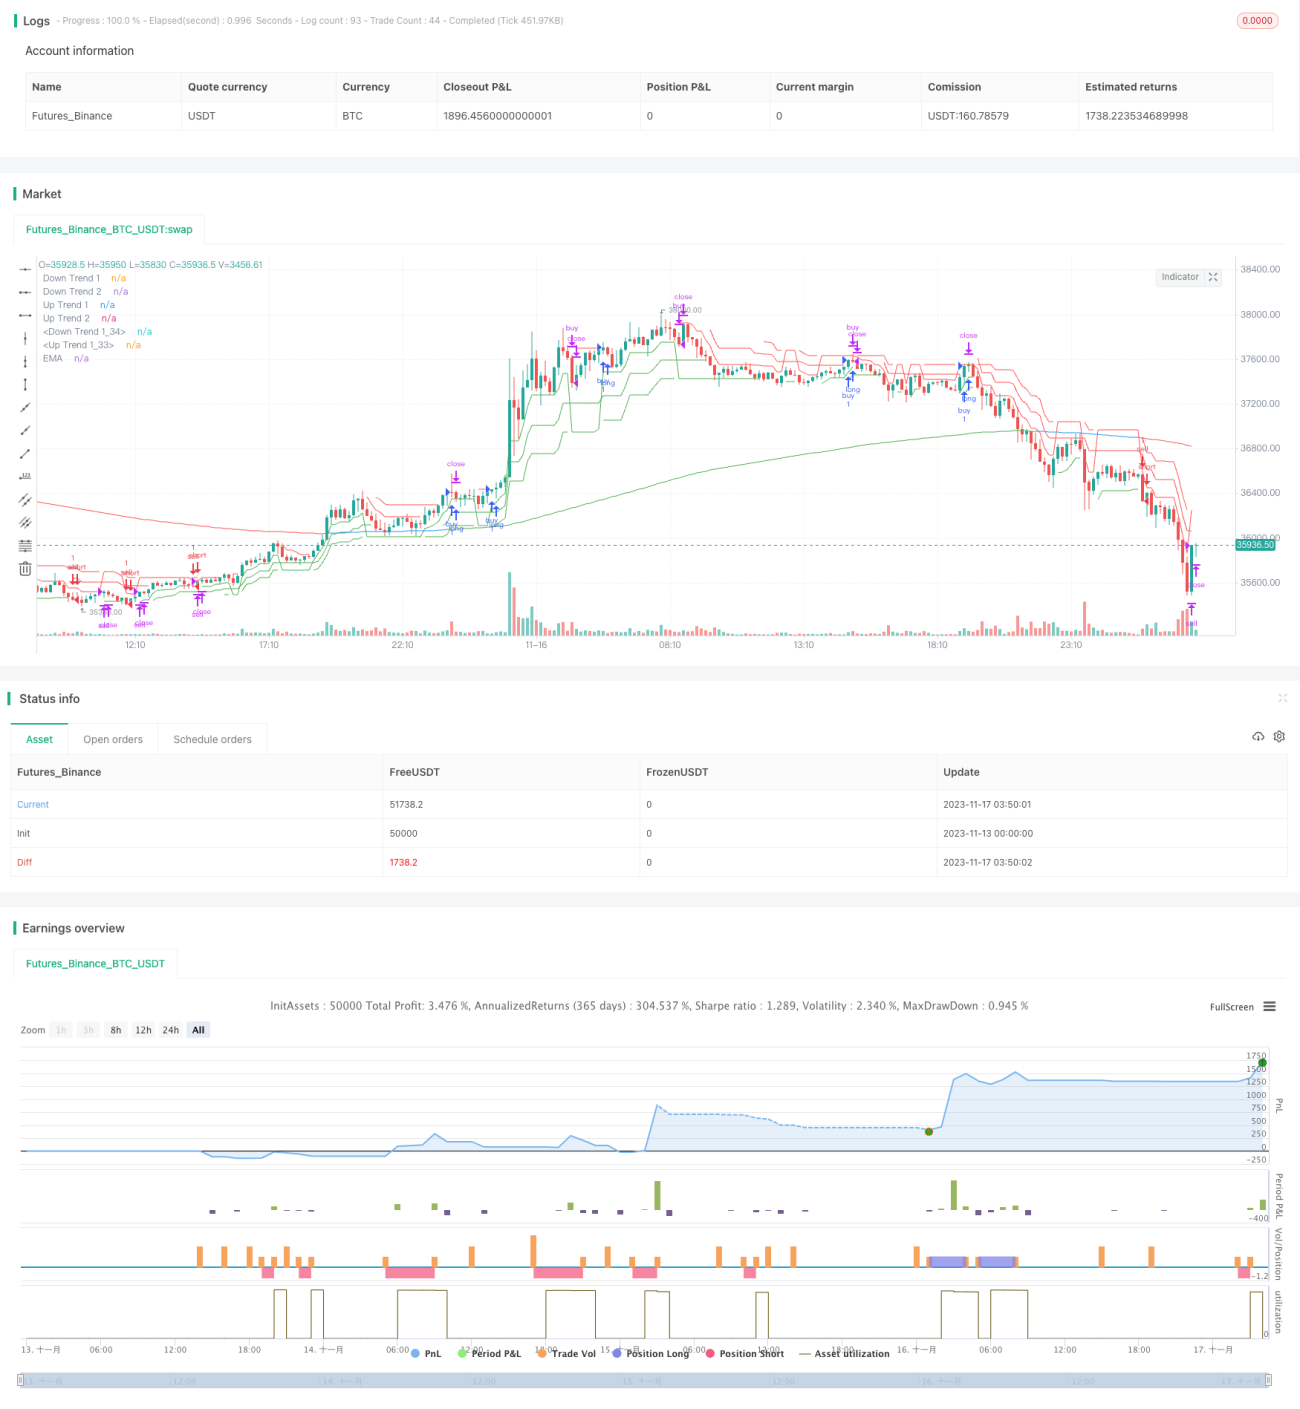
یہ حکمت عملی ایک دو طرفہ مثلث چینل کی تعمیر کے ذریعہ ایک اعلی جیت کی ٹریکنگ بریک آپریشن کو حاصل کرتی ہے ، جس میں سپر ٹرینڈ اشارے کے ساتھ مل کر قیمتوں کے ٹوٹنے کی سمت کا تعین کیا جاتا ہے۔ یہ حکمت عملی ای ایم اے کے ساتھ مل کر مارکیٹ کے مجموعی رجحانات کا تعین کرتی ہے ، تاکہ ہلچل کے حالات میں غیر موثر تجارت سے بچا جاسکے۔
حکمت عملی کا اصول
-
قیمتوں کے مختصر ، درمیانی اور طویل مدتی رجحان کی سمت کا تعین کرنے کے لئے تین مختلف پیرامیٹرز کے ساتھ ایک سپر ٹرینڈ اشارے کی تعمیر کریں۔
-
لسٹ انٹری اور ایگزٹ سگنل کے طور پر ڈبل ٹرنگل چینل کا استعمال کرتے ہوئے یہ فیصلہ کریں کہ آیا قیمت اوپر کی طرف بڑھ رہی ہے یا نیچے کی طرف بڑھ رہی ہے۔
-
ای ایم اے کے 233 ادوار کے ساتھ مل کر مجموعی رجحان کی سمت کا تعین کرنے کے لئے ، قیمتوں کو ای ایم اے کثیر سر مارکیٹ کو توڑنے کے لئے ایک اضافی راستہ بنانے کی ضرورت ہے ، اور خالی سر مارکیٹ کو توڑنے کے لئے ایک خالی راستہ بنانے کی ضرورت ہے۔
-
تین سپر ٹرینڈ اشارے کے ساتھ مل کر اسٹاپ اور اسٹاپ سگنل کا فیصلہ کریں۔ جب دو سے زیادہ اشارے رنگ بدل جاتے ہیں تو اسٹاپ یا اسٹاپ کو بند کردیں۔
اسٹریٹجک فوائد
-
ڈبل ٹرنگل چینل ایک سے زیادہ ٹائم سائیکل کے فیصلے کے ساتھ مل کر ، رجحانات کی توڑ کو درست طریقے سے پکڑ سکتا ہے۔
-
ایک سے زیادہ سطحوں کے ساتھ ، آپ کو زیادہ سے زیادہ جیت کی شرح حاصل کرنے کے لئے غیر فعال تجارت سے بچنے کے لئے.
-
متحرک ٹریکنگ سٹاپ نقصان کو روکنے کے لئے، واپسی کے خطرے کو کم کرنے کے لئے
-
سادہ پیرامیٹرز کی ترتیب، استعمال کرنے کے لئے آسان.
حکمت عملی کے خطرات اور اصلاحات
-
بڑے دورانیے کے جھٹکے والی مارکیٹ میں اکثر پوزیشن کھولنے اور پھر اس کی روک تھام کی صورت حال ہوسکتی ہے۔ پوزیشن کھولنے کی تعدد کو کم کرنے کے لئے اے ٹی آر سائیکل پیرامیٹرز کو مناسب طریقے سے ایڈجسٹ کیا جاسکتا ہے۔
-
ای ایم اے کا دورانیہ بہت مختصر ہے ، مجموعی رجحان کا اندازہ نہیں لگایا جاسکتا ہے ، اور طویل عرصے سے اس کا سراغ لگانا غیر حساس ہے۔ ای ایم اے کے بہترین پیرامیٹرز کی نشاندہی کرنے کے لئے ٹیسٹ کی سفارش کی گئی ہے۔
-
اسٹاپ نقصان کی سطح مارکیٹ میں اتار چڑھاؤ کی شدت میں تبدیلی کو متحرک طور پر ٹریک نہیں کرسکتی ہے ، جس میں انسانی مداخلت کی ضرورت ہوتی ہے۔ بعد میں ، اسٹاپ نقصان کی دوری کو اے ٹی آر کے متحرک ایڈجسٹمنٹ کے ساتھ مل کر غور کیا جاسکتا ہے۔
خلاصہ کریں۔
سپر ٹرینڈ اشارے اور ڈبل مثلث چینل کے امتزاج کے ذریعہ ، چاند کی روشنی کا سراغ لگانے والا ڈبل مثلث توڑنے کی حکمت عملی مضبوط توڑنے کی درست گرفت کو حاصل کرتی ہے۔ اس کے ساتھ ہی ، ایک کثیر درجے کی فلٹرنگ میکانزم غیر موثر سگنل کو فلٹر کرسکتا ہے ، جس کی اعلی کامیابی ہے۔ آسان پیرامیٹرز کی ترتیب بھی اس کے استعمال کو آسان بناتی ہے۔ بوسٹر پیرامیٹرز اور اسٹاپ نقصان کے ڈیزائن کو بہتر بنانے کے ذریعے حکمت عملی کی ٹریکنگ کی تاثیر اور خطرے سے متعلق قابو میں مزید اضافہ کیا جاسکتا ہے۔
- 1