ڈبل موونگ ایوریج کراس اوور ریورسل حکمت عملی

1
Follow
1779
Followers
جائزہ
اس حکمت عملی کا بنیادی خیال یہ ہے کہ تیزی سے چلنے والی اوسط لائن اور آہستہ چلنے والی اوسط لائن کے کراس کا استعمال کرکے مارکیٹ کے رجحانات کا اندازہ لگایا جائے ، اور مختصر اور لمبی اوسط لائن میں الٹ ہونے پر کھیل میں داخل ہوں ، تاکہ رجحانات کی پیروی کی جاسکے۔
حکمت عملی کا اصول
- سیٹ کریں تیز رفتار حرکت پذیر اوسط مدت shortma ((7 دن پہلے سے طے شدہ) اور سست رفتار حرکت پذیر اوسط مدت longma ((77 دن پہلے سے طے شدہ)
- جب مختصر لائن اوسط لائن پر لمبی لائن کو پار کرتی ہے تو اسے خریدنے کا اشارہ سمجھا جاتا ہے ، جس میں بارسنسن (mabuy) ریکارڈ کیا جاتا ہے ، اور لمبی لائن کا مطلب رجحان میں داخل ہونا ہے۔ جب مختصر لائن اوسط لائن کے نیچے لمبی لائن کو پار کرتی ہے تو اسے فروخت کرنے کا اشارہ سمجھا جاتا ہے ، جس میں بارسنسن (masell) ریکارڈ کیا جاتا ہے ، جس میں لمبی لائن کا مطلب رجحان کا اختتام ہوتا ہے۔
- بارسینس کی مقدار کا موازنہ کریں ، مختصر اوسط لائنیں جو اوپر سے نیچے کی طرف سے ٹرانسمیشن کرتی ہیں اس کی تعداد میں بارز کا مطلب ہے کہ رجحان طویل عرصے تک جاری رہتا ہے۔ اس کے برعکس ، مختصر اوسط لائنیں جو نیچے سے اوپر کی طرف سے ٹرانسمیشن کرتی ہیں ان کی تعداد میں بارز کا مطلب ہے کہ الٹ سگنل زیادہ مضبوط ہوتا ہے۔
- خریدنے کا اشارہ اس وقت جاری کیا جاتا ہے جب بیچنے والے سگنل کی بار کی تعداد خریدنے والے سگنل کی بار کی تعداد سے زیادہ ہو۔ جب خریدنے والے سگنل کی بار کی تعداد بیچنے والے سگنل کی بار کی تعداد سے زیادہ ہو۔
- ایسی حکمت عملی جو بنیادی طور پر دوہری اوسط کی الٹ حکمت عملی ہے ، جس میں تیزی سے اوسط اور سست اوسط کے الٹ کے ذریعہ رجحان کا رخ موڑنے کا فیصلہ کیا جاتا ہے
اسٹریٹجک فوائد
- ڈبل مساوی فیصلے کا استعمال کرتے ہوئے ، تجارتی اشارے کے کچھ شور کو فلٹر کیا گیا
- بارسینس موازنہ میں اضافہ ، غلط سگنل کو روکنے سے روکتا ہے جس کی وجہ سے فرضی اور قریبی قیمتوں میں ردوبدل ہوتا ہے
- سمجھنے اور عمل کرنے میں آسان
- اپنی مرضی کے مطابق منتقل اوسط پیرامیٹرز مختلف ادوار اور مارکیٹوں کے لئے
اسٹریٹجک رسک
- ڈبل ایک لائن حکمت عملی زیادہ سگنل پیدا کرنے کے لئے آسان ہے، تجارت اکثر ہوتی ہے
- غلط طور پر منتقل اوسط پیرامیٹرز کی ترتیب طویل تر رجحان کے مواقع سے محروم ہوسکتی ہے
- جب طویل مدتی اوسط سے تجاوز کیا جاتا ہے تو ، رکنے کا نقطہ بہت دور ہوسکتا ہے ، اور اس میں ایک بڑی واپسی ہوتی ہے
- مارکیٹس کو فلٹر کرنے میں ناکامی
حکمت عملی کی اصلاح کی سمت
- زلزلے کی صورت حال میں پھنسنے سے بچنے کے لئے دیگر اشارے پر فلٹر شامل کریں
- نقصان کی روک تھام میں اضافہ
- متحرک اوسط پیرامیٹرز کے مجموعے کو بہتر بنائیں
- متحرک اوسط پیرامیٹرز جو مارکیٹ کے دورانیہ کی نقل و حرکت کے مطابق ہیں
خلاصہ کریں۔
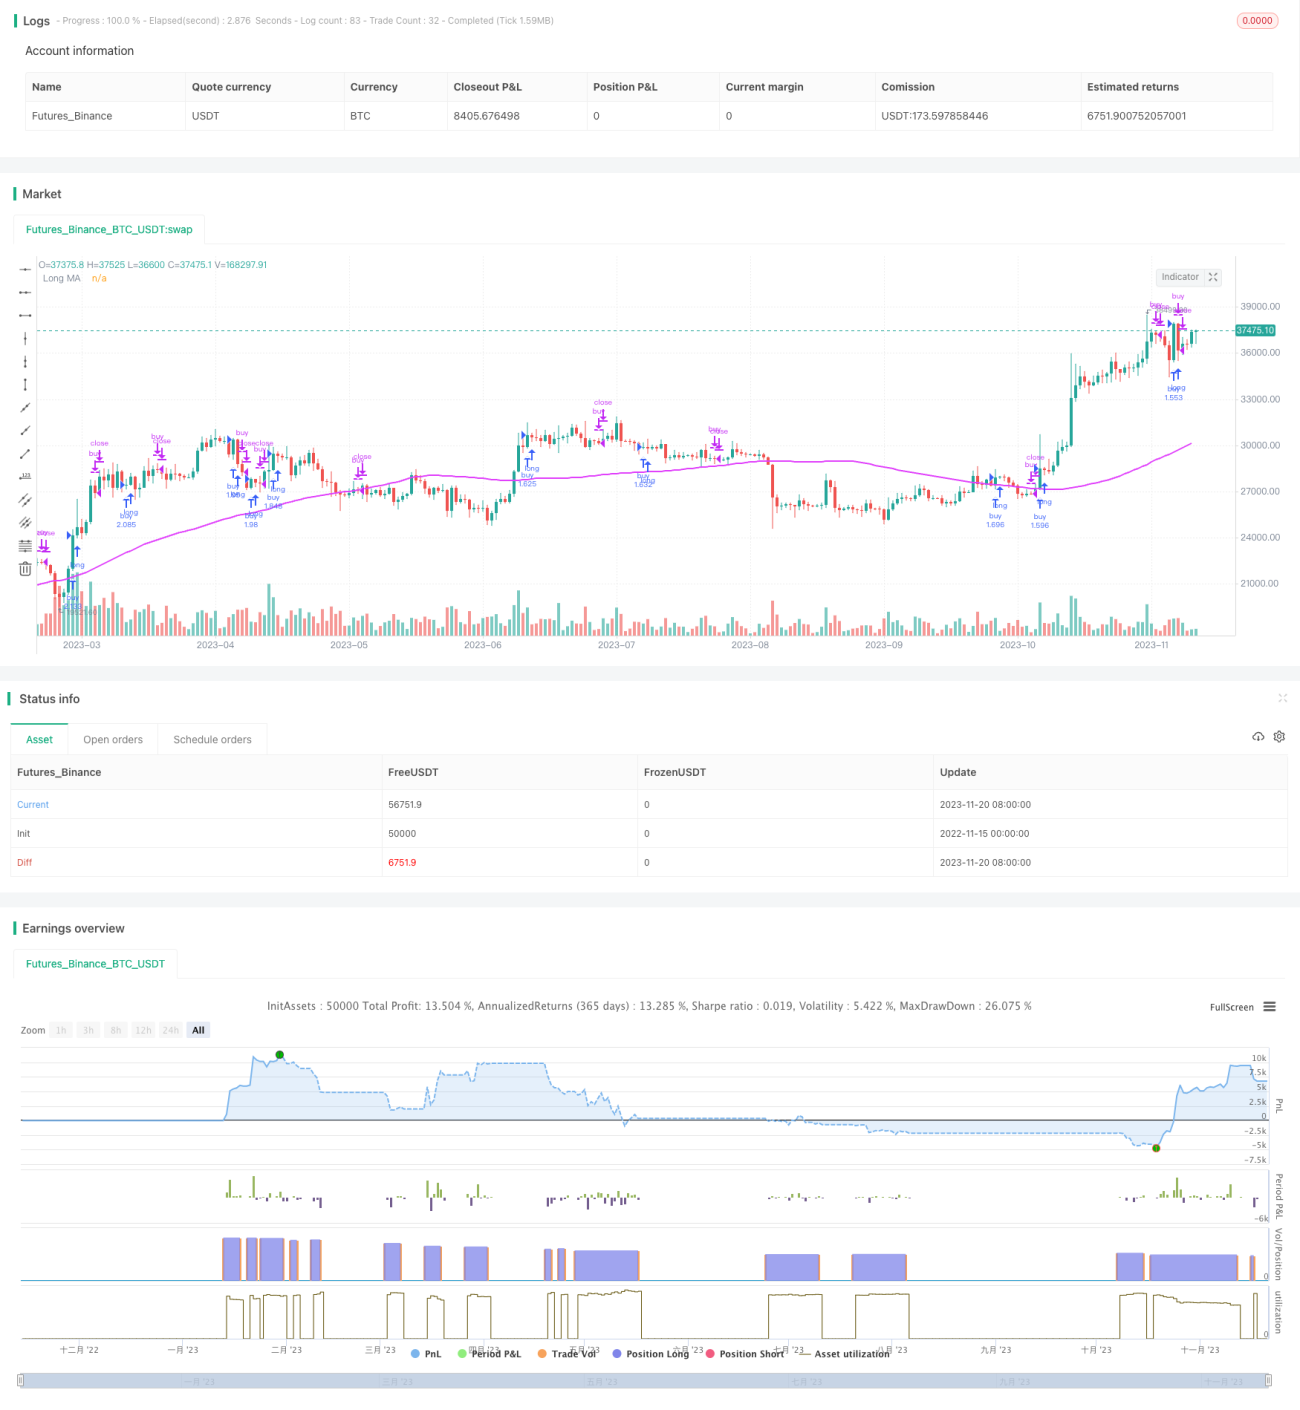
یہ حکمت عملی مجموعی طور پر منطقی طور پر واضح اور سمجھنے میں آسان ہے ، مارکیٹ کے رجحان کے موڑ کے نقطہ کو تیزی سے اوسط اور سست اوسط الٹ کے ذریعے فیصلہ کیا جاتا ہے۔ یہ نظریاتی طور پر رجحانات کی موثر پیروی کرنے کے قابل ہے۔ لیکن عملی استعمال میں حکمت عملی کے الگورتھم کے ساتھ ساتھ پیرامیٹرز کی ترتیب کو بہتر بنانے کی ضرورت ہے تاکہ اسے زیادہ مستحکم اور عملی بنایا جاسکے۔
Source
Pine
/*backtest
start: 2022-11-15 00:00:00
end: 2023-11-21 00:00:00
period: 1d
basePeriod: 1h
exchanges: [{"eid":"Futures_Binance","currency":"BTC_USDT"}]
*/

//@version=3
strategy("Up Down", "Up Down", precision = 6, pyramiding = 1, default_qty_type = strategy.percent_of_equity, default_qty_value = 99, commission_type = strategy.commission.percent, commission_value = 0.0, initial_capital = 1000, overlay = true)

buy = close > open and open > close[1]Strategy parameters
Related strategies
Comment
All comments (0)
No data
- 1