موونگ ایوریج کراس اوور حکمت عملی کے بعد دو طرفہ رجحان

1
Follow
1779
Followers
جائزہ
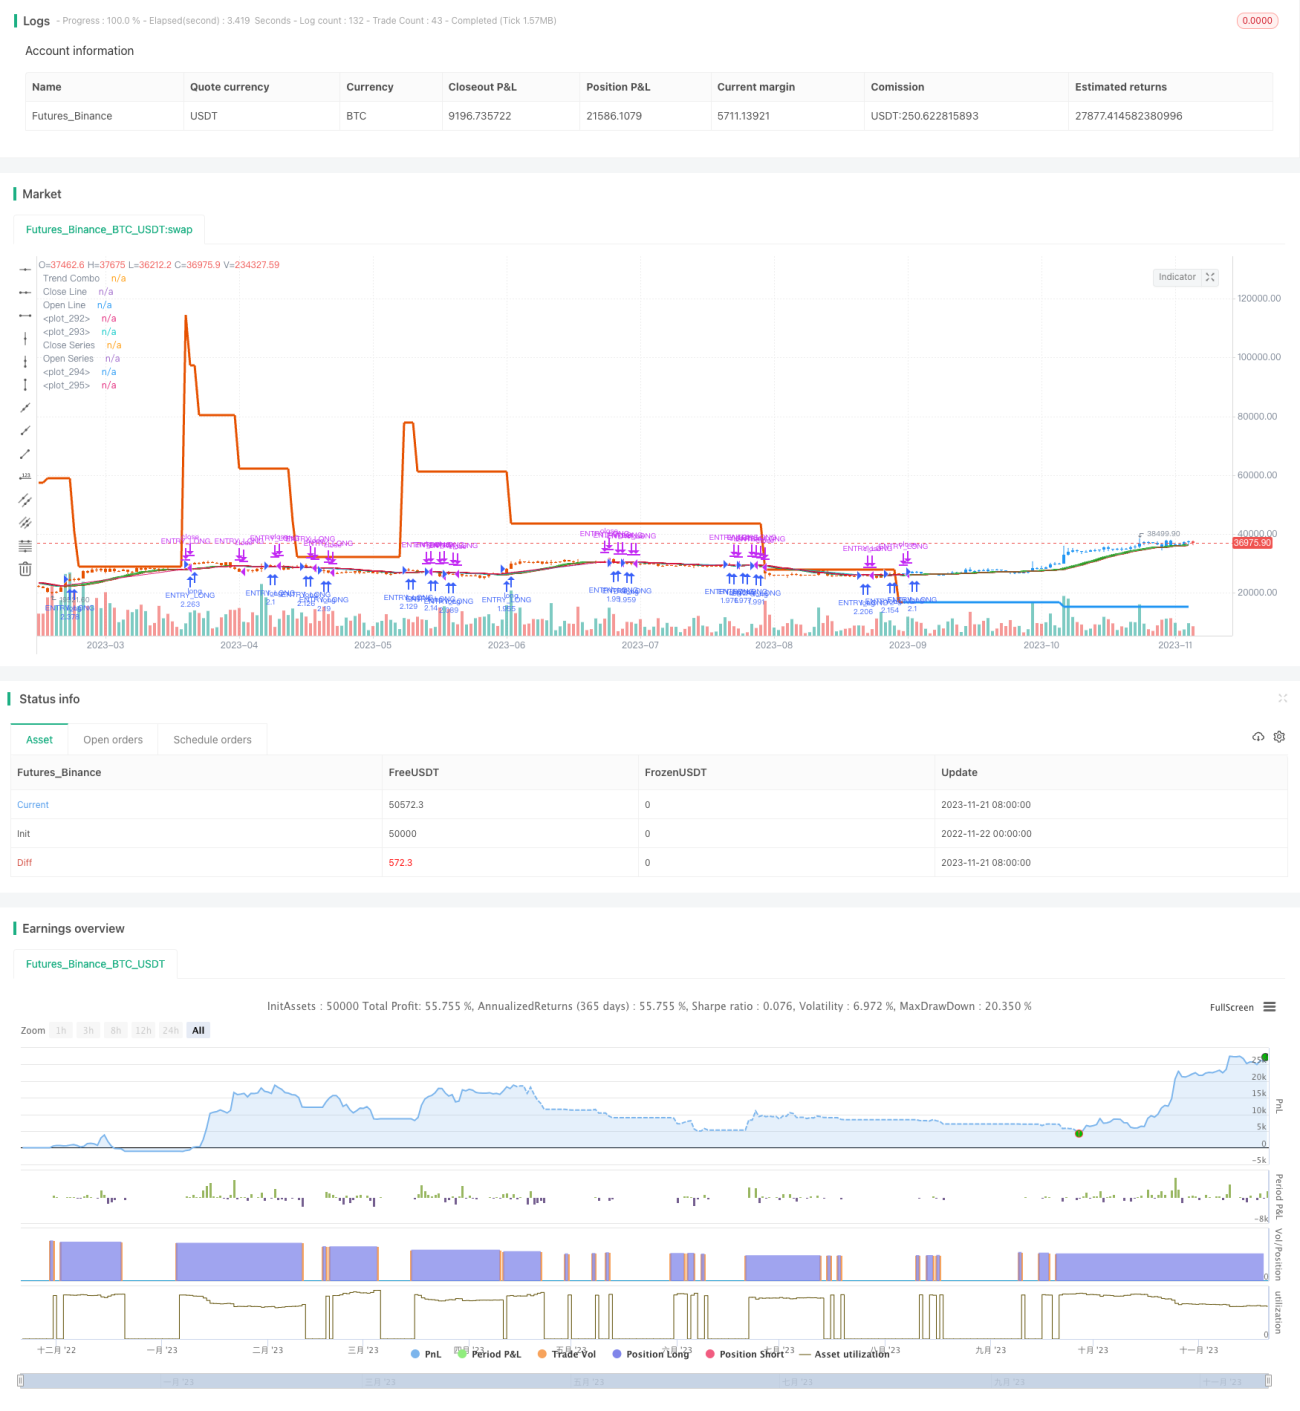
یہ حکمت عملی ایک کراس ٹریڈنگ حکمت عملی ہے جس میں قیمتوں کے رجحانات کو خود بخود ٹریک کرنے کے لئے رجحانات کے اشارے کے ساتھ مل کر دو طرفہ ہموار حرکت پذیر اوسط کا حساب لگایا جاتا ہے۔ اس حکمت عملی کا مقصد طویل مدتی رجحانات کی پیروی کرنا ہے تاکہ مضبوط رجحانات میں زیادہ سے زیادہ منافع حاصل کیا جاسکے۔
حکمت عملی کا اصول
- قیمتوں کی دو طرفہ ہموار منتقل اوسط کا حساب لگائیں ، بشمول اوسط قیمت اور اوسط قیمت۔
- قیمتوں کے رجحان کا اشارے متعلقہ فیکٹر اور اے ٹی آر اشارے کا استعمال کرتے ہوئے۔
- قیمتوں کے رجحان کے اشارے کو دو طرفہ منتقل اوسط کے ساتھ جوڑ کر ، ایک جامع رجحان کا فیصلہ کیا جاتا ہے۔
- جب اوپن قیمت اوسط اور اختتامی قیمت اوسط میں گولڈ فورک ہوتا ہے تو زیادہ بنائیں۔ جب ڈیڈ فورک ہوتا ہے تو فلیٹ پوزیشن۔
- ایک ہی وقت میں رجحان کے اشارے کے ساتھ مل کر ، صرف اس صورت میں پوزیشن کھولیں جب رجحان کے اشارے ایک ہی وقت میں زیادہ کام کریں ، اور صرف اس صورت میں پوزیشن کھولیں جب رجحان کے اشارے ایک ہی وقت میں خالی ہوں۔
اسٹریٹجک فوائد
- قیمتوں کے رجحانات کی پیروی کرنے والی دو طرفہ منتقل اوسط زیادہ ہموار اور مستحکم ہے۔
- رجحانات کے اشارے کے ساتھ مل کر ، آپ رجحانات کی سمت کا بہتر اندازہ لگاسکتے ہیں اور غلط تجارت سے بچ سکتے ہیں۔
- اس کے علاوہ ، یہ بھی کہا گیا ہے کہ اس کے نتیجے میں ، اس کے نتیجے میں ، اس کے نتیجے میں ، اس کے نتیجے میں ، اس کے نتیجے میں ، اس کے نتیجے میں ، اس کے نتیجے میں۔
- زیادہ سے زیادہ مارکیٹ کے حالات کے مطابق کرنے کے لئے پیرامیٹرز کی طرف سے ایڈجسٹ کر سکتے ہیں کی طرف سے منتخب کرنے کے لئے آزاد ہموار.
- ایک سے زیادہ اشارے ایک دوسرے کی توثیق کرتے ہیں، جعلی سگنل کو کم کرنے کے لئے
اسٹریٹجک رسک
- رجحان کے موڑ کے مقام پر الٹ جانے کا خطرہ۔ اس کو کم کرنے کے لئے آپ کو منتقل اوسط کی مدت کو ایڈجسٹ کرنا ہوگا۔
- دو طرفہ چلتی اوسط خود ہی زیادہ پسماندہ ہے اور اس کو رجحان کے اشارے کے ساتھ باہمی توثیق کی ضرورت ہے۔
- غلط حرکت پذیر اوسط کی چکر لگانے کی وجہ سے تجارت کی کثرت زیادہ ہوسکتی ہے یا تجارت کا اچھا وقت ضائع ہوسکتا ہے۔
- مختلف ادوار اور مارکیٹ کے حالات کو اپنانے کے لئے بار بار جانچ کی ضرورت ہے.
حکمت عملی کی اصلاح کی سمت
- مزید اقسام کے متحرک اوسط کی جانچ پڑتال کریں۔
- ٹرینڈ انڈیکیٹرز کی دیگر اقسام کو آزمائیں
- متحرک اوسط اور رجحان اشارے کے پیرامیٹرز کو بہتر بنائیں۔
- دوسرے اشارے کے ساتھ جوڑنے کی کوشش کریں ، جیسے اتار چڑھاؤ کی شرح۔
- نقصانات کو روکنے کی حکمت عملی میں اضافہ۔
خلاصہ کریں۔
یہ حکمت عملی قیمتوں کے رجحانات کو متعدد جہتوں سے پیش گوئی کرتی ہے ، اور پیرامیٹرز کو بہتر بنانے کے بعد لمبی لائن کے رجحانات کو مستحکم طور پر ٹریک کرسکتی ہے۔ تاہم ، ضرورت سے زیادہ اصلاح اور فٹنگ کو روکنے کے لئے احتیاط برتنی چاہئے۔ مجموعی طور پر ، اس حکمت عملی نے لمبی لائن کے رجحانات کی پیروی کو کم خطرہ کے ساتھ حاصل کیا ہے ، اور اس کی مزید تحقیق اور اطلاق کے قابل ہے۔
Source
Pine
Strategy parameters
Related strategies
Comment
All comments (0)
No data
- 1