
برن بینڈ توڑنے کی حکمت عملی ایک مختصر مدت کی رجحانات کی پیروی کرنے والی حکمت عملی ہے جو برن بینڈ اشارے پر مبنی ہے۔ یہ کثیر اور خالی دونوں سمتوں میں کام کرسکتا ہے ، جو نقد اور مستقل معاہدوں پر لاگو ہوتا ہے ، خاص طور پر رجحانات کے لئے۔
اس حکمت عملی میں انتہائی ترتیب دینے کی اہلیت ہے ، جس سے صارفین کو برین بینڈ پیرامیٹرز کی مدت اور انحراف ، رجحان فلٹر ، اتار چڑھاؤ فلٹر ، تجارت کی سمت فلٹر ، تبدیلی کی شرح فلٹر اور تاریخ فلٹر وغیرہ کو ترتیب دینے کی اجازت ملتی ہے۔ اس کے علاوہ ، یہ کثیر سر اور خالی سر پوزیشنوں کے لئے اسٹاپ نقصان ، اسٹاپ نقصان اور ٹریکنگ اسٹاپ نقصان کو بھی ترتیب دیتا ہے ، تاکہ خطرے کے انتظام کا ایک جامع طریقہ کار یقینی بنایا جاسکے۔ روزانہ سب سے زیادہ نقصانات کا اضافہ ایک اور پرت تحفظ فراہم کرتا ہے ، جس سے یہ ایک قابل اعتماد پیشہ ورانہ موافقت پذیر تجارتی نظام بن جاتا ہے۔
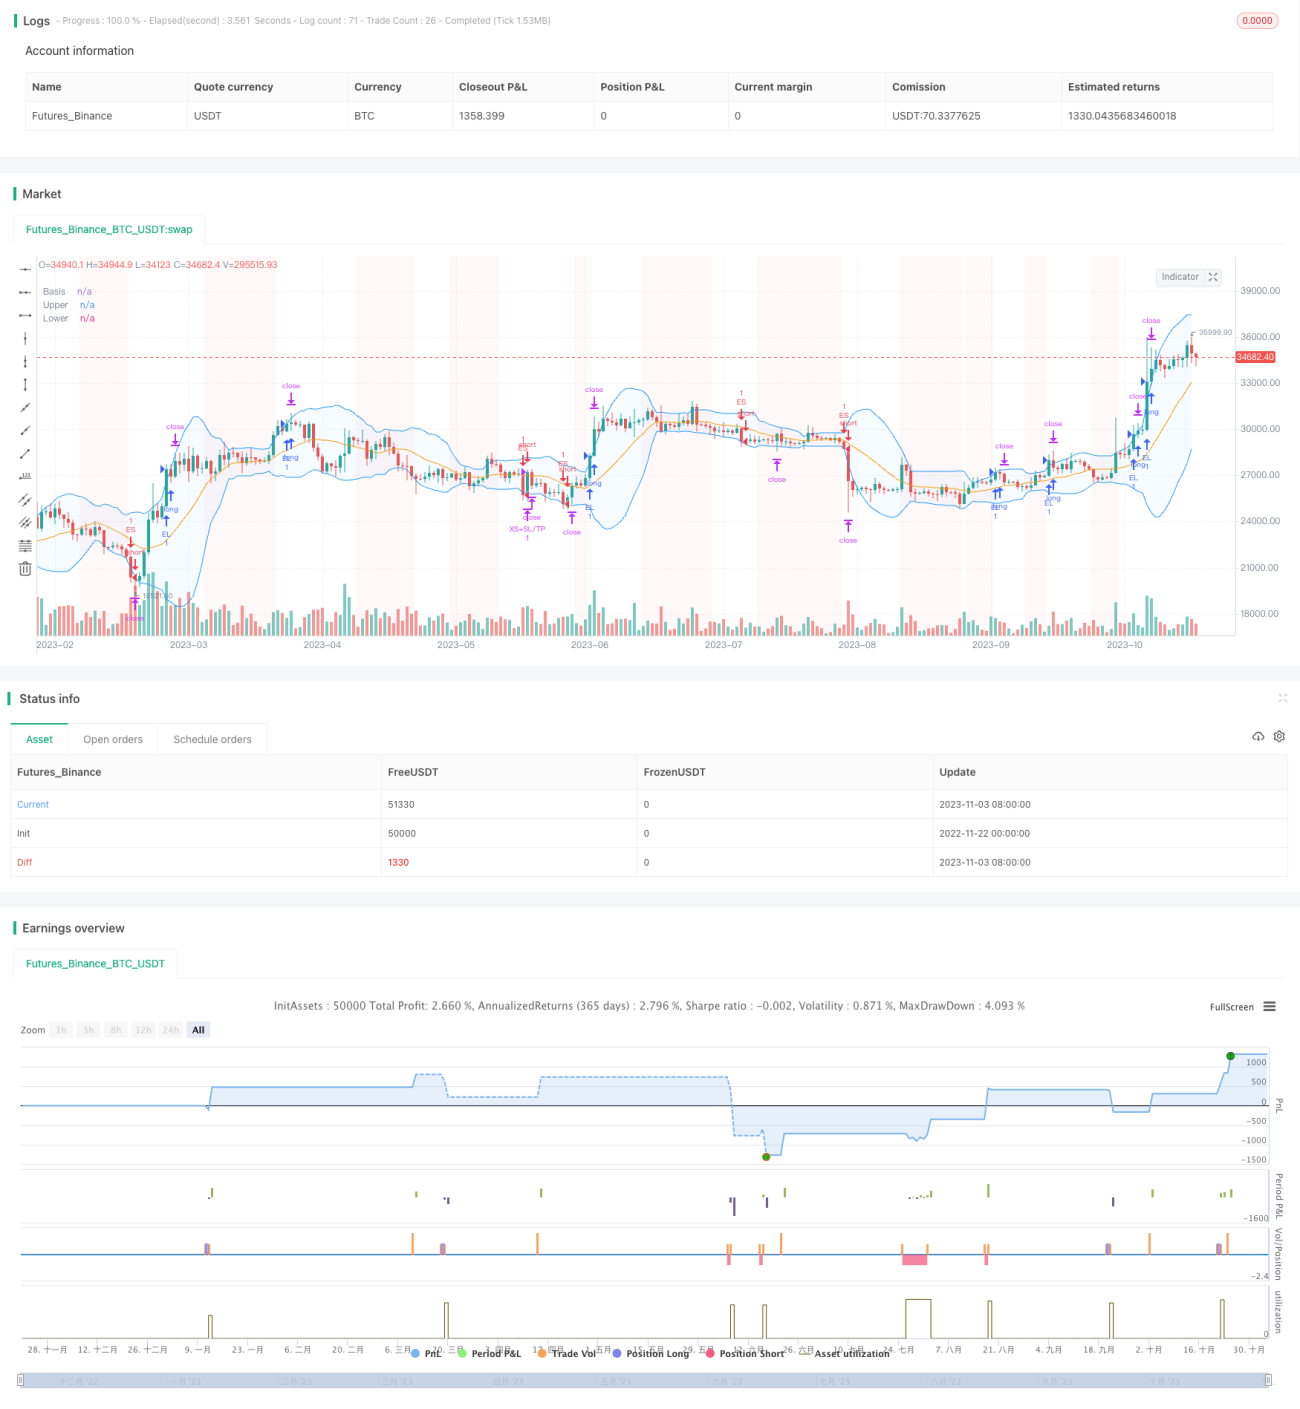
اس حکمت عملی کا بنیادی اشارے بلین بینڈ ہے۔ بلین بینڈ میں درمیانی ، اوپری اور نچلی تین لائنیں ہیں جو قیمت کی اوسط لائن ، اتار چڑھاؤ کی اوپری حد اور اتار چڑھاؤ کی نچلی حد کی نمائندگی کرتی ہیں۔ جب قیمت اوپر کی طرف بڑھتی ہے تو ، زیادہ کام کریں اور جب قیمت نیچے کی طرف بڑھتی ہے تو ، اس سے دور ہوجائیں۔
اس کے علاوہ، پالیسی میں متعدد معاون فلٹرز بھی شامل ہیں جو Noise ٹرانزیکشنز سے بچنے کے لئے استعمال کیے جاتے ہیں۔ ان میں شامل ہیں:
رجحان فلٹرز: قیمتوں میں بڑھتی ہوئی اوسط سے اوپر اور قیمتوں میں کم ہونے والی اوسط سے نیچے؛
اتار چڑھاؤ فلٹر: صرف اس وقت تجارت کریں جب اتار چڑھاؤ بڑھ جائے۔
ٹریڈنگ سمت فلٹر: صرف زیادہ ، صرف خالی یا دو طرفہ تجارت کا انتخاب کریں ، اس کی بنیاد پر کہ اس کی علامت کیا ہے۔
تبدیلی کی شرح فلٹر: جب قیمت پچھلے ٹریڈنگ دن کی اختتامی قیمت کے مقابلے میں تبدیلی کی شرح تک پہنچ جاتی ہے تو داخل ہوتا ہے۔
تاریخ فلٹر: پیمائش کے لئے ٹائم زون کی ترتیب
جب تمام فلٹرنگ کی شرائط پوری ہوجائیں تو تجارتی سگنل پیدا کریں۔ اسٹاپ ، اسٹاپ نقصان اور ٹریکنگ اسٹاپ نقصان خطرے کے انتظام کو یقینی بناتا ہے۔ اس کے علاوہ ، زیادہ سے زیادہ دن کے نقصان کی ترتیب ایک دن میں بڑے پیمانے پر واپسی سے بچنے کے لئے ہے۔
یہ حکمت عملی مندرجہ ذیل فوائد رکھتی ہے:
برین بینڈ کو بنیادی ٹریڈنگ سگنل کے طور پر استعمال کیا جاتا ہے اور اس میں بہت زیادہ اعتماد ہے۔
ایک سے زیادہ فلٹرز کے ساتھ ڈیزائن کیا گیا ہے تاکہ غلط ٹرانزیکشن سے بچا جاسکے ، اور اس کی تشکیل کی جاسکتی ہے۔
روک تھام، نقصانات کو روکنے اور ان کا سراغ لگانے کے لئے جامع اور لچکدار؛
زیادہ سے زیادہ ایک دن میں نقصان کی ترتیب ایک دن میں واپسی کو مؤثر طریقے سے کنٹرول کرتی ہے۔
ٹرینڈ مارکیٹ کے لئے موزوں ، آمدنی کا بہت زیادہ امکان۔
اس حکمت عملی میں کچھ خطرات بھی ہیں:
برن بیلٹ ٹوٹنے سے سر میں جھوٹا ٹوٹنا اور نیچے کا جھوٹا ٹوٹنا ہوتا ہے جس سے نقصان ہوسکتا ہے۔
اس کے علاوہ ، یہ بھی کہا گیا ہے کہ مارکیٹوں میں بہت سے لوگ ایسے ہیں جن کے پاس غیر ملکی کرنسیوں کی تجارت کرنے کا موقع نہیں ہے۔
بڑے پیمانے پر ہوائی اڈے کو براہ راست نقصان پہنچانے کے لئے روکنے کی لائن کو توڑنے کا خطرہ ہے؛
اس کے علاوہ ، یہ بھی کہا گیا ہے کہ اس طرح کے واقعات میں بہت زیادہ نقصانات سے بچا نہیں جا سکتا۔
مذکورہ بالا خطرات کے ل fil ، فلٹرنگ کے حالات کو مناسب طریقے سے نرمی دی جاسکتی ہے ، یا دستی مداخلت سے کچھ پوزیشنوں کو بند کیا جاسکتا ہے ، نقصان کو روکنے کا فاصلہ کم کیا جاسکتا ہے ، وغیرہ۔
اس حکمت عملی کو مندرجہ ذیل پہلوؤں سے بہتر بنانے پر غور کیا جا سکتا ہے:
مختلف پیرامیٹرز کے مجموعے کو آزمائیں اور بہترین پیرامیٹرز کی حد تلاش کریں؛
مشین لرننگ ماڈل شامل کریں تاکہ پیرامیٹرز کو متحرک طور پر بہتر بنایا جاسکے۔
زیادہ مؤثر طریقے سے نقصانات کو روکنے کے لئے، جیسے وقت نقصانات، amplitude نقصانات، وغیرہ؛
جذبات کے اشارے کے ساتھ مل کر ، انتہا پسندی کے معاملات میں فعال مداخلت کرنا۔
متعلقہ مصنوعات کے ساتھ مل کر، اعداد و شمار کے ارورٹائزنگ.
برن بینڈ توڑنے کی حکمت عملی ایک اچھی طرح سے قائم اور قابل اعتماد شارٹ لائن ٹرینڈ فالو کرنے کی حکمت عملی ہے۔ اس میں برن بینڈ اشارے کو سگنل کے طور پر استعمال کیا جاتا ہے اور متعدد فلٹرز کو سیٹ کیا جاتا ہے تاکہ سگنل کی وشوسنییتا کو یقینی بنایا جاسکے۔ اس کے ساتھ ہی ، ایک جامع اسٹاپ لاس اور رسک کنٹرول میکانزم خطرے کو کنٹرول کرتا ہے۔ یہ حکمت عملی متحرک رجحان کی منڈیوں کے لئے موزوں ہے اور اس میں اچھے منافع کی صلاحیت ہے۔
/*backtest
start: 2022-11-22 00:00:00
end: 2023-11-04 05:20:00
period: 1d
basePeriod: 1h
exchanges: [{"eid":"Futures_Binance","currency":"BTC_USDT"}]
*/
//@version=5
strategy("Bollinger Bands - Breakout Strategy",overlay=true
)
// Define the length of the Bollinger Bands
bbLengthInput = input.int (15,title="Length", group="Bollinger Bands", inline="BB")
bbDevInput = input.float (2.0,title="StdDev", group="Bollinger Bands", inline="BB")
// Define the settings for the Trend Filter
trendFilterInput = input.bool(false, title="Above/Below", group = "Trend Filter", inline="Trend")
trendFilterPeriodInput = input(223,title="", group = "Trend Filter", inline="Trend")
trendFilterType = input.string (title="", defval="EMA",options=["EMA","SMA","RMA", "WMA"], group = "Trend Filter", inline="Trend")
volatilityFilterInput = input.bool(true,title="StdDev", group = "Volatility Filter", inline="Vol")
volatilityFilterStDevLength = input(15,title="",group = "Volatility Filter", inline="Vol")
volatilityStDevMaLength = input(15,title=">MA",group = "Volatility Filter", inline="Vol")
// ROC Filter
// f_security function by LucF for PineCoders available here: https://www.tradingview.com/script/cyPWY96u-How-to-avoid-repainting-when-using-security-PineCoders-FAQ/
f_security(_sym, _res, _src, _rep) => request.security(_sym, _res, _src[not _rep and barstate.isrealtime ? 1 : 0])[_rep or barstate.isrealtime ? 0 : 1]
high_daily = f_security(syminfo.tickerid, "D", high, false)
roc_enable = input.bool(false, "", group="ROC Filter from CloseD", inline="roc")
roc_threshold = input.float(1, "Treshold", step=0.5, group="ROC Filter from CloseD", inline="roc")
closed = f_security(syminfo.tickerid,"1D",close, false)
roc_filter= roc_enable ? (close-closed)/closed*100 > roc_threshold : true
// Trade Direction Filter
// tradeDirectionInput = input.string("Auto",options=["Auto", "Long&Short","Long Only", "Short Only"], title="Trade", group="Direction Filter", tooltip="Auto: if a PERP is detected (in the symbol description), trade long and short\n Otherwise as per user-input")
// tradeDirection = switch tradeDirectionInput
// "Auto" => str.contains(str.lower(syminfo.description), "perp") or str.contains(str.lower(syminfo.description), ".p") ? strategy.direction.all : strategy.direction.long
// "Long&Short" => strategy.direction.all
// "Long Only" => strategy.direction.long
// "Short Only" => strategy.direction.short
// => strategy.direction.all
// strategy.risk.allow_entry_in(tradeDirection)
// Calculate and plot the Bollinger Bands
[bbMiddle, bbUpper, bbLower] = ta.bb (close, bbLengthInput, bbDevInput)
plot(bbMiddle, "Basis", color=color.orange)
bbUpperPlot = plot(bbUpper, "Upper", color=color.blue)
bbLowerrPlot = plot(bbLower, "Lower", color=color.blue)
fill(bbUpperPlot, bbLowerrPlot, title = "Background", color=color.new(color.blue, 95))
// Calculate and view Trend Filter
float tradeConditionMa = switch trendFilterType
"EMA" => ta.ema(close, trendFilterPeriodInput)
"SMA" => ta.sma(close, trendFilterPeriodInput)
"RMA" => ta.rma(close, trendFilterPeriodInput)
"WMA" => ta.wma(close, trendFilterPeriodInput)
// Default used when the three first cases do not match.
=> ta.wma(close, trendFilterPeriodInput)
trendConditionLong = trendFilterInput ? close > tradeConditionMa : true
trendConditionShort = trendFilterInput ? close < tradeConditionMa : true
plot(trendFilterInput ? tradeConditionMa : na, color=color.yellow)
// Calculate and view Volatility Filter
stdDevClose = ta.stdev(close,volatilityFilterStDevLength)
volatilityCondition = volatilityFilterInput ? stdDevClose > ta.sma(stdDevClose,volatilityStDevMaLength) : true
bbLowerCrossUnder = ta.crossunder(close, bbLower)
bbUpperCrossOver = ta.crossover(close, bbUpper)
bgcolor(volatilityCondition ? na : color.new(color.red, 95))
// Date Filter
start = input(timestamp("2017-01-01"), "Start", group="Date Filter")
finish = input(timestamp("2050-01-01"), "End", group="Date Filter")
date_filter = true
// Entry and Exit Conditions
entryLongCondition = bbUpperCrossOver and trendConditionLong and volatilityCondition and date_filter and roc_filter
entryShortCondition = bbLowerCrossUnder and trendConditionShort and volatilityCondition and date_filter and roc_filter
exitLongCondition = bbLowerCrossUnder
exitShortCondition = bbUpperCrossOver
// Orders
if entryLongCondition
strategy.entry("EL", strategy.long)
if entryShortCondition
strategy.entry("ES", strategy.short)
if exitLongCondition
strategy.close("EL")
if exitShortCondition
strategy.close("ES")
// Long SL/TP/TS
xl_ts_percent = input.float(2,step=0.5, title= "TS", group="Exit Long", inline="LTS", tooltip="Trailing Treshold %")
xl_to_percent = input.float(0.5, step=0.5, title= "TO", group="Exit Long", inline="LTS", tooltip="Trailing Offset %")
xl_ts_tick = xl_ts_percent * close/syminfo.mintick/100
xl_to_tick = xl_to_percent * close/syminfo.mintick/100
xl_sl_percent = input.float (2, step=0.5, title="SL",group="Exit Long", inline="LSLTP")
xl_tp_percent = input.float(9, step=0.5, title="TP",group="Exit Long", inline="LSLTP")
xl_sl_price = strategy.position_avg_price * (1-xl_sl_percent/100)
xl_tp_price = strategy.position_avg_price * (1+xl_tp_percent/100)
strategy.exit("XL+SL/TP", "EL", stop=xl_sl_price, limit=xl_tp_price, trail_points=xl_ts_tick, trail_offset=xl_to_tick,comment_loss= "XL-SL", comment_profit = "XL-TP",comment_trailing = "XL-TS")
// Short SL/TP/TS
xs_ts_percent = input.float(2,step=0.5, title= "TS",group="Exit Short", inline ="STS", tooltip="Trailing Treshold %")
xs_to_percent = input.float(0.5, step=0.5, title= "TO",group="Exit Short", inline ="STS", tooltip="Trailing Offset %")
xs_ts_tick = xs_ts_percent * close/syminfo.mintick/100
xs_to_tick = xs_to_percent * close/syminfo.mintick/100
xs_sl_percent = input.float (2, step=0.5, title="SL",group="Exit Short", inline="ESSLTP", tooltip="Stop Loss %")
xs_tp_percent = input.float(9, step=0.5, title="TP",group="Exit Short", inline="ESSLTP", tooltip="Take Profit %")
xs_sl_price = strategy.position_avg_price * (1+xs_sl_percent/100)
xs_tp_price = strategy.position_avg_price * (1-xs_tp_percent/100)
strategy.exit("XS+SL/TP", "ES", stop=xs_sl_price, limit=xs_tp_price, trail_points=xs_ts_tick, trail_offset=xs_to_tick,comment_loss= "XS-SL", comment_profit = "XS-TP",comment_trailing = "XS-TS")
max_intraday_loss = input.int(10, title="Max Intraday Loss (Percent)", group="Risk Management")
//strategy.risk.max_intraday_loss(max_intraday_loss, strategy.percent_of_equity)
// Monthly Returns table, modified from QuantNomad. Please put calc_on_every_tick = true to plot it.
monthly_table(int results_prec, bool results_dark) =>
new_month = month(time) != month(time[1])
new_year = year(time) != year(time[1])
eq = strategy.equity
bar_pnl = eq / eq[1] - 1
cur_month_pnl = 0.0
cur_year_pnl = 0.0
// Current Monthly P&L
cur_month_pnl := new_month ? 0.0 :
(1 + cur_month_pnl[1]) * (1 + bar_pnl) - 1
// Current Yearly P&L
cur_year_pnl := new_year ? 0.0 :
(1 + cur_year_pnl[1]) * (1 + bar_pnl) - 1
// Arrays to store Yearly and Monthly P&Ls
var month_pnl = array.new_float(0)
var month_time = array.new_int(0)
var year_pnl = array.new_float(0)
var year_time = array.new_int(0)
last_computed = false
if (not na(cur_month_pnl[1]) and (new_month or barstate.islast))
if (last_computed[1])
array.pop(month_pnl)
array.pop(month_time)
array.push(month_pnl , cur_month_pnl[1])
array.push(month_time, time[1])
if (not na(cur_year_pnl[1]) and (new_year or barstate.islast))
if (last_computed[1])
array.pop(year_pnl)
array.pop(year_time)
array.push(year_pnl , cur_year_pnl[1])
array.push(year_time, time[1])
last_computed := barstate.islast ? true : nz(last_computed[1])
// Monthly P&L Table
var monthly_table = table(na)
cell_hr_bg_color = results_dark ? #0F0F0F : #F5F5F5
cell_hr_text_color = results_dark ? #D3D3D3 : #555555
cell_border_color = results_dark ? #000000 : #FFFFFF
// ell_hr_bg_color = results_dark ? #0F0F0F : #F5F5F5
// cell_hr_text_color = results_dark ? #D3D3D3 : #555555
// cell_border_color = results_dark ? #000000 : #FFFFFF
if (barstate.islast)
monthly_table := table.new(position.bottom_right, columns = 14, rows = array.size(year_pnl) + 1, bgcolor=cell_hr_bg_color,border_width=1,border_color=cell_border_color)
table.cell(monthly_table, 0, 0, syminfo.tickerid + " " + timeframe.period, text_color=cell_hr_text_color, bgcolor=cell_hr_bg_color)
table.cell(monthly_table, 1, 0, "Jan", text_color=cell_hr_text_color, bgcolor=cell_hr_bg_color)
table.cell(monthly_table, 2, 0, "Feb", text_color=cell_hr_text_color, bgcolor=cell_hr_bg_color)
table.cell(monthly_table, 3, 0, "Mar", text_color=cell_hr_text_color, bgcolor=cell_hr_bg_color)
table.cell(monthly_table, 4, 0, "Apr", text_color=cell_hr_text_color, bgcolor=cell_hr_bg_color)
table.cell(monthly_table, 5, 0, "May", text_color=cell_hr_text_color, bgcolor=cell_hr_bg_color)
table.cell(monthly_table, 6, 0, "Jun", text_color=cell_hr_text_color, bgcolor=cell_hr_bg_color)
table.cell(monthly_table, 7, 0, "Jul", text_color=cell_hr_text_color, bgcolor=cell_hr_bg_color)
table.cell(monthly_table, 8, 0, "Aug", text_color=cell_hr_text_color, bgcolor=cell_hr_bg_color)
table.cell(monthly_table, 9, 0, "Sep", text_color=cell_hr_text_color, bgcolor=cell_hr_bg_color)
table.cell(monthly_table, 10, 0, "Oct", text_color=cell_hr_text_color, bgcolor=cell_hr_bg_color)
table.cell(monthly_table, 11, 0, "Nov", text_color=cell_hr_text_color, bgcolor=cell_hr_bg_color)
table.cell(monthly_table, 12, 0, "Dec", text_color=cell_hr_text_color, bgcolor=cell_hr_bg_color)
table.cell(monthly_table, 13, 0, "Year", text_color=cell_hr_text_color, bgcolor=cell_hr_bg_color)
for yi = 0 to array.size(year_pnl) - 1
table.cell(monthly_table, 0, yi + 1, str.tostring(year(array.get(year_time, yi))), text_color=cell_hr_text_color, bgcolor=cell_hr_bg_color)
y_color = array.get(year_pnl, yi) > 0 ? color.lime : array.get(year_pnl, yi) < 0 ? color.red : color.gray
table.cell(monthly_table, 13, yi + 1, str.tostring(math.round(array.get(year_pnl, yi) * 100, results_prec)), bgcolor = y_color)
for mi = 0 to array.size(month_time) - 1
m_row = year(array.get(month_time, mi)) - year(array.get(year_time, 0)) + 1
m_col = month(array.get(month_time, mi))
m_color = array.get(month_pnl, mi) > 0 ? color.lime : array.get(month_pnl, mi) < 0 ? color.red : color.gray
table.cell(monthly_table, m_col, m_row, str.tostring(math.round(array.get(month_pnl, mi) * 100, results_prec)), bgcolor = m_color)
results_prec = input(2, title = "Precision", group="Results Table")
results_dark = input.bool(defval=true, title="Dark Mode", group="Results Table")
monthly_table(results_prec, results_dark)