کراس ٹائم فریم سپر ٹرینڈ شاک بریک آؤٹ حکمت عملی
جائزہ
یہ حکمت عملی ایک سے زیادہ ٹائم فریم کے سپر ٹرینڈ اشارے اور برین بینڈ اشارے کو جوڑتی ہے ، رجحان کی سمت اور اہم معاون مزاحمت کی سطح کی نشاندہی کرتی ہے ، زلزلے کے دوران انٹریوں کو انجام دیتی ہے ، اور کراس آؤٹ پوزیشن پر مبنی ہے۔ یہ حکمت عملی بنیادی طور پر اعلی اتار چڑھاؤ والی اجناس کی فیوچر اقسام جیسے سونے ، چاندی ، خام تیل وغیرہ پر لاگو ہوتی ہے۔
حکمت عملی کا اصول
پائن اسکرپٹ پر مبنی اپنی مرضی کے مطابق ملٹی ٹائم فریم سپر ٹرینڈ فنکشنpine_supertrend()، مختلف دورانیے ((مثال کے طور پر 1 منٹ اور 5 منٹ) کے ساتھ مل کر سپر رجحانات ، بڑے دورانیے کے رجحانات کی سمت کا تعین کریں۔
اس کے علاوہ ، بورن کے نیچے جانے کا حساب لگایا جاتا ہے ، اور اس کا تعین کرنے کے لئے ایک کوریج ٹوٹ جاتا ہے۔ جب قیمت بورن کے نیچے جانے کے بعد ٹوٹ جاتی ہے تو ، اس کو بیعانہ ٹوٹنے کے طور پر سمجھا جاتا ہے۔ جب قیمت بورن کے نیچے جانے کے بعد ٹوٹ جاتی ہے تو ، اس کو بیعانہ ٹوٹنے کے طور پر سمجھا جاتا ہے۔
حکمت عملی کا اشارہ:
کثیر سر سگنل: بندش کی قیمت > برن ٹریک پر ہے اور بندش کی قیمت > کثیر ٹائم فریم سپر ٹرینڈ اشارے خالی سر سگنل: بندش کی قیمت < بلین کی حد سے نیچے اور بندش کی قیمت < ایک سے زیادہ ٹائم فریم سپر ٹرینڈ اشارے
سٹاپ نقصان:
کثیر سر اسٹاپ: اختتامی قیمت < 5 منٹ سپر ٹرینڈ اشارے خالی سر اسٹاپ: اختتامی قیمت > 5 منٹ سپر ٹرینڈ اشارے
لہذا ، حکمت عملی سپر ٹرینڈ اشارے اور برن بینڈ اشارے کے مابین گونج توڑنے کو پکڑتی ہے ، اور اعلی اتار چڑھاؤ کے حالات میں لین دین کی کارروائی کرتی ہے۔
طاقت کا تجزیہ
- ملٹی ٹائم فریم سپر ٹرینڈ اشارے کا استعمال کرتے ہوئے بڑے دورانیہ کے رجحانات کی سمت کا تعین کریں ، سگنل کے معیار کو بہتر بنائیں
- برن بیلٹ اوپر اور نیچے کی ریلوں کو اہم معاون مزاحمت کی حیثیت سے ، جعلی توڑنے کو کم کرنے کے لئے
- سپر ٹرینڈ انڈیکیٹرز نقصان کو روکنے ، نقصان کو کم کرنے اور خطرے کو کنٹرول کرنے کے لئے
خطرے کا تجزیہ
- سپر ٹرینڈ اشارے میں تاخیر ہے اور اس میں تبدیلی کا نقطہ نظر نظر نہیں آیا ہے
- برن بینڈ پیرامیٹرز کی غلط ترتیب سے بہت زیادہ بار بار یا بہت زیادہ تجارت ہوسکتی ہے
- رات کے وقت یا کسی بڑے واقعے کی صورت میں ، قیمتوں میں شدید اتار چڑھاؤ ، نقصان کو روکنے کے لئے آسان
خطرے سے نمٹنے کے طریقے:
- متعدد معاون اشارے کی تصدیق کے اشارے کے ساتھ مل کر ، جعلی توڑ پھوڑ سے بچیں
- بہترین توازن تلاش کرنے کے لئے برن بینڈ پیرامیٹرز کو بہتر بنائیں
- سٹاپ نقصان کی پوزیشن کو ایڈجسٹ کریں، سٹاپ نقصان کی فاصلے کو بڑھانے
اصلاح کی سمت
- KDJ، MACD، وغیرہ جیسے دیگر رجحانات کے اشارے کو معاون فیصلے کے طور پر آزمائیں۔
- مشین لرننگ ماڈل کے فیصلے کے امکانات کو بڑھانا
- بہترین سپر پیرامیٹرز کا مجموعہ تلاش کرنے کے لئے پیرامیٹرز کو بہتر بنائیں
خلاصہ کریں۔
اس حکمت عملی میں سپر ٹرینڈ اور برین بینڈ کے دو اعلی کارکردگی کے اشارے شامل ہیں ، جو ٹائم فریم کے تجزیہ اور چینل کے بریک ڈاؤن کے فیصلے کے ذریعے اعلی امکانات کا انتظام کرتے ہیں۔ اس حکمت عملی نے فنڈز کے خطرے کو مؤثر طریقے سے کنٹرول کیا ہے ، جس سے یہ ثابت ہوتا ہے کہ اعلی اتار چڑھاؤ والی اقسام میں بہتر منافع حاصل کیا جاسکتا ہے۔ اس حکمت عملی کی تاثیر کو مزید اصلاح اور اشارے کے مجموعے کے ذریعہ بڑھا دیا جاسکتا ہے۔
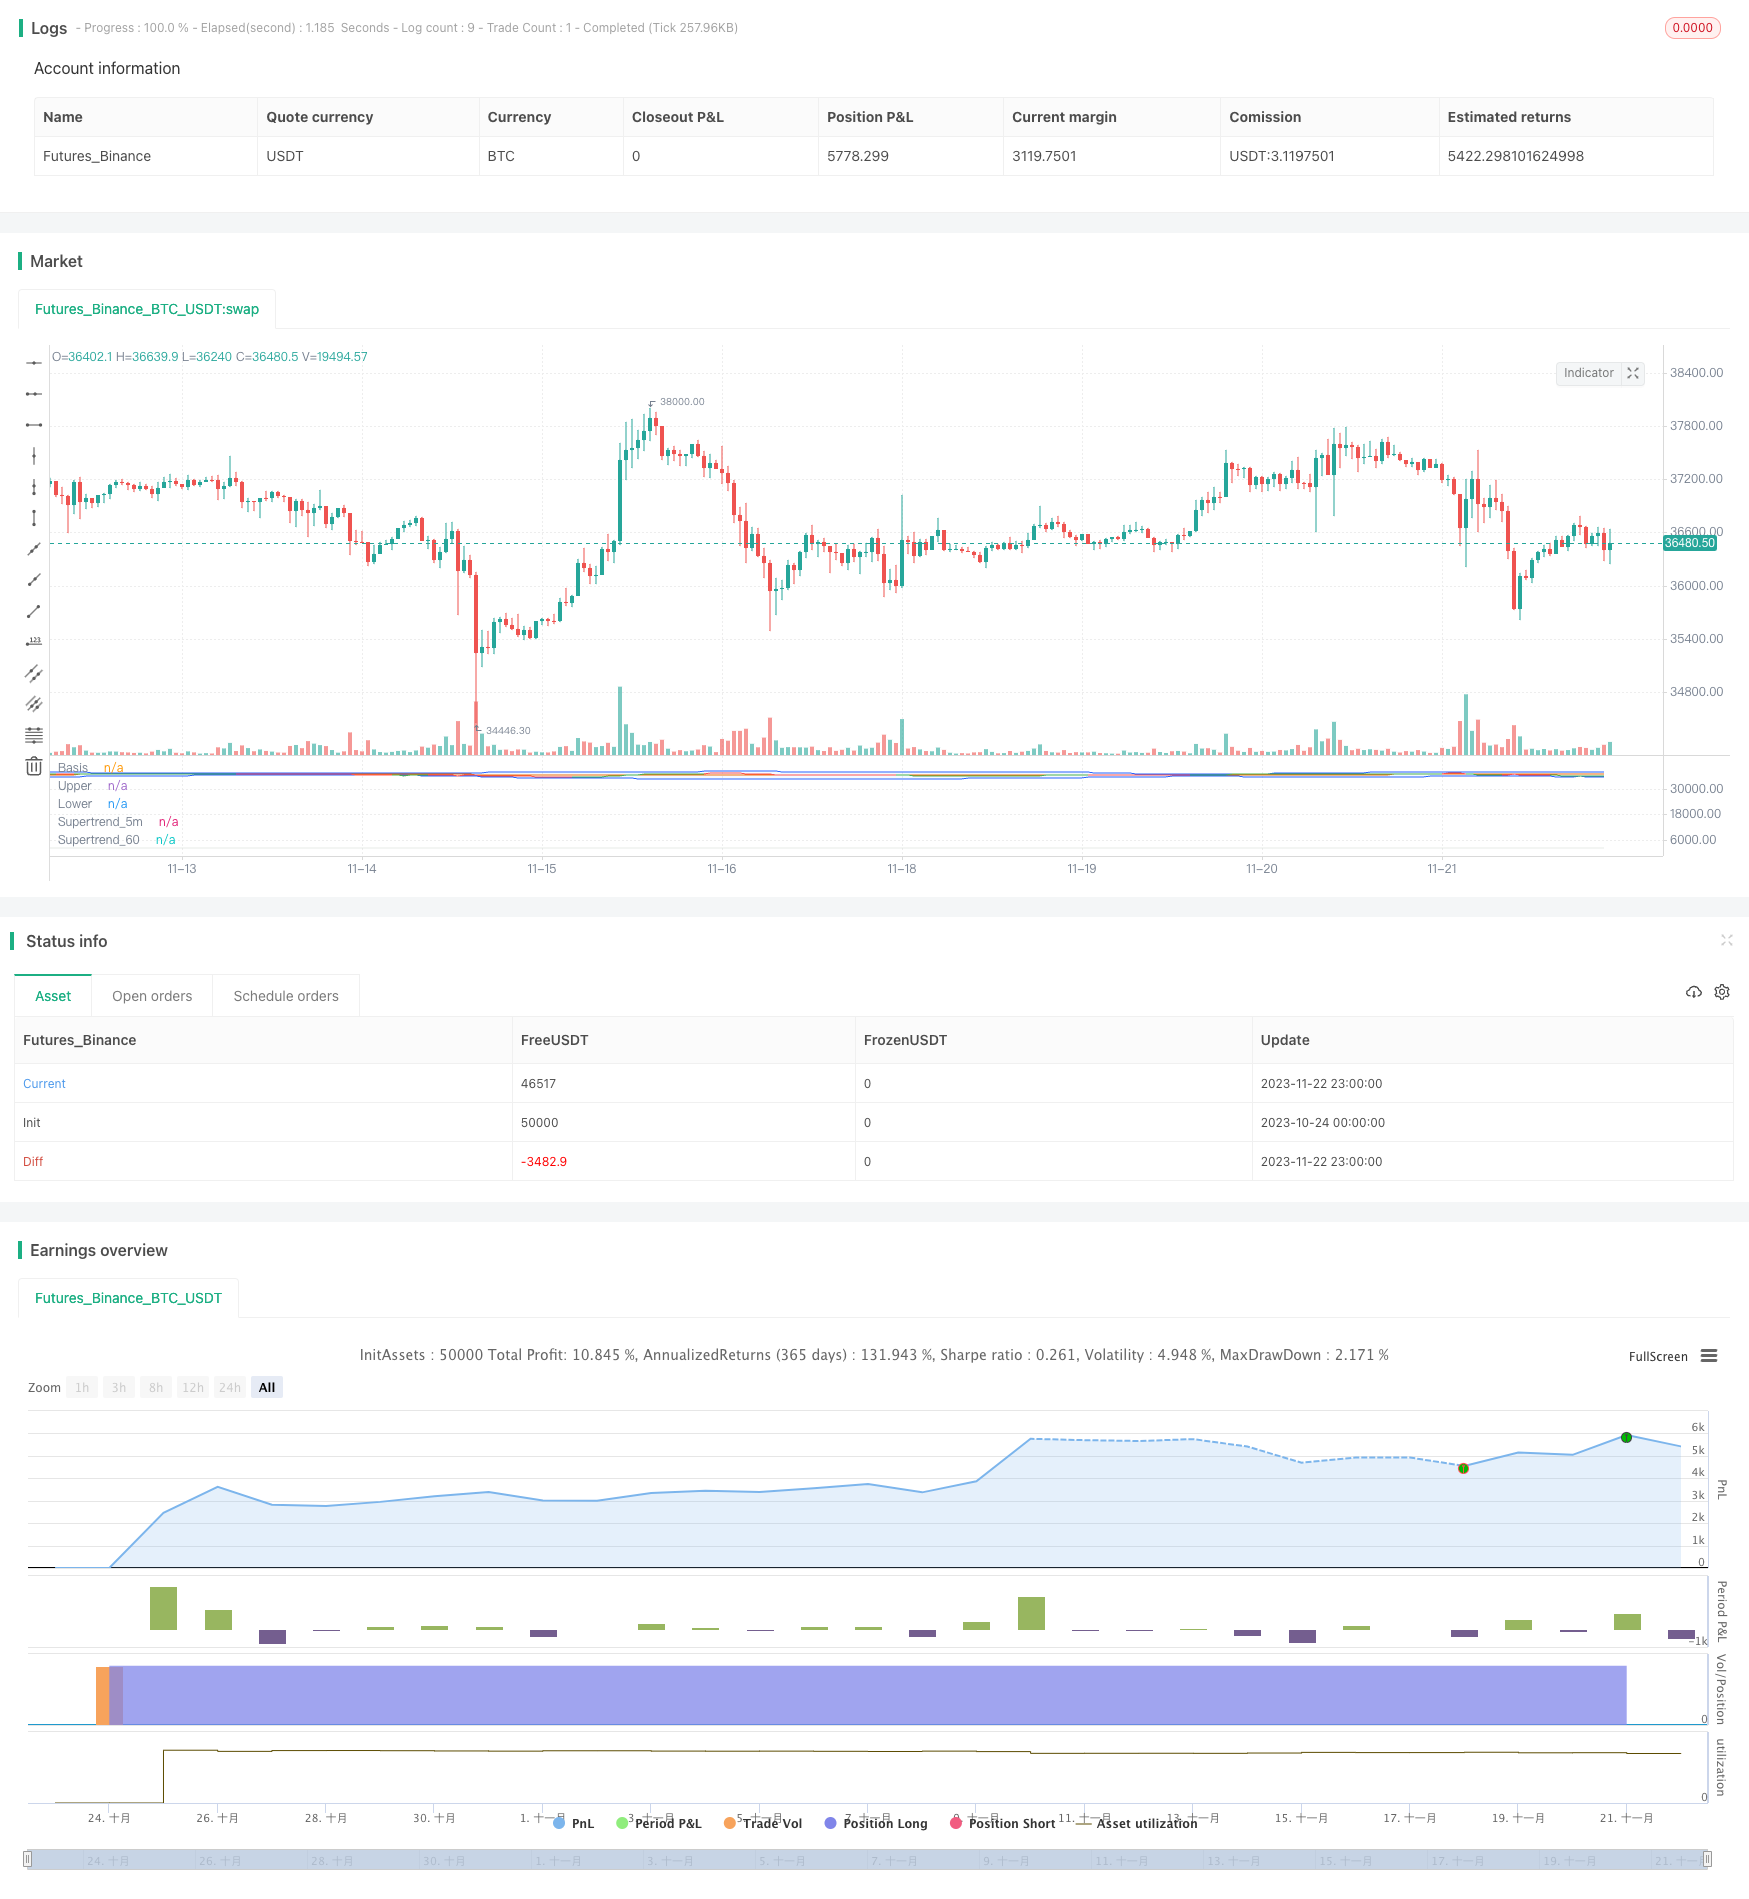
/*backtest
start: 2023-10-24 00:00:00
end: 2023-11-23 00:00:00
period: 1h
basePeriod: 15m
exchanges: [{"eid":"Futures_Binance","currency":"BTC_USDT"}]
*/

// This source code is subject to the terms of the Mozilla Public License 2.0 at https://mozilla.org/MPL/2.0/
// © ambreshc95

//@version=5
strategy("Comodity_SPL_Strategy_01", overlay=false)

// function of st
// [supertrend, direction] = ta.supertrend(3, 10)
// plot(direction < 0 ? supertrend : na, "Up direction", color = color.green, style=plot.style_linebr)
// plot(direction > 0 ? supertrend : na, "Down direction", color = color.red, style=plot.style_linebr)

// VWAP
// src_vwap = input(title = "Source", defval = hlc3, group="VWAP Settings")
// [_Vwap,stdv,_] = ta.vwap(src_vwap,false,1)
// plot(_Vwap, title="VWAP", color = color.rgb(0, 0, 0))


// The same on Pine Script®
pine_supertrend(factor, atrPeriod,len_ma) =>

    h= ta.sma(high,len_ma)
    l= ta.sma(low,len_ma)
    hlc_3 = (h+l)/2
    src = hlc_3
    atr = ta.atr(atrPeriod)
    upperBand = src + factor * atr
    lowerBand = src - factor * atr
    prevLowerBand = nz(lowerBand[1])
    prevUpperBand = nz(upperBand[1])

    lowerBand := lowerBand > prevLowerBand or close[1] < prevLowerBand ? lowerBand : prevLowerBand
    upperBand := upperBand < prevUpperBand or close[1] > prevUpperBand ? upperBand : prevUpperBand
    int direction = na
    float superTrend = na
    prevSuperTrend = superTrend[1]
    if na(atr[1])
        direction := 1
    else if prevSuperTrend == prevUpperBand
        direction := close > upperBand ? -1 : 1
    else
        direction := close < lowerBand ? 1 : -1
    superTrend := direction == -1 ? lowerBand : upperBand
    [superTrend, direction]
len_ma_given = input(75, title="MA_SMA_ST")
[Pine_Supertrend, pineDirection] = pine_supertrend(3, 10,len_ma_given)
// plot(pineDirection < 0 ? Pine_Supertrend : na, "Up direction", color = color.green, style=plot.style_linebr)
// plot(pineDirection > 0 ? Pine_Supertrend : na, "Down direction", color = color.red, style=plot.style_linebr)
//
// Define Supertrend parameters
atrLength = input(10, title="ATR Length")
factor = input(3.0, title="Factor")

// // Calculate Supertrend
[supertrend, direction] = ta.supertrend(factor, atrLength)

st_color = supertrend > close ? color.red : color.green
// // Plot Supertrend
// plot(supertrend, "Supertrend", st_color)
//

// BB Ploting
length = input.int(75, minval=1)
maType = input.string("SMA", "Basis MA Type", options = ["SMA", "EMA", "SMMA (RMA)", "WMA", "VWMA"])
src = input(close, title="Source")
mult = input.float(2.5, minval=0.001, maxval=50, title="StdDev")

ma(source, length, _type) =>
    switch _type
        "SMA" => ta.sma(source, length)
        "EMA" => ta.ema(source, length)
        "SMMA (RMA)" => ta.rma(source, length)
        "WMA" => ta.wma(source, length)
        "VWMA" => ta.vwma(source, length)

basis = ma(src, length, maType)
dev = mult * ta.stdev(src, length)
upper = basis + dev
lower = basis - dev
offset = input.int(0, "Offset", minval = -500, maxval = 500)
plot(basis, "Basis", color=#FF6D00, offset = offset)
p1 = plot(upper, "Upper", color=#2962FF, offset = offset)
p2 = plot(lower, "Lower", color=#2962FF, offset = offset)
fill(p1, p2, title = "Background", color=color.rgb(33, 150, 243, 95))


// h= ta.sma(high,60)
// l= ta.sma(low,60)
// c= sma(close,60)
// hlc_3 = (h+l)/2
// supertrend60 = request.security(syminfo.tickerid,  supertrend)

// // Define timeframes for signals
tf1 = input(title="Timeframe 1", defval="1")
tf2 = input(title="Timeframe 2",defval="5")
// tf3 = input(title="Timeframe 3",defval="30")


// // // Calculate Supertrend on multiple timeframes
supertrend_60 = request.security(syminfo.tickerid, tf1, Pine_Supertrend)
supertrend_5m = request.security(syminfo.tickerid, tf2, supertrend)
// supertrend3 = request.security(syminfo.tickerid, tf3, supertrend)

// // Plot Supertrend_60
st_color_60 = supertrend_60 > close ? color.rgb(210, 202, 202, 69) : color.rgb(203, 211, 203, 52)
plot(supertrend_60, "Supertrend_60", st_color_60)

// // Plot Supertrend_5m
st_color_5m = supertrend_5m > close ? color.red : color.green
plot(supertrend_5m, "Supertrend_5m", st_color_5m)


ma21 = ta.sma(close,21)
// rsi = ta.rsi(close,14)
// rsima = ta.sma(rsi,14)

// Define the Indian Standard Time (IST) offset from GMT
ist_offset = 5.5 // IST is GMT+5:30

// Define the start and end times of the trading session in IST
// start_time = timestamp("GMT", year, month, dayofmonth, 10, 0) + ist_offset * 60 * 60
// end_time = timestamp("GMT", year, month, dayofmonth, 14, 0) + ist_offset * 60 * 60
// Check if the current time is within the trading session
// in_trading_session = timenow >= start_time and timenow <= end_time

in_trading_session = not na(time(timeframe.period, "0945-1430"))
// bgcolor(inSession ? color.silver : na)
out_trading_session = not na(time(timeframe.period, "1515-1530"))
// // // Define buy and sell signals
buySignal = close>upper and close > supertrend_5m and close > supertrend_60 and close > ma21  and in_trading_session //close > supertrend and
sellSignal = close<lower and close < supertrend_5m and close < supertrend_60 and close < ma21  and in_trading_session //close < supertrend and

var bool long_position = false
var bool long_exit = false
var float long_entry_price = 0
var float short_entry_price = 0

if buySignal and not long_position
    // label.new(bar_index, na, yloc = yloc.belowbar, style = label.style_label_up, color = color.green, size = size.small)
    long_position := true
    strategy.entry("Buy",strategy.long)

long_exit := (close < supertrend_5m)
if long_position and long_exit
    // label.new(bar_index, na, yloc = yloc.belowbar, style = label.style_xcross, color = color.green, size = size.tiny)
    long_position := false
    strategy.exit("Exit","Buy",stop = close)

var bool short_position = false
var bool short_exit = false
if sellSignal and not short_position
    // label.new(bar_index, na, yloc = yloc.abovebar, style = label.style_label_down, color = color.red, size = size.small)
    short_position := true
    strategy.entry("Sell",strategy.short)

short_exit := (close > supertrend_5m)
if short_position and short_exit
    // label.new(bar_index, na, yloc = yloc.belowbar, style = label.style_xcross, color = color.red, size = size.tiny)
    short_position := false
    strategy.exit("Exit","Sell", stop = close)

if out_trading_session
    long_position := false
    strategy.exit("Exit","Buy",stop = close)
    short_position := false
    strategy.exit("Exit","Sell", stop = close)

// if long_position
//     long_entry_price := close[1] + 50//bar_index

// if short_position
//     short_entry_price := close[1] - 50//bar_index

// if (long_position and high[1] > long_entry_price)
//     label.new(bar_index, na, yloc = yloc.abovebar, style = label.style_triangledown, color = color.yellow, size = size.tiny)

// if (short_position and low[1] < short_entry_price)
//     label.new(bar_index, na, yloc = yloc.belowbar, style = label.style_triangleup, color = color.yellow, size = size.tiny)