TFO اور ATR کی بنیاد پر رجحان کی پیروی کرنے والی اسٹاپ لاس حکمت عملی

جائزہ
یہ حکمت عملی ایک ٹرینڈ ٹریکنگ اسٹاپ نقصان کی حکمت عملی ہے جو ڈاکٹر جان ایہلرز کے ٹرینڈ لچکدار آسکیلیٹر (Trend Flex Oscillator, TFO) اور اوسط حقیقی اتار چڑھاؤ کی حد (Average True Range, ATR) اشارے پر مبنی ہے۔ یہ کثیر مارکیٹوں پر لاگو ہوتا ہے ، اور جب قیمتوں میں اوورسوڈ کے بعد الٹ جاتا ہے تو کثیر پوزیشن کھولی جاتی ہے۔ یہ عام طور پر کچھ دن میں پوزیشن کو صاف کردیتا ہے ، جب تک کہ یہ ایک ریچھ کی مارکیٹ میں پکڑا نہ جائے ، اس صورت میں یہ پوزیشن پر قائم رہتا ہے۔ یہ حکمت عملی ترتیب دینے کے قابل پیرامیٹرز کو ایک سادہ واپسی کے ذریعہ ایڈجسٹ کرتی ہے ، لیکن اس کے نتائج پر مکمل اعتماد نہیں کرنا چاہئے۔
حکمت عملی کا اصول
اس حکمت عملی میں TFO اور ATR دونوں اشارے شامل ہیں ، خریدنے کے لئے موزوں پوزیشنوں پر زیادہ پوزیشنیں اور فروخت کے لئے موزوں پوزیشنوں پر کم پوزیشنیں۔
خریدنے کی شرائط: جب TFO کسی حد سے کم ہو (((یہ ضرورت سے زیادہ خالی ہے) ، اور اوپر کی K لائن کی TFO قیمت موجودہ K لائن سے کم ہے (((یہ TFO الٹ پلٹ ہے) ، اور ATR طے شدہ اتار چڑھاؤ کی حد سے زیادہ ہے (((یہ مارکیٹ میں اتار چڑھاؤ میں اضافہ ہے) ، ان تینوں شرائط کو پورا کرنے پر زیادہ پوزیشن کھولی جائے گی۔
صفائی کی پوزیشن کی شرائط: جب ٹی ایف او کسی حد سے زیادہ ہو (یعنی حد سے زیادہ سر) ، اور اے ٹی آر مقررہ حد سے زیادہ ہو تو ، تمام زیادہ پوزیشنوں کو صاف کریں۔ اس کے علاوہ ، اس حکمت عملی میں ٹریکنگ اسٹاپ نقصان بھی ہے ، اور جب قیمت مقررہ ٹریکنگ اسٹاپ نقصان کی قیمت سے نیچے آجائے تو ، تمام زیادہ پوزیشنوں کو بھی صاف کردیا جائے گا۔ صارفین کو اختیار ہے کہ حکمت عملی کو اشارے کے اشارے کے مطابق صاف کیا جائے ، یا صرف قیمت کی صفائی کے مطابق بند کیا جائے۔
اس حکمت عملی میں ایک ہی وقت میں زیادہ سے زیادہ 15 کثیر پوزیشنیں کھولی جاسکتی ہیں۔ اس کی پیرامیٹرز کو ایڈجسٹ کیا جاسکتا ہے ، جو مختلف ٹائم پیریڈ کے لئے موزوں ہے۔
اسٹریٹجک فوائد
-
رجحانات اور اتار چڑھاؤ کے ساتھ مل کر مارکیٹ کی سمت کا فیصلہ کرنا ، نسبتا مستحکم ہے۔ ٹی ایف او رجحانات کو توڑنے کے ابتدائی اشارے پر قبضہ کرسکتا ہے ، اے ٹی آر مارکیٹ میں اتار چڑھاؤ میں اضافے کے وقت کو پکڑ سکتا ہے۔
-
ایڈجسٹ خرید و فروخت پیرامیٹرز اور سٹاپ نقصان پیرامیٹرز، آپریشنل لچکدار. صارفین کو مارکیٹ کے مطابق پیرامیٹرز کو ایڈجسٹ کرنے کے لئے، زیادہ سے زیادہ اصلاح کے لئے.
-
بلٹ میں سٹاپ نقصان کی خصوصیت ہے جو انتہائی حالات میں ہونے والے نقصان کو کم کرتی ہے۔ سٹاپ نقصان کی حکمت عملی کوانٹم ٹریڈنگ کا ایک بہت اہم حصہ ہے۔
-
اضافی پوزیشن کھولنے اور کچھ پوزیشنوں کو صاف کرنے کی حمایت کرتا ہے ، جس سے پوزیشن بڑھا کر منافع میں اضافہ کیا جاسکتا ہے۔
اسٹریٹجک رسک
-
اس حکمت عملی میں صرف زیادہ کام کیا جاتا ہے ، کوئی خالی جگہ نہیں لی جاتی ہے ، اور گرتی ہوئی مارکیٹوں میں منافع نہیں ملتا ہے۔ اگر یہ ایک خوفناک ریچھ کی مارکیٹ میں ہوتا ہے تو ، اس سے بہت زیادہ نقصان ہوسکتا ہے۔
-
پیرامیٹرز کی غلط ترتیب سے زیادہ تجارت یا کم فروخت ہوسکتی ہے۔ بہترین پیرامیٹرز کا مجموعہ تلاش کرنے کے لئے بار بار جانچ کی ضرورت ہے۔
-
انتہائی حالات میں ، اسٹاپ نقصان غیر موثر ہوسکتا ہے ، جس سے بڑے نقصانات کو روکا نہیں جاسکتا ہے۔ یہ ایک ایسا مسئلہ ہے جس کا سامنا تمام اسٹاپ نقصان کی حکمت عملیوں کو ہوسکتا ہے۔
-
اس کے علاوہ ، یہ بھی کہا گیا ہے کہ اس کے نتیجے میں ، اس کی قیمتوں میں کمی واقع ہوگی ، اور اس کے نتیجے میں اس کی قیمتوں میں کمی واقع ہوگی۔
حکمت عملی کی اصلاح
-
فروخت کی شرائط میں متحرک اسٹاپ لائن کو شامل کرنے پر غور کیا جاسکتا ہے تاکہ حکمت عملی کو بروقت اسٹاپ نقصان پہنچایا جاسکے اور نیچے جانے والے خطرے کو مؤثر طریقے سے کنٹرول کیا جاسکے۔
-
خالی کرنے کا طریقہ کار بڑھایا جاسکتا ہے ، ٹی ایف او کے الٹ جانے پر اور اے ٹی آر کافی بڑے ہونے پر خالی پوزیشن کھولنے کے لئے ، تاکہ حکمت عملی کو خالی مارکیٹوں پر لاگو کیا جاسکے۔
-
مزید فلٹرنگ شرائط شامل کی جاسکتی ہیں ، جیسے ٹرانزیکشن میں تبدیلی ، حکمت عملی پر غیر معمولی رویے کے اثرات کو کم کرنا۔
-
بہترین دورانیہ اور پیرامیٹرز کے مجموعے کو تلاش کرنے کے لئے مختلف وقت کی مدت کے لئے پیرامیٹرز کی ترتیب اور نتائج کی جانچ کی جا سکتی ہے.
خلاصہ کریں۔
اس حکمت عملی میں رجحان تجزیہ اور اتار چڑھاؤ کی نگرانی کے فوائد کو مربوط کیا گیا ہے ، جس میں ٹی ایف او اور اے ٹی آر کے اشارے کے مجموعے کے ذریعہ مارکیٹ کی سمت کا فیصلہ کیا گیا ہے۔ اس میں اضافی پوزیشن کھولنے ، جزوی طور پر بند پوزیشن ، اور متحرک نقصان کو روکنے جیسے میکانزم ہیں ، جو منافع کو بڑھا سکتے ہیں اور خطرہ کو کنٹرول کرسکتے ہیں ، جو کثیر جہتی حالات کے لئے موزوں ہیں۔ اس میں توسیع پذیر اصلاح کی گنجائش بھی ہے ، جس میں مزید اشارے فلٹرنگ اور پیرامیٹر ایڈجسٹمنٹ کو شامل کرکے حکمت عملی کی کارکردگی کو مزید بہتر بنایا جاسکتا ہے۔ بنیادی طور پر ایک مقداری حکمت عملی کی بنیادی فنکشنل ضروریات کو پورا کرنا ، گہری تحقیق اور اطلاق کے قابل ہے۔
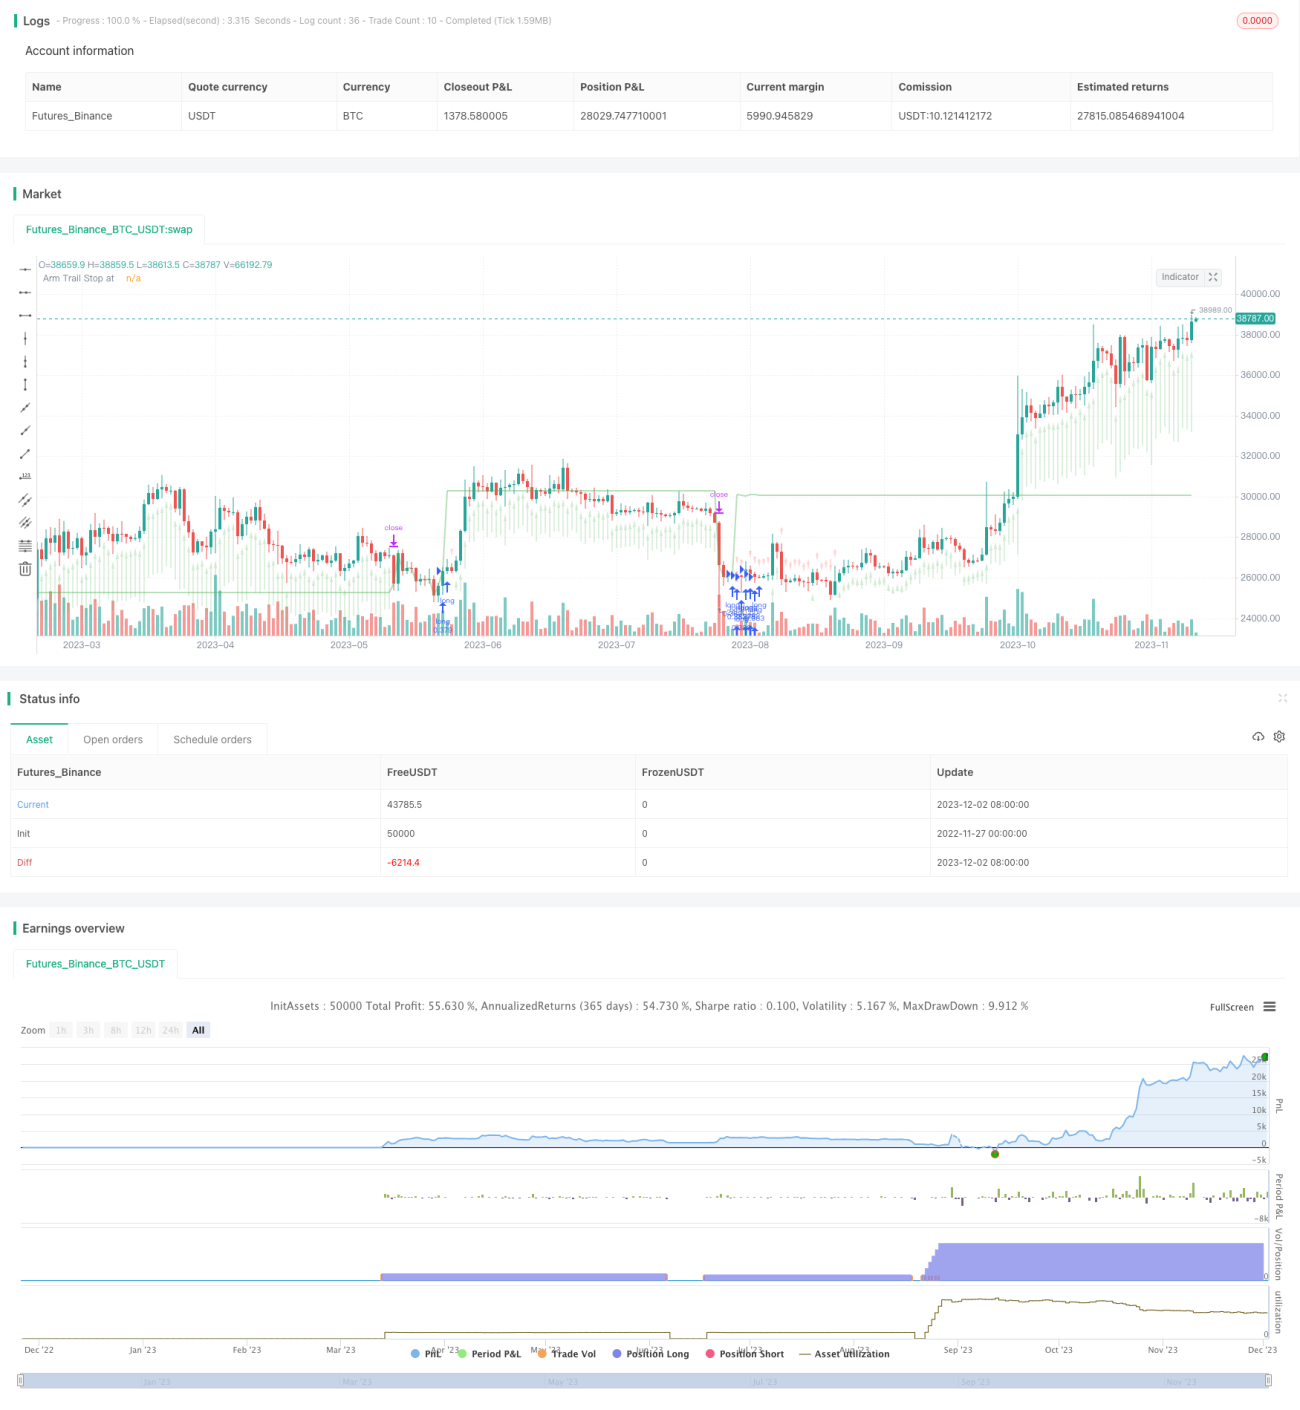
/*backtest
start: 2022-11-27 00:00:00
end: 2023-12-03 00:00:00
period: 1d
basePeriod: 1h
exchanges: [{"eid":"Futures_Binance","currency":"BTC_USDT"}]
*/

// This source code is subject to the terms of the Mozilla Public License 2.0 at https://mozilla.org/MPL/2.0/
// © Chart0bserver
//
// Open Source attributions:- 1