ملٹی فیکٹر RSI ریورسل حکمت عملی

جائزہ
یہ حکمت عملی RSI اشارے کا استعمال کرتی ہے جس میں اوورلوڈ اوور سیل کی شناخت ہوتی ہے ، جس میں متعدد معاون عوامل جیسے MACD ، اسٹوکاسٹک اشارے شامل ہیں۔ اس حکمت عملی کا مقصد قلیل مدتی الٹ کے مواقع کو پکڑنا ہے ، جو الٹ کی حکمت عملی ہے۔
حکمت عملی کا اصول
یہ حکمت عملی بنیادی طور پر آر ایس آئی اشارے کا استعمال کرتی ہے تاکہ یہ معلوم کیا جاسکے کہ آیا مارکیٹ میں زیادہ خرید یا زیادہ فروخت کی حالت ہے۔ جب آر ایس آئی اشارے ایک مقررہ اوور بیو لائن سے زیادہ ہوتا ہے تو ، اس سے ظاہر ہوتا ہے کہ مارکیٹ میں زیادہ خرید کی حالت ہوسکتی ہے ، اس وقت حکمت عملی کا انتخاب کرنا ہے۔ جب آر ایس آئی اشارے ایک مقررہ اوور بیو لائن سے کم ہوتا ہے تو ، اس سے ظاہر ہوتا ہے کہ مارکیٹ میں زیادہ فروخت کی حالت ہوسکتی ہے ، اس وقت حکمت عملی کا انتخاب کرنا ہے۔ اس طرح ایک انتہائی حالت سے دوسری انتہائی حالت میں تبدیل ہونے والے عمل کے دوران پیدا ہونے والے قلیل مدتی تجارتی مواقع کو پکڑ کر فائدہ اٹھائیں۔
اس کے علاوہ ، حکمت عملی نے متعدد معاون عوامل جیسے MACD ، Stochastic اور دیگر متعارف کروائے ہیں۔ ان معاون عوامل کا کام ممکنہ طور پر جھوٹے مثبت تجارتی سگنل کو فلٹر کرنا ہے۔ حکمت عملی صرف تب ہی حقیقی تجارتی کارروائی کرتی ہے جب RSI اشارے سگنل دیتے ہیں اور معاون عوامل بھی اس سگنل کی حمایت کرتے ہیں۔ اس طرح کے متعدد عوامل کا تعاون حکمت عملی کے سگنل کی وشوسنییتا کو بڑھا سکتا ہے ، جس سے حکمت عملی کی استحکام میں بھی اضافہ ہوتا ہے۔
طاقت کا تجزیہ
اس حکمت عملی کا سب سے بڑا فائدہ یہ ہے کہ اس کی گرفتاری کی کارکردگی زیادہ ہے ، جس میں کثیر عنصر کی توثیق کی گئی ہے جس سے سگنل کی کوالٹی میں بہتری آئی ہے۔ خاص طور پر ، یہ مندرجہ ذیل پہلوؤں میں ظاہر ہوتا ہے:
- RSI اشارے مارکیٹ کے نظاموں کی شناخت کرنے کے لئے خود کو مضبوط بناتا ہے اور اوورلوڈ اوورلوڈ کو مؤثر طریقے سے شناخت کرسکتا ہے.
- اس کے علاوہ ، اس نے متعدد آلات کے ساتھ ملٹی فیکٹر کی توثیق کی ہے ، جس سے سگنل کے معیار کو بہتر بنایا گیا ہے اور بہت سارے جھوٹے مثبتات کو فلٹر کیا گیا ہے۔
- حکمت عملی پیرامیٹرز کے لئے حساس نہیں ہے اور آسانی سے بہتر بنایا جا سکتا ہے.
خطرات اور حل
اس حکمت عملی میں کچھ خطرات بھی ہیں، جو بنیادی طور پر دو پہلوؤں پر مرکوز ہیں۔
- ریورس ناکامی کا خطرہ۔ ریورس سگنل خود انحصار کرتا ہے کہ اسٹیٹ اسٹریٹجک موقع ، انفرادی ریورس ناکامی کے امکانات کو خارج نہیں کرتا ہے۔ پوزیشن کو کم کرکے یا اسٹاپ نقصان کی ترتیب دے کر خطرے کو کنٹرول کیا جاسکتا ہے۔
- کثیر رخا رویے کے تحت نقصان کا خطرہ۔ حکمت عملی مجموعی طور پر ابھی بھی مارکیٹ کے پیچھے چلنے پر مبنی ہے ، کثیر رخا رویے کے تحت کچھ نقصانات کا سامنا کرنا ناگزیر ہے۔ اس سے ہمیں بڑے رجحانات کا درست اندازہ لگانے کی ضرورت ہے ، اور اگر ضروری ہو تو مصنوعی مداخلت کے ذریعہ منفی رویے کے ماحول کو چھوڑ دیں۔
اصلاح کی سمت
اس حکمت عملی کو مزید بہتر بنانے کی ضرورت ہے:
- مختلف پرجاتیوں کی جانچ کریں ، بہترین پیرامیٹرز کا مجموعہ تلاش کریں۔ حکمت عملی پیرامیٹرز کے لئے حساس نہیں ہے ، لیکن پھر بھی مختلف پرجاتیوں کے لئے بہترین پیرامیٹرز تلاش کرنے کی سفارش کی جاتی ہے۔
- ایڈجسٹمنٹ سے باہر نکلنے کا طریقہ کار شامل کریں۔ متحرک اسٹاپ نقصان ، وقت سے باہر نکلنے اور اسی طرح کے طریقوں کو آزمائشی طور پر شامل کیا جاسکتا ہے ، تاکہ حکمت عملی مارکیٹ میں ہونے والی تبدیلیوں کو بہتر طور پر اپنائے۔
- مشین لرننگ الگورتھم متعارف کروانا۔ حکمت عملی کی کامیابی کی شرح کو بہتر بنانے کے لئے ، ماڈل سیکھنے کو کامیابی کی واپسی کے امکانات کا اندازہ لگانے کی کوشش کی جاسکتی ہے۔
خلاصہ کریں۔
یہ حکمت عملی مجموعی طور پر ایک شارٹ لائن الٹ حکمت عملی ہے۔ RSI اشارے کا استعمال کرتے ہوئے اوور بیئر اوور سیل کی صلاحیت کا فیصلہ کرنے کے لئے ، اور متعدد معاون ٹولز کے ذریعہ ملٹی فیکٹر تصدیق کے لئے ، جس سے سگنل کے معیار میں اضافہ ہوتا ہے۔ یہ حکمت عملی گرفتاری کی اعلی کارکردگی اور بہتر استحکام کے ساتھ ہے۔ یہ مزید جانچ اور اصلاح کے قابل ہے ، اور آخر کار منافع بخش ہے۔
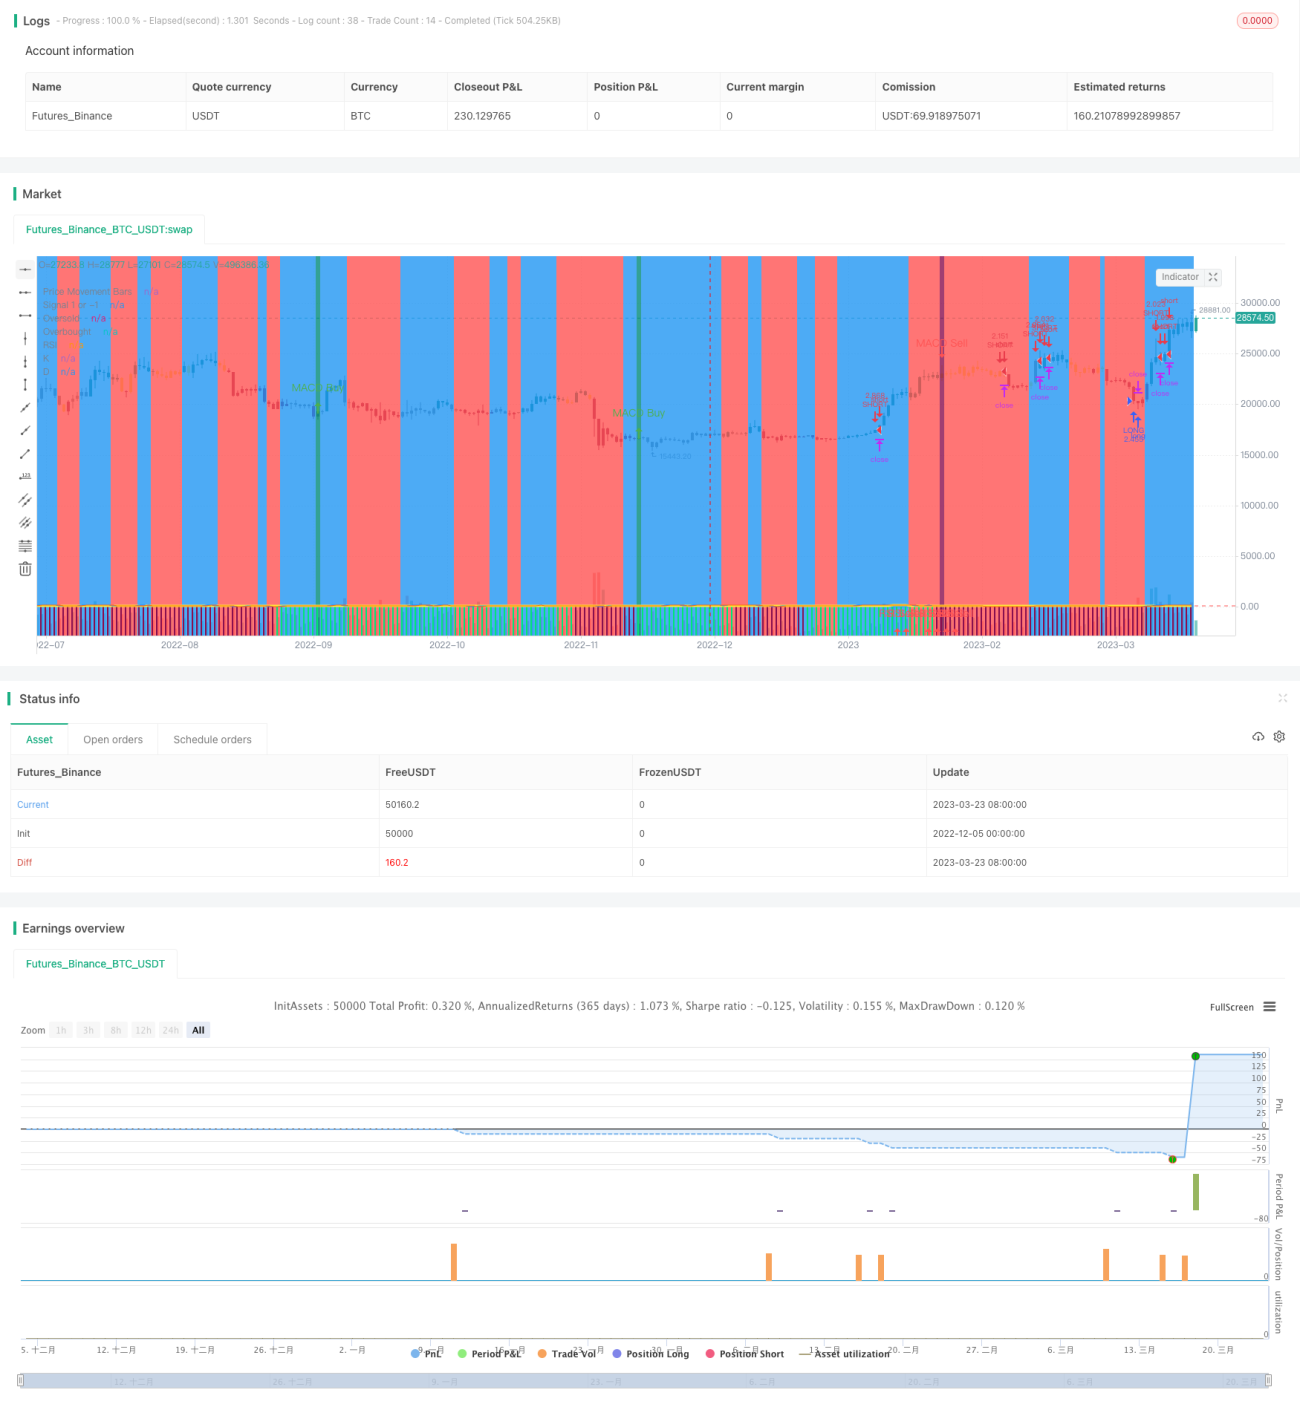
/*backtest
start: 2022-12-05 00:00:00
end: 2023-03-24 00:00:00
period: 1d
basePeriod: 1h
exchanges: [{"eid":"Futures_Binance","currency":"BTC_USDT"}]
*/

// This source code is subject to the terms of the Mozilla Public License 2.0 at https://mozilla.org/MPL/2.0/
//@version=4

strategy(shorttitle='Ain1',title='All in One Strategy', overlay=true, initial_capital = 1000, process_orders_on_close=true, default_qty_type = strategy.percent_of_equity, default_qty_value = 100, commission_type=strategy.commission.percent, commission_value=0.18, calc_on_every_tick=true)- 1