انٹرا ڈے ٹریڈنگ کلیدی پوائنٹ کی حکمت عملی


تخلیق کی تاریخ: 2023-12-07 16:43:17 آخر میں ترمیم کریں: 2023-12-07 16:43:17
کاپی: 0 کلکس کی تعداد: 707
1
پر توجہ دیں
1619
پیروکار

انٹرا ڈے ٹریڈنگ کلیدی پوائنٹ کی حکمت عملی

جائزہ

یہ ہندوستان کے دن کے اندر تجارت کرنے کی ایک کلیدی نقطہ حکمت عملی ہے ، جس میں اہم حمایت اور مزاحمت کے مقامات کا حساب لگانے کے لئے اوپن ، اونچائی ، کم قیمت اور اختتامی قیمتوں کا استعمال کیا جاتا ہے ، اور ان مقامات پر قیمتوں میں اضافے کی صورت میں تجارت کی جاتی ہے۔

حکمت عملی کا اصول

  1. پچھلے ٹریڈنگ دن کی کم سے کم قیمت، زیادہ سے زیادہ قیمت اور اختتامی قیمت کا حساب لگائیں
  2. بنیادی حمایت S1، مزاحمت R1 اور اہم نقطہ پی پی کے حساب سے فارمولہ
  3. جب قیمت ان اہم نکات سے تجاوز کر جاتی ہے تو زیادہ یا کم پوزیشن میں داخل ہوجائیں
  4. سٹاپ نقصان سے نکلنے کا طریقہ کار ترتیب دیں

بنیادی کلیدی نقطہ حساب کتاب کا فارمولا مندرجہ ذیل ہے:

PP = (最高价+最低价+收盘价)/3
R1 = 2*PP - 最低价  
S1 = 2*PP - 最高价

طاقت کا تجزیہ

  1. اہم نکات کا استعمال کرتے ہوئے اعلی امکانات کے ساتھ منافع کے مواقع کو بڑھانا
  2. اہم نکات کو آسانی سے طے کیا جاسکتا ہے ، اور ٹرانزیکشن کے اصول واضح ہیں
  3. اسٹاپ نقصان کا نقطہ آسانی سے طے کیا جاسکتا ہے اور خطرے کو مؤثر طریقے سے کنٹرول کیا جاسکتا ہے

خطرے کا تجزیہ

  1. اہم نکات پر جعلی توڑ پھوڑ کا خطرہ، نقصانات کا سبب بن سکتا ہے
  2. کلیدی نکات کی توثیق کی ضرورت ہوتی ہے اور ہر بار کام نہیں کرتی
  3. اسٹاپ نقصان کی غلط ترتیب سے نقصان میں اضافہ ہوسکتا ہے

خطرے سے نمٹنے کے طریقے:

  1. combining with other indicators to filter false breakouts
  2. backtesting to validate strategy over long timeframes
  3. optimize stop loss placement

اصلاح کی سمت

  1. دیگر تکنیکی اشارے کے ساتھ مل کر جعلی بریک سگنل کو فلٹر کرنا
  2. مختلف اقسام کے لئے پیرامیٹرز کو بہتر بنائیں
  3. متحرک ایڈجسٹمنٹ اسٹاپ نقصان

خلاصہ کریں۔

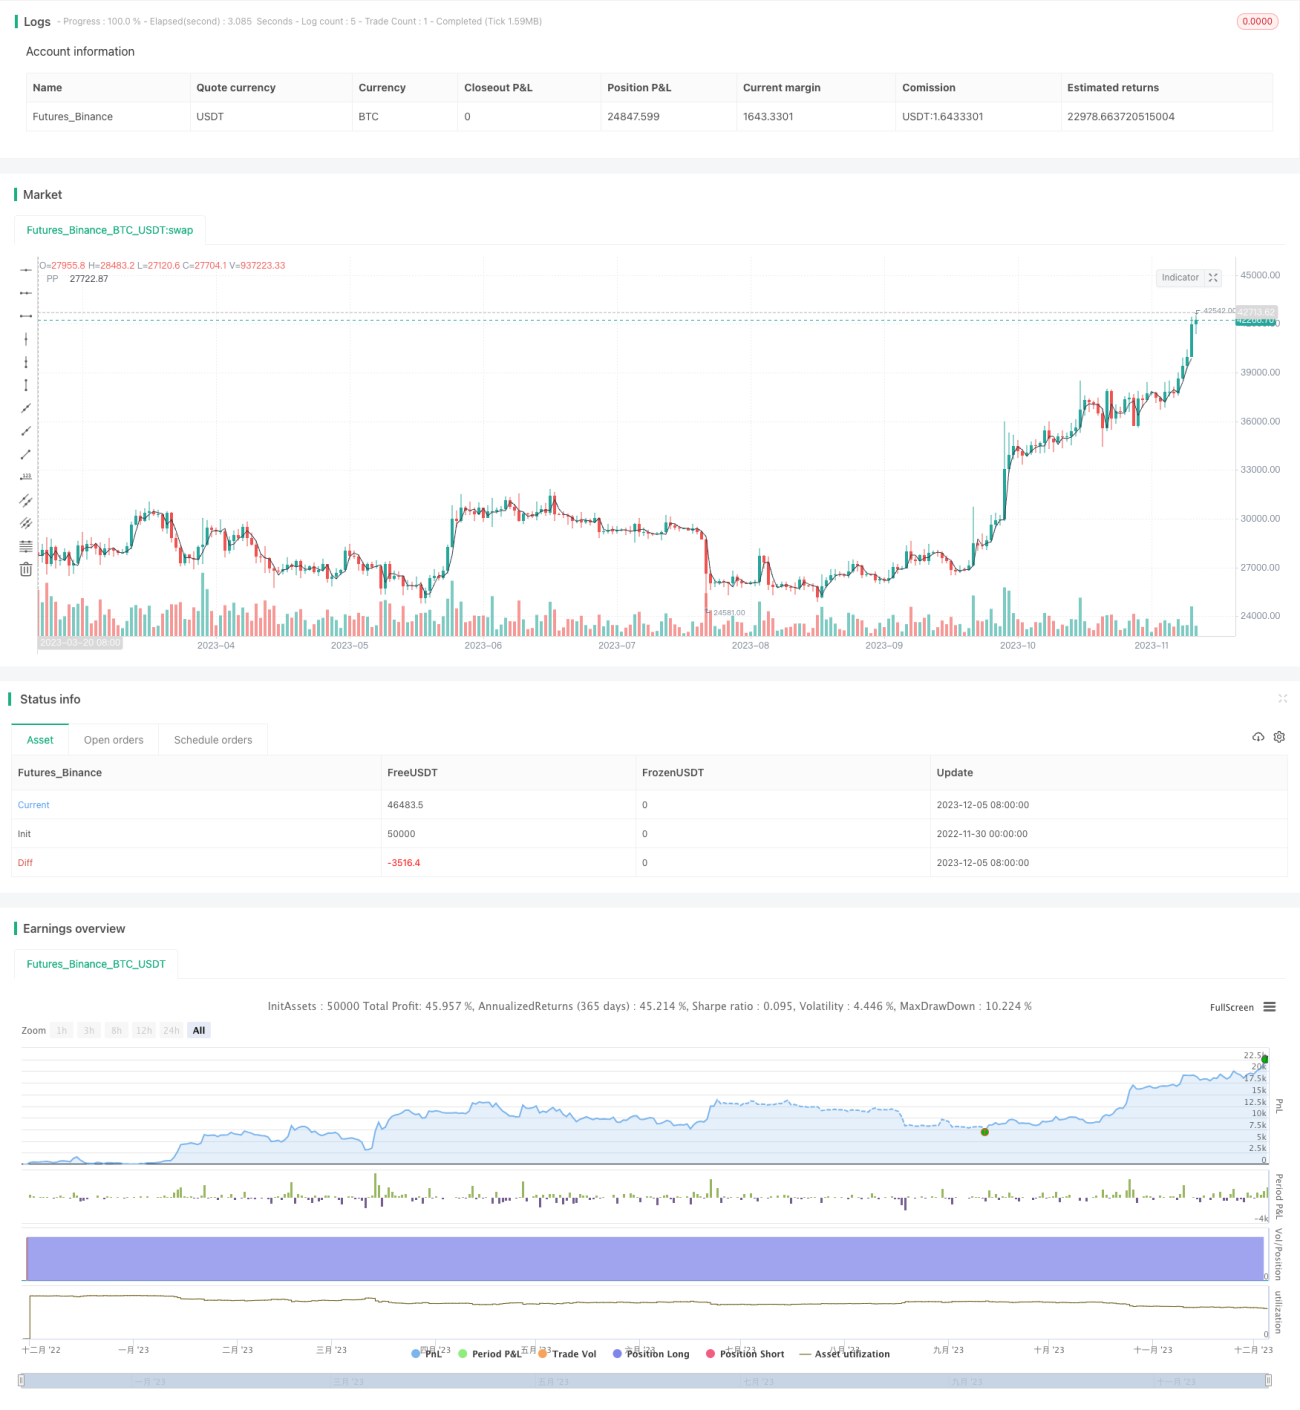
یہ حکمت عملی مجموعی طور پر آسان اور براہ راست ہے ، اور تاریخی اعداد و شمار کے ذریعہ اس کی تاثیر کو آسانی سے تصدیق کی جاسکتی ہے۔ ایک دن کی تجارت کی حکمت عملی کے طور پر ، اس نے اہم نکات کا استعمال کرتے ہوئے اعلی امکانات کی توڑ کی پیش کش کی ہے ، جس سے اچھے نتائج برآمد ہوسکتے ہیں۔ تاہم ، اہم نکات پر انحصار کرنے کی وجہ سے ، اس میں کچھ غلط توڑنے کا خطرہ بھی موجود ہے ، جس کو کم کرنے کے لئے مزید اصلاح کی ضرورت ہے۔ مجموعی طور پر ، یہ ایک دن کی تجارت کی حکمت عملی ہے جو آسانی سے قابل عمل ، خطرے سے قابو میں ہے۔

حکمت عملی کا ماخذ کوڈ
/*backtest
start: 2022-11-30 00:00:00
end: 2023-12-06 00:00:00
period: 1d
basePeriod: 1h
exchanges: [{"eid":"Futures_Binance","currency":"BTC_USDT"}]
*/

// This source code is subject to the terms of the Mozilla Public License 2.0 at https://mozilla.org/MPL/2.0/
// © arameshraju
//Reference credit goes to All


//@version=4
strategy("ARR-Pivote-India-Stategy",shorttitle="ARR-PP-Ind", overlay=true)

// This source code is subject to the terms of the Mozilla Public License 2.0 at https://mozilla.org/MPL/2.0/
// © arameshraju
//User Input
showPrevDayHighLow = input(false, title="Show previous day's High & Low(PDH/PDL)", type=input.bool)
showPivoteLine = input(true, title="Show Pivot Point(PP)", type=input.bool)
showPivoteR1Line = input(false, title="Show Pivot Point Resistance (R1)", type=input.bool)
showPivoteS1Line = input(false, title="Show Pivot Point Support (S1)", type=input.bool)
tradeLong = input(true, title="Trade on Long Entry", type=input.bool)
tradeShort = input(false, title="Trade on Short Entry", type=input.bool)
maxLoss = input(0.5, title="Max Loss on one Trade", type=input.float)
tradeOn=input(title="Trade base Level", type=input.string,
     options=["PP", "PDH", "PDL","R1","S1"], defval="PP")

sessSpec = input("0915-1530", title="Session time", type=input.session)

// Defaults
// Colors
cColor = color.black
rColor = color.red
sColor = color.green

// Line style & Transparency
lStyle = plot.style_line
lTransp = 35

// Get High & Low
getSeries(_e, _timeFrame) => security(syminfo.tickerid, _timeFrame, _e, lookahead=barmerge.lookahead_on) 

is_newbar(res, sess) =>
    t = time(res, sess)
    na(t[1]) and not na(t) or t[1] < t

newbar = is_newbar("375", sessSpec)
// Today's Session Start timestamp
y = year(timenow)
m = month(timenow)
d = dayofmonth(timenow)

// Start & End time for Today
start = timestamp(y, m, d, 09, 15)
end = start + 86400000


PrevDayHigh = getSeries(high[1], 'D')
PrevDayLow = getSeries(low[1], 'D')
PrevDayClose = getSeries(close[1], 'D')

PivoteLine=(PrevDayHigh+PrevDayLow+PrevDayClose) /3
PivoteR1=(PivoteLine*2) -PrevDayLow

PivoteS1=(PivoteLine*2) -PrevDayHigh

orbPrevDayOpen = getSeries(open[1], 'D')
orbPrevDayClose = getSeries(close[1], 'D')

// //Preview Day High line
// _pdh = line.new(start, PrevDayHigh, end, PrevDayHigh, xloc.bar_time, color=color.red, style=line.style_solid, width=2)
// line.delete(_pdh[1])
// _pdl = line.new(start, PrevDayLow, end, PrevDayLow, xloc.bar_time, color=color.green, style=line.style_solid, width=2)
// line.delete(_pdl[1])
// _Pp = line.new(start, PrevDayLow, end, PrevDayLow, xloc.bar_time, color=color.green, style=line.style_dashed, width=2)
// line.delete(_Pp[1])


// //Previous Day Low Line
// l_pdh = label.new(start, PrevDayHigh, text="PD", xloc=xloc.bar_time, textcolor=rColor, style=label.style_none)
// label.delete(l_pdh[1])
// l_pdl = label.new(start, PrevDayLow, text="PD", xloc=xloc.bar_time, textcolor=sColor, style=label.style_none)
// label.delete(l_pdl[1])

// //Pivote Line

// l_pp = label.new(start, PivoteLine, text="PP", xloc=xloc.bar_time, textcolor=color.black, style=label.style_none)
// label.delete(l_pp[1])
// l_R1 = label.new(start, PivoteR1, text="R1", xloc=xloc.bar_time, textcolor=color.fuchsia, style=label.style_none)
// label.delete(l_pp[1])
// l_SR = label.new(start, PivoteS1, text="S2", xloc=xloc.bar_time, textcolor=color.navy, style=label.style_none)
// label.delete(l_pp[1])


plot(showPrevDayHighLow?PrevDayHigh:na , title=' PDH', color=rColor)
plot(showPrevDayHighLow?PrevDayLow:na, title=' PDL', color=sColor)
plot(showPivoteLine?PivoteLine:na, title=' PP', color=color.black)
plot(showPivoteR1Line?PivoteR1:na, title=' R1', color=color.fuchsia)
plot(showPivoteS1Line?PivoteS1:na, title=' S1', color=color.navy)

// Today's Session Start timestamp
// Start & End time for Today
//endTime = timestamp(t, m, d, 15, 00)

tradeEventPrice= if string("PDH")==tradeOn 
    PrevDayHigh
else if string("PDL")==tradeOn
    PrevDayLow
else if string("R1")==tradeOn
    PivoteR1
else if string("S1")==tradeOn
    PivoteS1
else
    PivoteLine


//tradeEventPrice=PrevDayHigh

if (open < tradeEventPrice) and ( close >tradeEventPrice ) and ( hour < 13 ) and tradeLong
	strategy.entry("buy", strategy.long, 1, when=strategy.position_size <= 0)

if (open > tradeEventPrice) and ( close <tradeEventPrice ) and ( hour < 13 ) and  tradeShort
	strategy.entry("Sell", strategy.short, 1, when=strategy.position_size <= 0)

mxloss=orbPrevDayClose*maxLoss

strategy.exit("exit", "buy",  loss = mxloss) 
strategy.exit("exit", "Sell",  loss = mxloss) 


strategy.close_all(when =   hour == 15   , comment = "close all entries")