ملٹی فیکٹر اڈاپٹیو مومینٹم ٹریکنگ کی حکمت عملی

جائزہ
کثیر فیکٹر خود کار طریقے سے متحرک ٹریکنگ حکمت عملی مارکیٹ کے رجحانات اور اہم معاون مزاحمت کی سطح کی شناخت کرنے کے لئے متعدد تکنیکی اشارے کو مربوط کرکے کریپٹو کرنسیوں جیسے اعلی اتار چڑھاؤ والے اثاثوں پر خودکار تجارت کو ممکن بناتا ہے۔ اس حکمت عملی میں آر ایس آئی ، ایم اے سی ڈی ، اسٹوکاسٹک جیسے اشارے کا استعمال کرتے ہوئے خرید و فروخت کے وقت کا فیصلہ کیا جاتا ہے ، جبکہ قیمت میں تبدیلی کی فیصد کے ساتھ مل کر زیادہ درست شکل کی شناخت کی جاتی ہے۔
حکمت عملی کا اصول
ملٹی فیکٹر آڈاپٹیو موشن ٹریکنگ حکمت عملی کا بنیادی حصہ متعدد تکنیکی اشارے کے مربوط استعمال میں ہے۔ یہ حکمت عملی بنیادی طور پر مندرجہ ذیل اجزاء پر کام کرتی ہے۔
-
آر ایس آئی اشارے اوور بیو اور اوور سیل کا فیصلہ کرتا ہے۔ مختلف پیرامیٹرز کے ساتھ مل کر عام آر ایس آئی سگنل یا کونر آر ایس آئی سگنل کو بہتر بنانے کی نشاندہی کی جاسکتی ہے ، تاکہ یہ معلوم کیا جاسکے کہ واپسی کا موقع موجود ہے یا نہیں۔
-
MACD اشارے رجحان کی سمت کا تعین کرنے میں مدد کرتا ہے۔ جب MACD لائن کو عبور کرتا ہے یا سگنل لائن کو عبور کرتا ہے تو خریدنے اور بیچنے کے سگنل پیدا ہوتے ہیں۔
-
اسٹاکسٹک اشارے اوورلوڈ اوور سیل زون کی نشاندہی کرتا ہے۔ K لائن اور D لائن کا گولڈ فورک اور ڈیڈ فورک مجموعہ سگنل فیصلہ کرتا ہے کہ آیا اس کا رخ موڑ لیا گیا ہے۔
-
قیمت میں تبدیلی کا فیصد چیک کریں کہ آیا حقیقی توڑ ہے۔ کسی خاص دورانیے میں اعلی ترین قیمت ، کم ترین قیمت ، اختتامی قیمت وغیرہ میں تبدیلی کا فیصد حساب لگائیں ، فیصلہ کریں کہ آیا یہ حقیقی توڑ ہے۔
-
ای ایم اے اشارے بڑے پیمانے پر اوور ہاؤسنگ کا فیصلہ کرتے ہیں۔ تیز لائن پر سست لائن کو پائیڈ سگنل کے طور پر پار کریں ، اور نیچے کو پائیڈ سگنل کے طور پر۔
یہ حکمت عملی مارکیٹ کے زیادہ خالی حالت کے مطابق زیادہ سے زیادہ کاؤک آؤٹ کرنے کا انتخاب کرتی ہے ، اور پوزیشن میں داخل ہونے کے بعد اسٹاپ نقصان کا بندوبست کرتی ہے ، تاکہ خطرے کو مؤثر طریقے سے کنٹرول کیا جاسکے۔ جب الٹ سگنل ظاہر ہوتا ہے تو خالی پوزیشن چھوڑنے کا انتخاب کریں۔ فیصلہ سازی کے پورے عمل میں متعدد عوامل کے فیصلے کو بھرپور طور پر شامل کیا گیا ہے ، تاکہ زیادہ درست فیصلہ کیا جاسکے۔
طاقت کا تجزیہ
اس حکمت عملی کے درج ذیل فوائد ہیں:
-
ملٹی فیکٹر ڈرائیو میں فیصلہ کرنے کا فائدہ ہے۔ ایک ہی اشارے کے مقابلے میں ، ملٹی میٹرکس کا مجموعہ ایک دوسرے کی تصدیق کرسکتا ہے ، جس سے نتائج زیادہ درست اور قابل اعتماد ہوجاتے ہیں ، اور اس طرح غیر ضروری ٹرانزیکشن لاگت کو بچایا جاتا ہے۔
-
شرائط سختی سے غلط تجارت سے بچنے کے لئے۔ حکمت عملی نے خرید و فروخت کی شرائط کے لئے سخت تقاضے طے کیے ہیں ، جس میں متعدد اشارے ایک ساتھ سگنل جاری کرنے کی ضرورت ہوتی ہے ، تاکہ بہت سارے شور کو فلٹر کیا جاسکے اور غلط تجارت سے بچایا جاسکے۔
-
خود کو اپنانے سے ہیپر پیرامیٹرز میں انسانی مداخلت کو کم کیا جاتا ہے۔ حکمت عملی میں شامل اشارے کے پیرامیٹرز کو متحرک طور پر گننے کی صلاحیت ، حکمت عملی کے پیرامیٹرز کو زیادہ سائنسی مقصد بنانے کے لئے ہیپر پیرامیٹرز کی ذہنیت کو منتخب کرنے سے گریز کرتی ہے۔
-
اسٹاپ نقصان کی روک تھام کے طریقہ کار کا خطرہ کنٹرول کریں۔ حکمت عملی پوزیشن کھولنے کے بعد اصل وقت میں اسٹاپ نقصان کی روک تھام کی پوزیشن کا حساب لگاتی ہے اور اس کی نقشہ تیار کرتی ہے ، جس سے ایک ہی نقصان کو مؤثر طریقے سے کنٹرول کیا جاسکتا ہے ، اور پوزیشن کے پھوٹ پڑنے سے بچایا جاسکتا ہے۔
خطرے کا تجزیہ
اس حکمت عملی میں کچھ خطرات بھی ہیں جن سے بچنے کی ضرورت ہے:
-
اشارے کی غلطی سے سگنل جاری ہونے کا امکان۔ اگرچہ کثیر اشارے کی توثیق سے غلط سگنل کی شرح میں نمایاں کمی واقع ہوسکتی ہے ، لیکن اس کا امکان موجود ہے۔ اس سے غیر ضروری نقصان ہوسکتا ہے۔
-
اسٹاپ نقصان کے خلاف ورزی کا خطرہ۔ انتہائی حالات میں ، قیمتوں میں تیزی سے کمی واقع ہوسکتی ہے ، جس کی وجہ سے اصل اسٹاپ نقصان آسانی سے ٹوٹ جاتا ہے ، جس سے زیادہ نقصان ہوتا ہے۔
-
پیرامیٹرز کی اصلاح سے زیادہ سے زیادہ اصلاح۔ متحرک پیرامیٹرز ، اگرچہ مصنوعی انتخاب سے متعلق موضوعیت سے بچنے کے باوجود ، پیرامیٹرز کی ضرورت سے زیادہ اصلاح کی وجہ سے عام کرنے کی صلاحیت کو ضائع کرسکتے ہیں۔
اس کا حل کیا ہے؟
- سگنل فلٹرنگ کی شرائط کی سختی کو بڑھانا ، غلط سگنل کی شرح کو کم کرنا
- اسٹورز کو ایک ہی وقت میں زیادہ نقصان سے بچنے کے لئے، اس طرح کے طور پر استعمال کیا جاتا ہے.
- ٹیسٹ کے نمونے کی مقدار میں اضافہ، پیرامیٹرز کی استحکام کا سخت جائزہ لیا۔
حکمت عملی کی اصلاح کی سمت
ملٹی فیکٹر ایڈاپٹیو موٹ ٹریسنگ حکمت عملی میں مندرجہ ذیل کئی قابل اصلاح جہتیں ہیں:
-
فیصلہ کرنے والے عوامل کی تعداد میں اضافہ کریں۔ مزید مختلف اقسام کے اشارے سگنل فیصلے ، جیسے اتار چڑھاؤ کی شرح ، تجارت کا حجم وغیرہ کے معاون فیصلے کے ساتھ۔
-
اسٹاپ نقصان کے طریقہ کار کو بہتر بنانے کے لئے الگورتھم۔ مزید اعلی درجے کی اسٹاپ نقصان کے الگورتھم جیسے ٹریکنگ اسٹاپ ، شاک اسٹاپ متعارف کروائے جاسکتے ہیں ، جس سے اسٹاپ نقصان کے خلاف ورزی کی امکانات کو مزید کم کیا جاسکتا ہے۔
-
مشین لرننگ ماڈل متعارف کروانا۔ آر این این ، ایل ایس ٹی ایم اور دیگر ماڈلز کا استعمال کرتے ہوئے تاریخی اعداد و شمار کو ماڈلنگ کرنا ، جو خرید و فروخت کے فیصلے میں معاون ہے۔
-
حکمت عملی انضمام۔ متعدد ذیلی حکمت عملیوں کو اپنانے اور انضمام کے ل integrated انضمام کے ل integrated انضمام کے ل integrated انضمام کے ل integrated انضمام کے ل integrated انضمام کے ل integrated انضمام کے ل more زیادہ مستحکم مجموعی کارکردگی حاصل کی جاسکتی ہے۔
خلاصہ کریں۔
کثیر عنصر خود کار طریقے سے متحرک ٹریکنگ حکمت عملی کو متعدد تکنیکی اشارے کا استعمال کرتے ہوئے خرید و فروخت کے وقت کی نشاندہی کی گئی ہے۔ یہ حکمت عملی ایک ہی اشارے کے مقابلے میں زیادہ درست ہے ، جبکہ خود کار طریقے سے موافقت اور روکنے کے طریقہ کار کے خطرات پر قابو پانے والے پیرامیٹرز ہیں۔ مزید معاون فیصلہ کن عوامل ، اعلی درجے کی روک تھام کے الگورتھم اور مشین لرننگ جیسے طریقوں کو متعارف کرانے کے ذریعہ اس حکمت عملی کی تاثیر کو مزید بڑھا دیا جاسکتا ہے۔
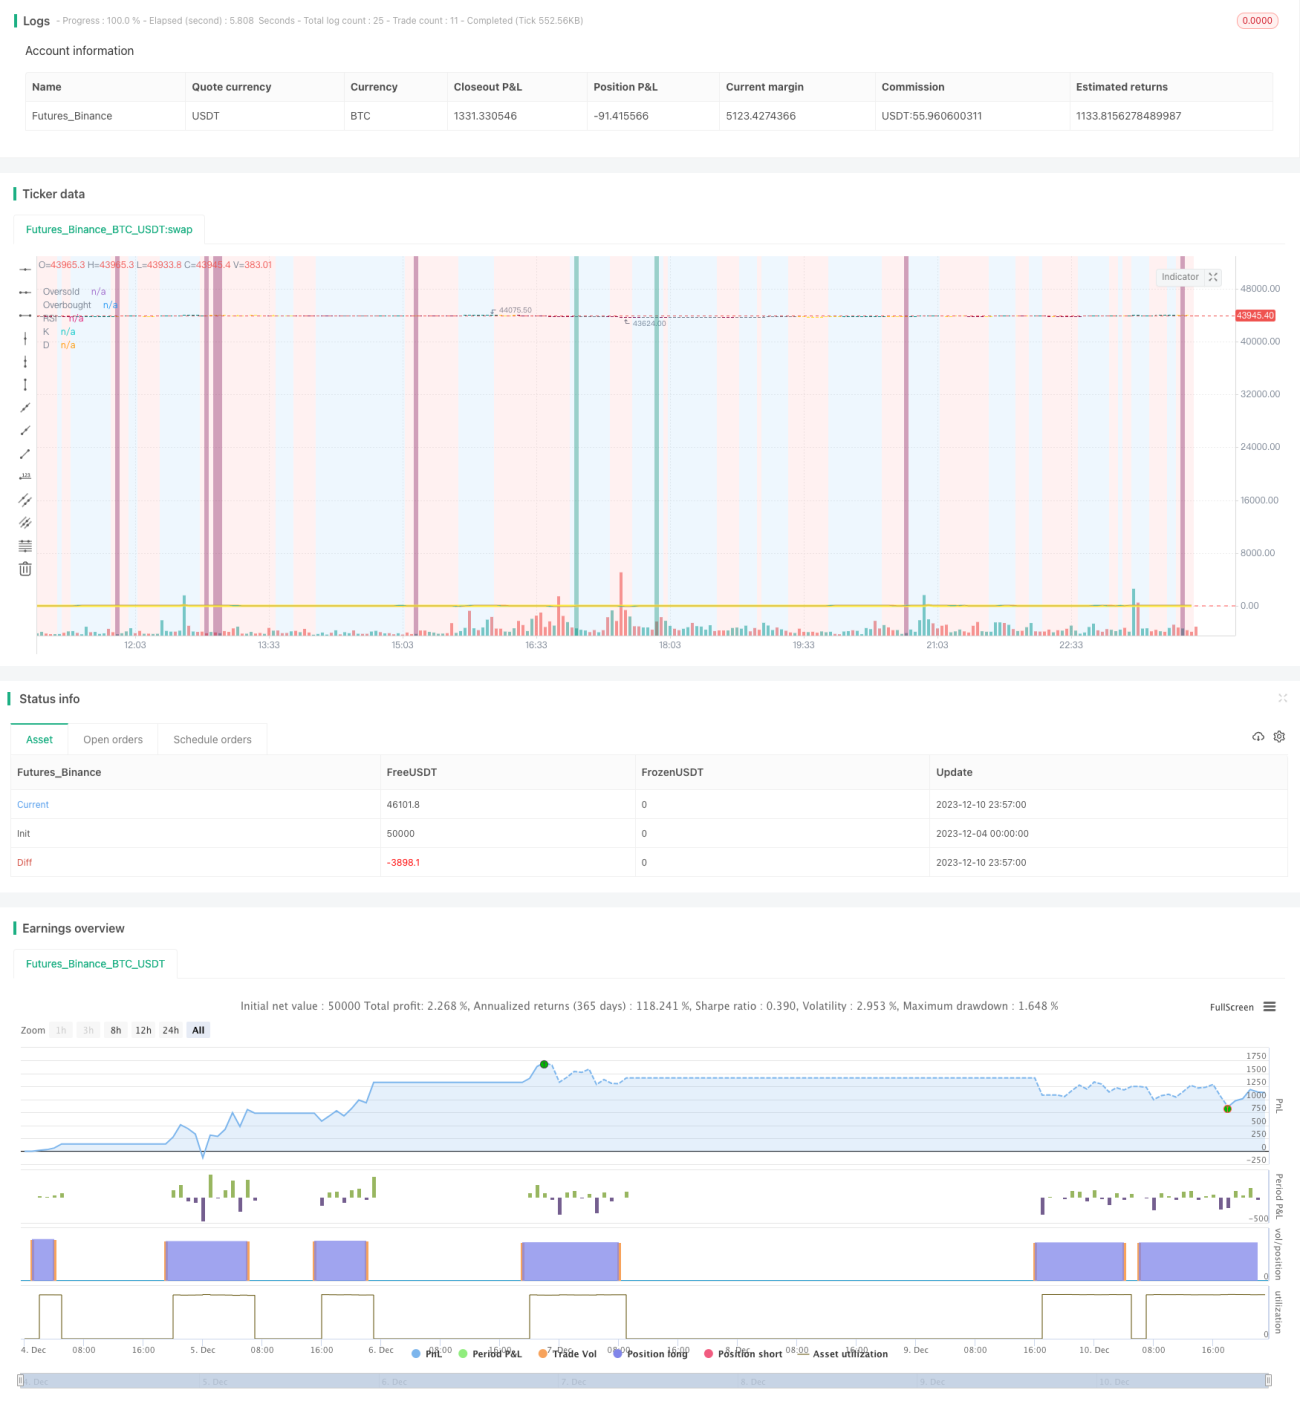
/*backtest
start: 2023-12-04 00:00:00
end: 2023-12-11 00:00:00
period: 3m
basePeriod: 1m
exchanges: [{"eid":"Futures_Binance","currency":"BTC_USDT"}]
*/

// This source code is subject to the terms of the Mozilla Public License 2.0 at https://mozilla.org/MPL/2.0/
//@version=4

// ██████╗██████╗ ███████╗ █████╗ ████████╗███████╗██████╗ ██████╗ ██╗ ██╗ - 1