MACD اشارے پر مبنی ڈبل موونگ ایوریج ٹریڈنگ حکمت عملی

1
Follow
1779
Followers
جائزہ
اس حکمت عملی کا نام ہےMACD ڈبل مساوی لائن ٹریکنگ حکمت عملی، MACD اشارے کی دوہری مساوی لکیری فاریکس ڈاٹ فورکس کو ٹریڈنگ سگنل کے طور پر استعمال کرتے ہوئے ، اسٹاک کی قیمتوں میں شارٹ لائن کی نقل و حرکت کو ٹریک کرنے کے لئے کل کی کم ترین قیمت کو روکنے کے طور پر استعمال کرتے ہوئے۔
حکمت عملی کا اصول
- EMA ((close،5) ، EMA ((close،8) ، اور سگنل لائن SMA ((MACD،3) کا حساب لگائیں
- کثیر سر سگنل کی وضاحت: تیز لائن پر سست لائن کو عبور کرتے وقت زیادہ کام کریں
- خالی سر سگنل کی وضاحت کریں: تیز لائن کے نیچے سست لائن کو توڑیں یا کل کی کم ترین قیمت سے کم قیمت پر دن کے اختتامی قیمت پر خالی کریں
- $ 2000 کی ابتدائی سرمایہ کاری کی حد اختتامی قیمت پر تقسیم
- کثیر ہیڈ سٹاپ نقصان کا استعمال کرتے ہوئے خالی ہیڈ سگنل پلائزر
طاقت کا تجزیہ
- MACD اشارے کا استعمال کرتے ہوئے اوورلوڈ اوورلوڈ علاقوں کا تعین کرنے کے لئے ، اور جڑواں مساوی لائنوں کے ساتھ مل کر ٹریڈنگ سگنل بنانے کے لئے ، جعلی توڑ سے بچنے کے لئے
- مختصر مدت کے رجحانات کا سراغ لگانا اور وقت پر نقصانات کو روکنا
- ہولڈنگ میں متحرک ایڈجسٹمنٹ ، ایک سے زیادہ نقصانات سے بچنے کے لئے
خطرے کا تجزیہ
- MACD انڈیکیٹر میں تاخیر ، ممکنہ طور پر شارٹ لائن کا موقع ضائع کرنا
- ڈبل لائن ٹریڈنگ سگنل جعلی سگنل پیدا کرسکتے ہیں
- اسٹاپ نقصان کا نقطہ بہت زیادہ شدت پسند ہے اور اس کا امکان ہے کہ اس میں زیادہ بار بار نقصان ہو
اصلاح کی سمت
- MACD پیرامیٹرز کے مجموعے کو بہتر بنانے اور اشارے کی حساسیت کو بہتر بنانا
- رجحانات کا اندازہ لگانے کے لئے اور مارکیٹ میں ہلچل پیدا کرنے سے بچنے کے لئے
- مارکیٹ میں اتار چڑھاؤ کی پیمائش کرنے کے لئے وولٹیٹی انڈیکس کے ساتھ مل کر اسٹاپ نقصان کو ایڈجسٹ کریں
خلاصہ کریں۔
اس حکمت عملی میں کلاسیکی MACD ڈبل مساوی لائن مجموعہ اشارے کا استعمال کیا گیا ہے تاکہ اوورلوپ اوورلوپ کی حد کا تعین کیا جاسکے ، تجارتی سگنل پیدا کیا جاسکے ، جبکہ متحرک ہولڈنگ کی مقدار اور پچھلے دن کی سب سے کم قیمت کے اسٹاپ نقصان کے ڈیزائن کو متعارف کرایا گیا ہے۔ اسٹاک کی قیمتوں میں مختصر لہر لہر کی خصوصیات کو پکڑنے کے لئے ، مجموعی حکمت عملی کا نظریہ واضح اور سمجھنے میں آسان ہے ، مزید جانچ اور اصلاح کے قابل ہے۔
Source
Pine
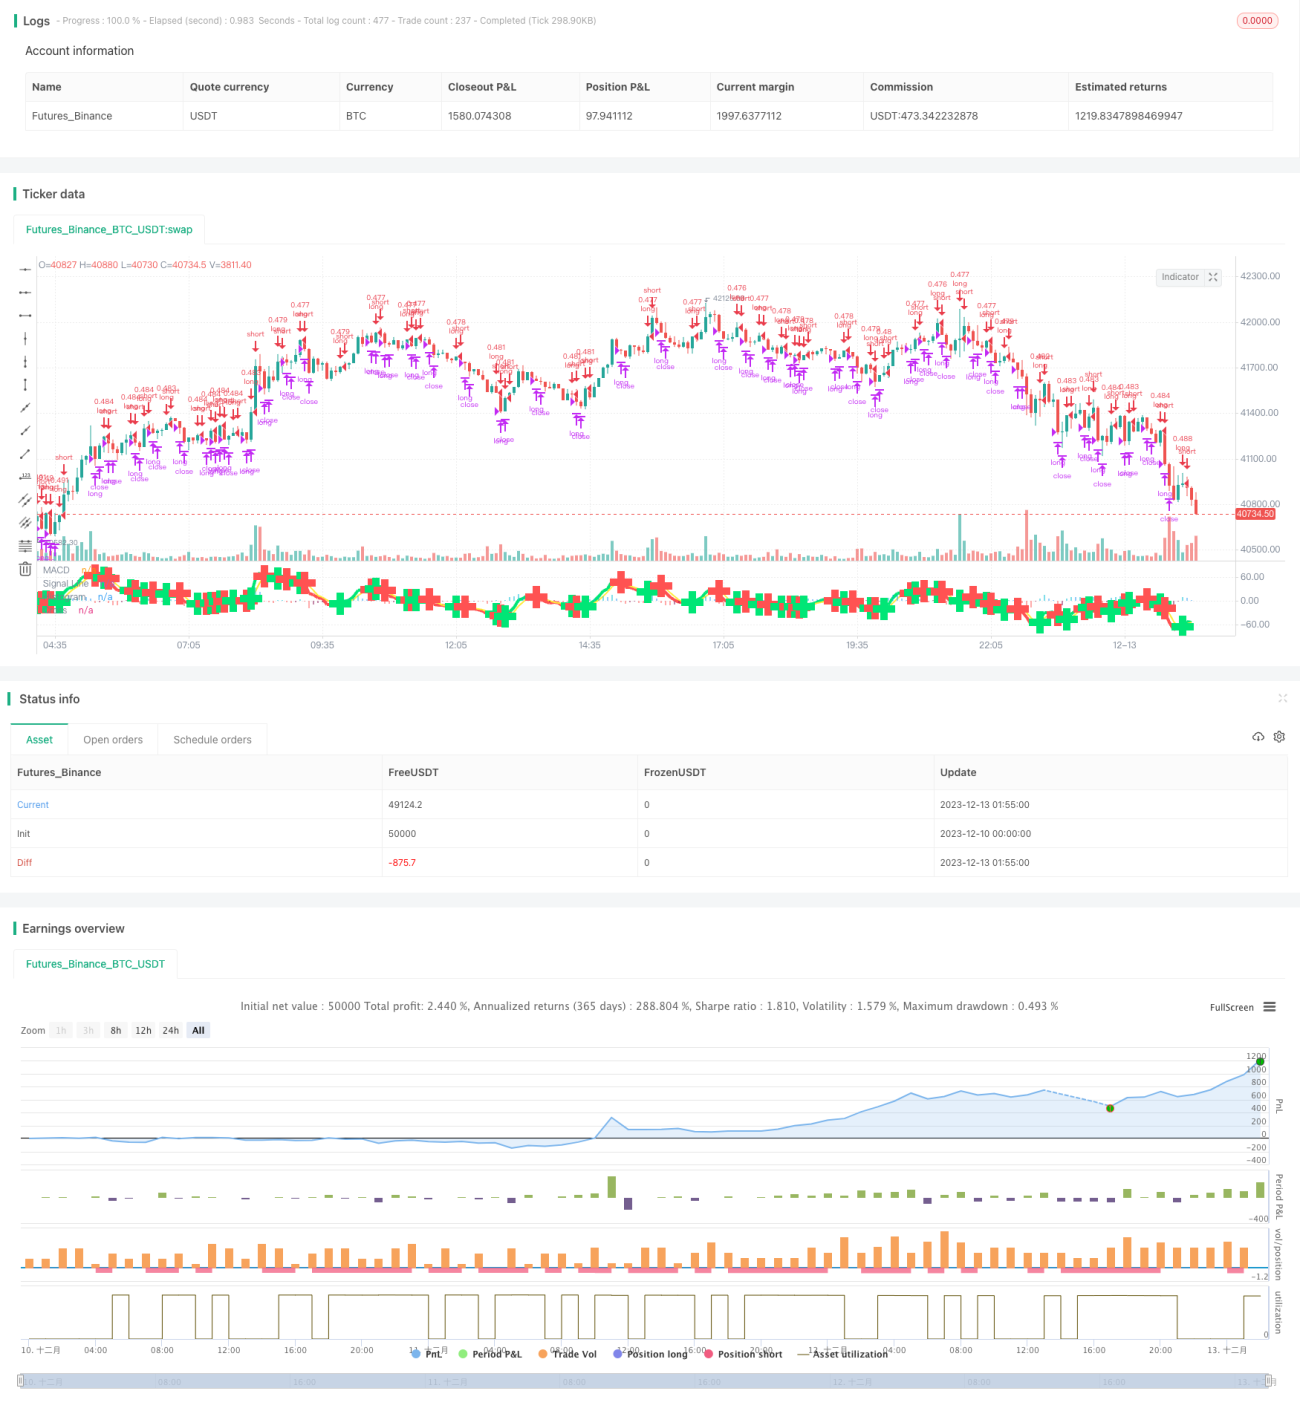
/*backtest
start: 2023-12-10 00:00:00
end: 2023-12-13 02:00:00
period: 5m
basePeriod: 1m
exchanges: [{"eid":"Futures_Binance","currency":"BTC_USDT"}]
*/

//@version=2
// macd/cam v1 strategizing Chris Moody Macd indicator https://www.tradingview.com/script/OQx7vju0-MacD-Custom-Indicator-Multiple-Time-Frame-All-Available-Options/
// macd/cam v2 changing to macd 5,8,3
// macd/cam v2.1 Strategy parameters
Related strategies
Comment
All comments (0)
No data
- 1