
اس حکمت عملی پر مبنی ہے سپر رجحان اشارے اور ٹریکنگ سٹاپ نقصان کے لئے پوزیشن کھولنے اور پوزیشن پر امن. یہ استعمال کرتا ہے 4 الارم کھولنے کے لئے پوزیشن پر امن اور سپر رجحان کی حکمت عملی کو اپنانے. اس حکمت عملی کو خاص طور پر روبوٹ ڈیزائن کے لئے ڈیزائن کیا گیا ہے اور اس میں ٹریکنگ سٹاپ نقصان ہے۔
یہ حکمت عملی اے ٹی آر اشارے کا استعمال کرتی ہے جس میں اوپر اور نیچے کا حساب لگایا جاتا ہے۔ جب بند ہونے والی قیمت ٹریک کو توڑتی ہے تو خریدنے کا اشارہ پیدا ہوتا ہے ، اور جب ٹریک کو توڑتی ہے تو فروخت کا اشارہ پیدا ہوتا ہے۔ حکمت عملی میں رجحان کی سمت کا تعین کرنے کے لئے سپر ٹرینڈ لائن کا بھی استعمال کیا جاتا ہے۔ جب سپر ٹرینڈ لائن پر عبور ہوتا ہے تو ، بیل کا بازار شروع ہوتا ہے۔ جب سپر ٹرینڈ لائن کے نیچے سے گزرتا ہے تو ، ریچھ کا بازار شروع ہوتا ہے۔ حکمت عملی سگنل پیدا کرنے کے وقت پوزیشن کھولتی ہے ، جبکہ ابتدائی اسٹاپ نقصان کی قیمت کا تعین کرتی ہے۔ اس کے بعد قیمت کی تبدیلی کے مطابق اسٹاپ نقصان کی قیمت کو ایڈجسٹ کرنے کے لئے ٹریک کیا جاتا ہے ، جس سے منافع کو لاک کیا جاسکتا ہے ، اور اس کے نتیجے میں اسٹاپ نقصان کا اثر حاصل ہوتا ہے۔
اس حکمت عملی میں ٹرینڈ کی سمت کا تعین کرنے کے لئے ایک ٹرانس ٹرینڈ اشارے اور اے ٹی آر اشارے کے ساتھ اسٹاپ نقصانات کا تعین کرنے کے فوائد شامل ہیں ، جو جعلی توڑ کو مؤثر طریقے سے فلٹر کرسکتے ہیں۔ ٹریکنگ اسٹاپس منافع کو اچھی طرح سے لاک کرسکتے ہیں اور واپسی کو کم کرسکتے ہیں۔ اس کے علاوہ ، یہ حکمت عملی خاص طور پر روبوٹ کے لئے ڈیزائن کی گئی ہے ، جو تجارت کو خودکار کرسکتی ہے۔
جب اسٹاپ قیمت میں بڑی ایڈجسٹمنٹ ہوتی ہے تو ، اسٹاپ نقصان کو مارنے کے امکانات بڑھ جاتے ہیں۔ اس کے علاوہ ، روبوٹ ٹریڈنگ کو سرور کے حادثے ، نیٹ ورک کی خرابی اور دیگر تکنیکی خطرات کا بھی سامنا کرنا پڑتا ہے۔
غلط سگنل کے امکان کو کم کرنے کے لئے ، اے ٹی آر پیرامیٹرز کو مناسب طریقے سے ایڈجسٹ کیا جاسکتا ہے یا فلٹرنگ کے لئے دوسرے اشارے شامل کیے جاسکتے ہیں۔ اسٹاپ لاس ٹریکنگ کی وسعت کو ایڈجسٹ کرنے کے لئے منافع اور خطرے کو متوازن کرنا ضروری ہے۔ تکنیکی خرابی کے خطرے سے بچنے کے لئے بیک اپ سرورز اور نیٹ ورکس کی تیاری کریں۔
اس حکمت عملی کو مندرجہ ذیل پہلوؤں میں بہتر بنایا جاسکتا ہے:
غلط سگنل سے بچنے کے لئے انٹری سگنل کو فلٹر کرنے کے لئے اشارے یا شرائط شامل کریں۔ مثال کے طور پر ، MACD اشارے شامل کیے جاسکتے ہیں۔
ATR پیرامیٹرز کے مختلف مجموعوں کی جانچ کی جا سکتی ہے تاکہ بہترین پیرامیٹرز کو تلاش کیا جا سکے۔
اسٹاپ لاسٹ ٹریکنگ کی حد کو بہتر بنانے اور بہترین توازن کا پتہ لگانے کے لئے۔
اس کے علاوہ، آپ کو زیادہ سے زیادہ سٹاپ نقصان کی قیمتوں میں اضافہ کر سکتے ہیں.
مرکزی سرور کی خرابی کی صورت میں فوری طور پر سوئچ کرنے کے لئے ایک مرکزی بیک اپ دوہری سرور فن تعمیر قائم کیا جا سکتا ہے.
اس حکمت عملی میں ٹرینڈ اشارے اور ٹریک اسٹاپ نقصانات کے فوائد کو مربوط کیا گیا ہے ، جس سے پوزیشن کھولنے اور روکنے کو خودکار بنایا جاسکتا ہے۔ ریئل اسٹیک میں اصلاحی سمت میں بہتری لانے والے اقدامات کو مل کر ، یہ ایک بہت ہی عملی مقدار کی تجارت کی حکمت عملی بن سکتی ہے۔
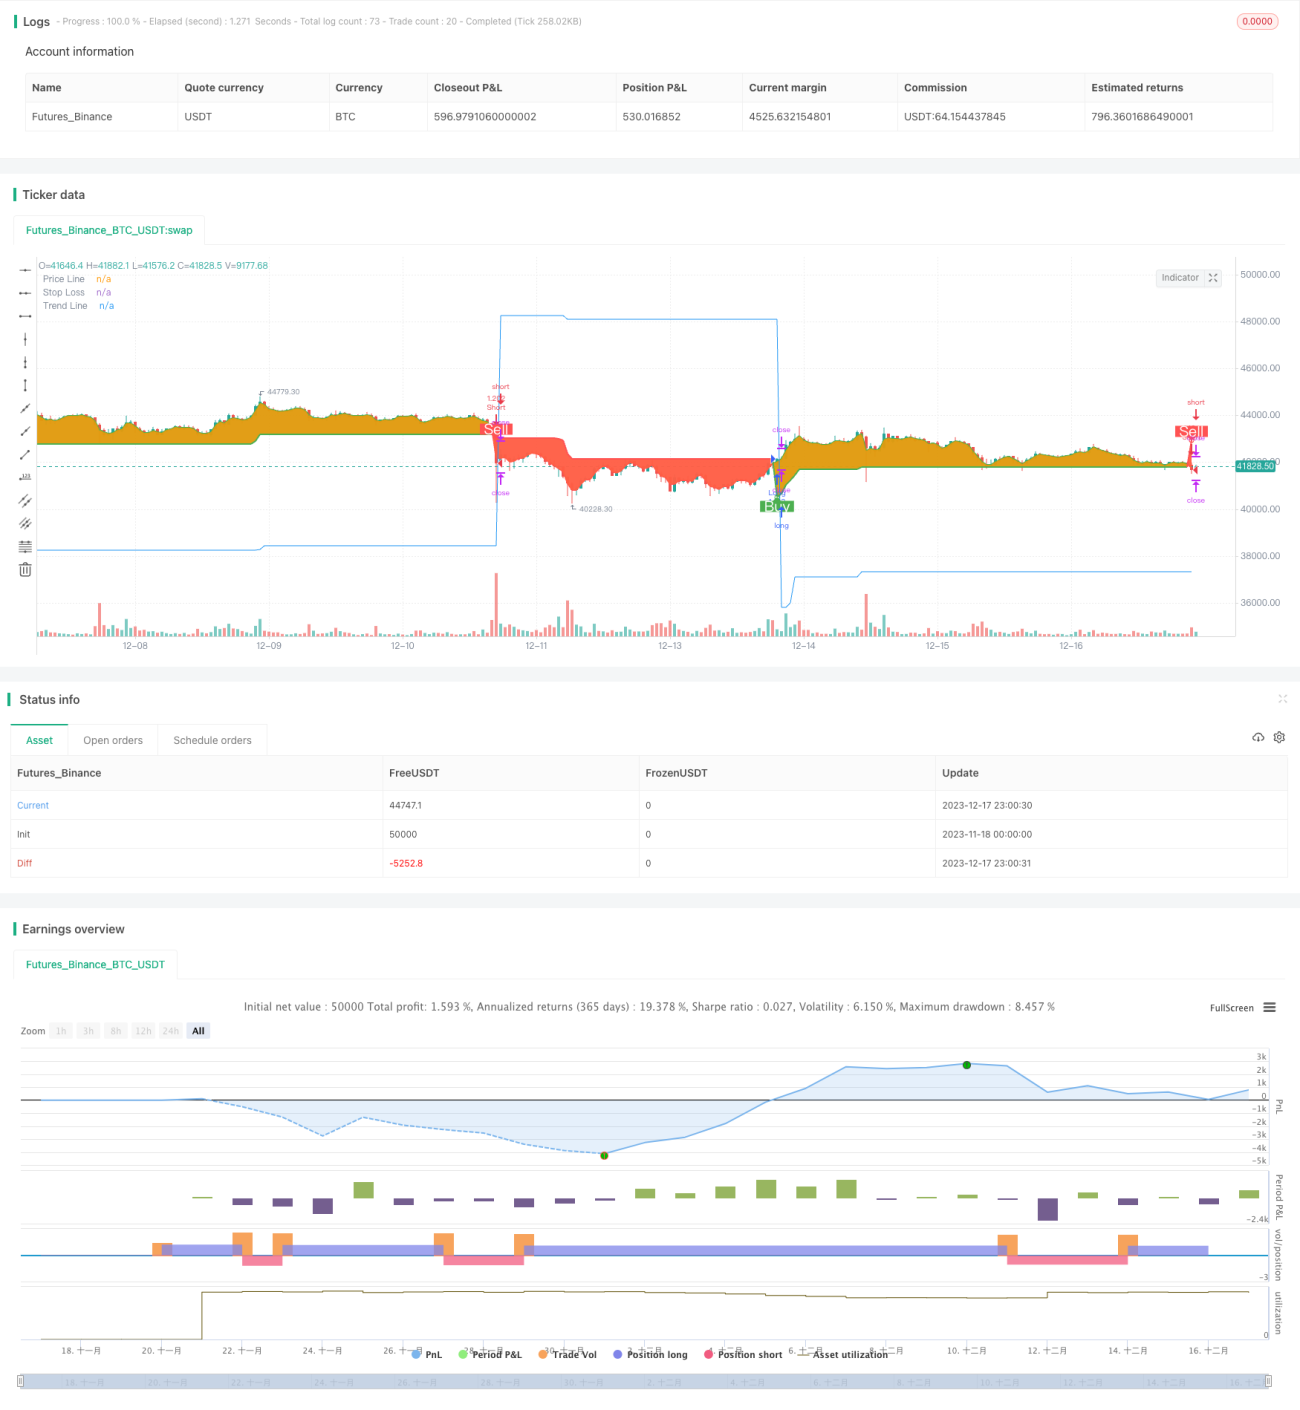
/*backtest
start: 2023-11-18 00:00:00
end: 2023-12-18 00:00:00
period: 1h
basePeriod: 15m
exchanges: [{"eid":"Futures_Binance","currency":"BTC_USDT"}]
*/
// This source code is subject to the terms of the Mozilla Public License 2.0 at https://mozilla.org/MPL/2.0/
// © arminomid1375
//@version=5
strategy('Mizar_BOT_super trend', overlay=true, default_qty_value=100, currency=currency.USD, default_qty_type=strategy.percent_of_equity, initial_capital=100, max_bars_back=4000)
//===== INPUTS ==========================================================================//
factor = input.float(4.5, title='ATR Factor', step=0.1,group = 'ATR')
period = input.int(59, minval=1, maxval=100, title='ATR Period',group = 'ATR')
up = (high + low) / 2 - factor * ta.atr(period)
down = (high + low) / 2 + factor * ta.atr(period)
trend_up = 0.0
trend_up := close[1] > trend_up[1] ? math.max(up, trend_up[1]) : up
trend_down = 0.0
trend_down := close[1] < trend_down[1] ? math.min(down, trend_down[1]) : down
trend = 0.0
trend := close > trend_down[1] ? 1 : close < trend_up[1] ? -1 : nz(trend[1], 1)
tsl = trend == 1 ? trend_up : trend_down
line_color = trend == 1 ? 'green' : 'red'
long_signal = trend == 1 and trend[1] == -1
short_signal = trend == -1 and trend[1] == 1
background = true
//ss = input.float(defval=15.0, minval=0.0, title=' stop loss %',group = 'stop loss')
use_sl = input(title='trailing stop ?', defval=true,group = 'stop loss')
initial_sl_pct = input.float(defval=15.0, minval=0.0, title='trailing stop %',group = 'stop loss')
Tpactive1 = input(title='Take profit1 On/Off ?', defval=true, group='take profit')
tp1percent = input.float(5.0, title='TP1 %', group='take profit') *100
tp1amt = input.int(10, title='TP1 Amount %', group='take profit')
Tpactive2 = input(title='Take profit2 On/Off ?', defval=true, group='take profit')
tp2percent = input.float(10, title='TP2 %', group='take profit') *100
tp2amt = input.int(15, title='TP2 Amount %', group='take profit')
Tpactive3 = input(title='Take profit3 On/Off ?', defval=true, group='take profit')
tp3percent = input.float(15, title='TP3 %', group='take profit')*100
tp3amt = input.int(20, title='TP3 Amount %', group='take profit')
//===== TIMEFRAME ==========================================================================//
from_month = input.int(defval=1, title='From Month', minval=1, maxval=12)
from_day = input.int(defval=1, title='From Day', minval=1, maxval=31)
from_year = input.int(defval=2019, title='From Year', minval=2017)
to_month = input.int(defval=1, title='To Month', minval=1, maxval=12)
to_day = input.int(defval=1, title='To Day', minval=1, maxval=31)
to_year = input.int(defval=9999, title='To Year', minval=2017)
start = timestamp(from_year, from_month, from_day, 00, 00)
finish = timestamp(to_year, to_month, to_day, 23, 59)
window() =>
time >= start and time <= finish ? true : false
//===== PLOTS ==========================================================================//
// Line
line_plot = plot(tsl, color=trend == 1 ? color.green : color.red, linewidth=2, title='Trend Line')
// Labels
plotshape(long_signal and window() ? up : na, title='Buy', text='Buy', location=location.absolute, style=shape.labelup, size=size.normal, color=color.new(color.green, 0), textcolor=color.new(color.white, 0))
plotshape(short_signal and window() ? down : na, title='Sell', text='Sell', location=location.absolute, style=shape.labeldown, size=size.normal, color=color.new(color.red, 0), textcolor=color.new(color.white, 0))
// Circles
plotshape(long_signal and window() ? up : na, title='Uptrend starts', location=location.absolute, style=shape.circle, size=size.tiny, color=color.new(color.green, 0))
plotshape(short_signal and window() ? down : na, title='Downtrend starts', location=location.absolute, style=shape.circle, size=size.tiny, color=color.new(color.red, 0))
// Background
long_fill = background ? trend == 1 ? color.green : na : na
short_fill = background ? trend == -1 ? color.red : na : na
candle_plot = plot(ohlc4, title='Price Line', color=trend == 1 ? long_fill : short_fill, linewidth=2, transp=90)
fill(candle_plot, line_plot, title='Long Background', color=long_fill, transp=90)
fill(candle_plot, line_plot, title='Short Background', color=short_fill, transp=90)
//===== GLOBAL ==========================================================================//
var entry_price = 0.0
var updated_entry_price = 0.0
var sl_price = 0.0
longString = "Input your custom alert message here.\nAnd put {{strategy.order.alert_message}} in the message box."
longclose = "Input your custom alert message here.\nAnd put {{strategy.order.alert_message}} in the message box."
shortString = "Input your custom alert message here.\nAnd put {{strategy.order.alert_message}} in the message box."
shortclose = "Input your custom alert message here.\nAnd put {{strategy.order.alert_message}} in the message box."
longAlertMessage = input(title="Long Alert Message", defval="long", group="Alert Messages", tooltip=longString)
longcloseAlertMessage = input(title="Long close Alert Message", defval="long", group="Alert Messages", tooltip=longclose)
shortAlertMessage = input(title="Short Alert Message", defval="short", group="Alert Messages", tooltip=shortString)
shortcloseAlertMessage = input(title="Short close Alert Message", defval="short", group="Alert Messages", tooltip=shortclose)
has_open_trade() =>
strategy.position_size != 0
has_no_open_trade() =>
strategy.position_size == 0
is_long() =>
strategy.position_size > 0 ? true : false
is_short() =>
strategy.position_size < 0 ? true : false
plot(use_sl ? has_no_open_trade() ? close : sl_price : na, color=has_no_open_trade() ? na : color.blue, title='Stop Loss')
strategy_close() =>
if is_long()
strategy.close('Long')
alert(longcloseAlertMessage)
if is_short()
strategy.close('Short')
alert(shortcloseAlertMessage)
strategy_long() =>
strategy.entry('Long', strategy.long)
strategy_short() =>
strategy.entry('Short', strategy.short)
sl_pct = initial_sl_pct
if long_signal or is_long() and not(short_signal or is_short())
sl_pct := initial_sl_pct * -1
sl_pct
//===== STRATEGY ==========================================================================//
crossed_sl = false
if is_long() and use_sl
crossed_sl := close <= sl_price
crossed_sl
if is_short() and use_sl
crossed_sl := close >= sl_price
crossed_sl
terminate_operation = window() and has_open_trade() and crossed_sl
if terminate_operation and not(long_signal or short_signal) // Do not close position if trend is flipping anyways.
entry_price := 0.0
updated_entry_price := entry_price
sl_price := 0.0
strategy_close()
start_operation = window() and (long_signal or short_signal)
if start_operation
entry_price := close
updated_entry_price := entry_price
sl_price := entry_price + entry_price * sl_pct / 100
if long_signal
strategy_long()
if Tpactive1==true
strategy.exit('TPL1','Long', qty_percent=tp1amt,profit =tp1percent)
alert(shortcloseAlertMessage)
alert(longAlertMessage)
if short_signal
strategy_short()
if Tpactive1==true
strategy.exit('TPL1','Short', qty_percent=tp1amt,profit =tp1percent)
alert(longcloseAlertMessage)
alert(shortAlertMessage)
//===== TRAILING ==========================================================================//
if is_long() and use_sl
strategy_pct = (close - updated_entry_price) / updated_entry_price * 100.00
if strategy_pct > 1
sl_pct += strategy_pct - 1.0
new_sl_price = updated_entry_price + updated_entry_price * sl_pct / 100
sl_price := math.max(sl_price, new_sl_price)
updated_entry_price := sl_price
updated_entry_price
if is_short() and use_sl
strategy_pct = (close - updated_entry_price) / updated_entry_price * 100.00
if strategy_pct < -1
sl_pct += strategy_pct + 1.0
new_sl_price = updated_entry_price + updated_entry_price * sl_pct / 100
sl_price := math.min(sl_price, new_sl_price)
updated_entry_price := sl_price
updated_entry_price