دوہری اشارے ہائبرڈ مقداری تجارتی حکمت عملی

جائزہ
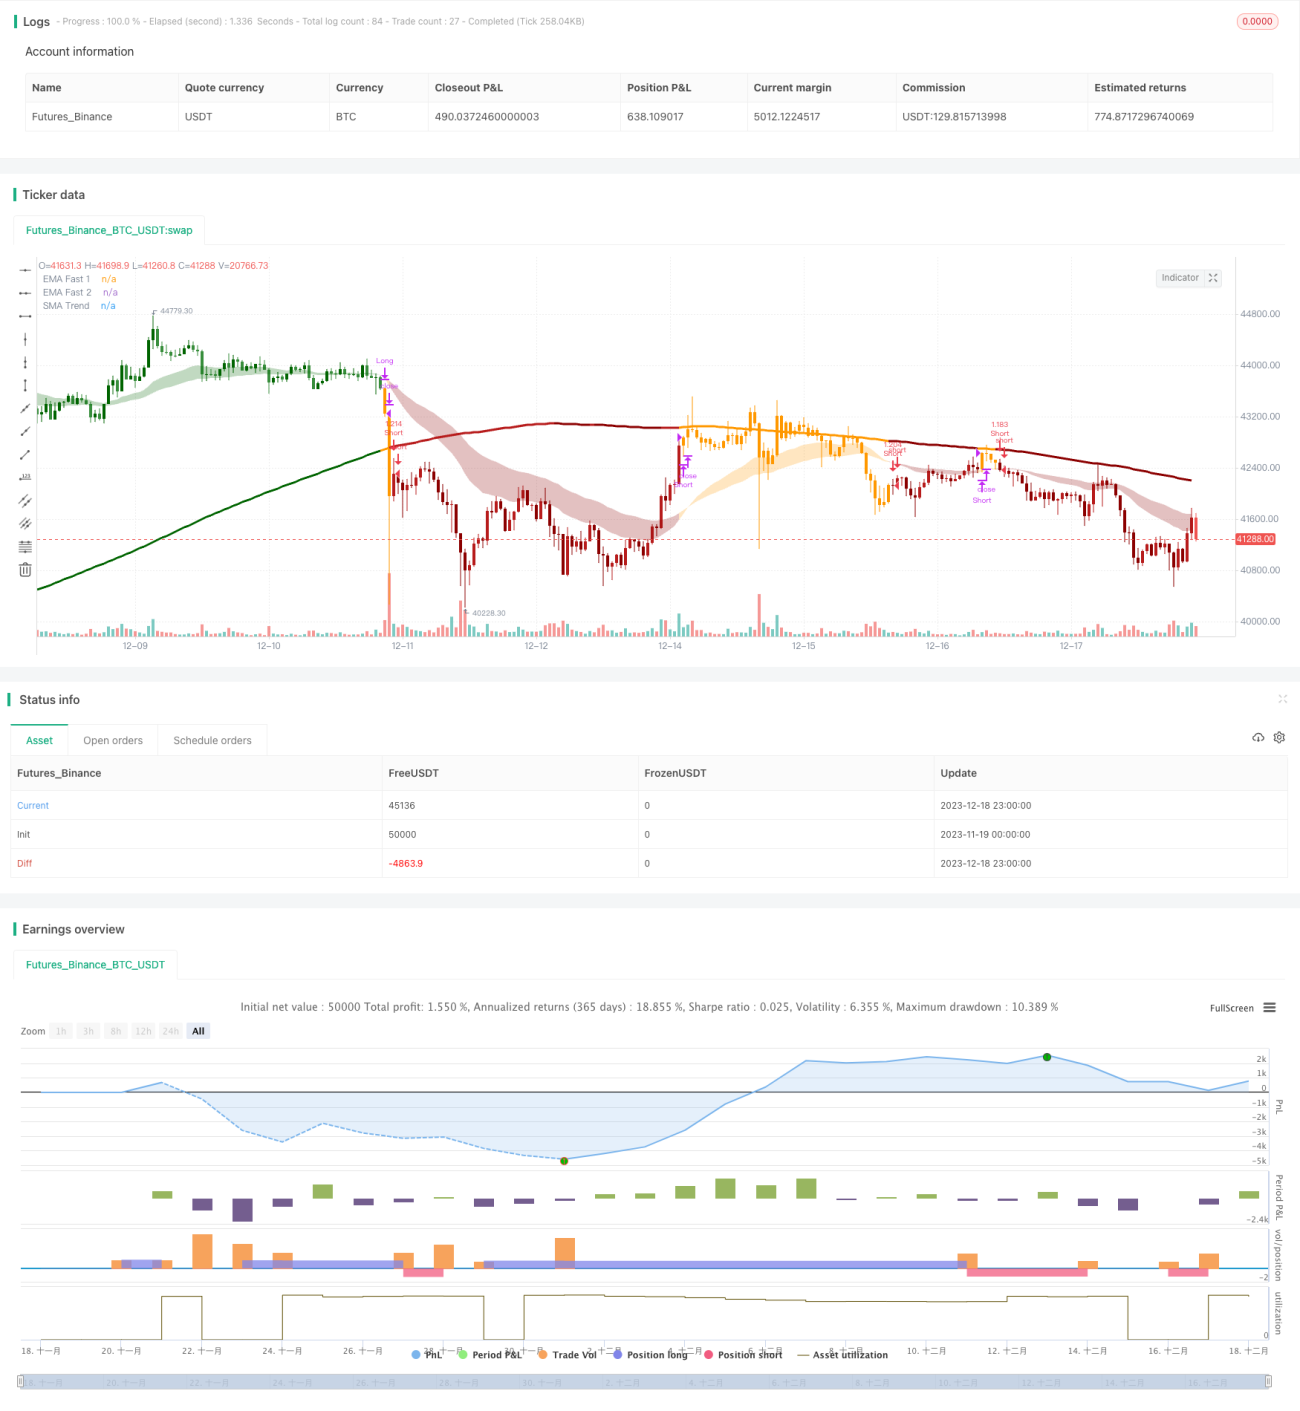
یہ حکمت عملی دوہری اشارے کے ساتھ مل کر رجحان کی سمت کی نشاندہی کرتی ہے اور تجارت کرتی ہے۔ پہلے ، یہ قلیل مدتی رجحانات کا فیصلہ کرنے کے لئے دو حرکت پذیر اوسطوں (فاسٹ لائن اور میڈیم لائن) کے کراس کا استعمال کرتا ہے۔ دوسرا ، یہ اہم رجحانات کی سمت کا فیصلہ کرنے کے لئے چینل کی حد اور طویل مدتی حرکت پذیر اوسط کا استعمال کرتا ہے۔ صرف اس صورت میں جب دونوں فیصلے متفق ہوں تو ہی تجارتی سگنل پیدا ہوتا ہے۔ یہ حکمت عملی متعدد اشارے کا استعمال کرتی ہے ، جو جعلی سگنل کو مؤثر طریقے سے فلٹر کرتی ہے اور استحکام کو بہتر بناتی ہے۔
حکمت عملی کا اصول
اس حکمت عملی کا فیصلہ کرنے کے لئے تین اشارے کے سیٹوں کا استعمال کیا جاتا ہے۔ پہلے ، مختصر مدت کے رجحانات کا فیصلہ کرنے کے لئے تیز رفتار لائن EMA ((26 سائیکل) اور درمیانی رفتار لائن EMA ((50 سائیکل) کا سنہری فورک ڈائیفورک۔ دوسرا ، درمیانی مدت کے رجحانات کا فیصلہ کرنے کے لئے اس حد کو توڑنے کے لئے اس حد کو توڑنے کا فیصلہ کرنے کے لئے چینل کی حد کا حساب لگانا۔ آخر میں ، طویل مدتی اوسط لائن SMA ((200 سائیکل) کا حساب لگانا ، اور قیمت کے مقابلے میں اہم رجحانات کی سمت کا فیصلہ کرنا۔ صرف تینوں فیصلوں کے نتائج ایک جیسے ہونے پر ہی تجارتی سگنل جاری کیا جاتا ہے۔
اس کے علاوہ، اس کے بارے میں سوچنے کی منطق یہ ہے کہ:
-
تیز رفتار لائن اور درمیانی رفتار لائن کی کراسنگ ((گولڈ فورک اوپر ، ڈیڈ فورک نیچے) قلیل مدتی رجحان کی سمت کا تعین کرتی ہے۔
-
اگر قیمت چینل کی حد کو توڑتی ہے تو ، اس کا اندازہ درمیانی مدت کے رجحان کی سمت سے ہوتا ہے۔ چینل کی حد طویل مدتی اوسط سے مل کر اے ٹی آر کو کم کرنے کے ایک فیکٹر سے ضرب دی جاتی ہے۔ اگر قیمت اوپر کی حد کو توڑتی ہے تو ، یہ بیعانہ ہے؛ اگر نیچے کی حد کو توڑتی ہے تو ، یہ بیعانہ ہے۔
-
قیمتوں اور طویل مدتی اوسط سائز کا موازنہ کرنے سے اہم رجحانات کی سمت کا تعین ہوتا ہے۔
آخر میں ، صرف اس صورت میں جب مختصر ، درمیانے اور طویل تینوں فیصلوں کے نتائج ایک جیسے ہوں گے تب ہی تجارتی سگنل جاری کیا جائے گا۔ اس طرح کا مخلوط فیصلہ جعلی سگنل کو مؤثر طریقے سے فلٹر کرنے اور استحکام کو بہتر بنانے میں مدد فراہم کرتا ہے۔
اسٹریٹجک فوائد
اس طرح کی دوہری حکمت عملی کے کچھ فوائد ہیں:
-
جعلی سگنل کو مؤثر طریقے سے فلٹر کیا جاسکتا ہے ، اور استحکام کو بہتر بنایا جاسکتا ہے۔ چونکہ تجارتی سگنل کو مختصر ، درمیانے اور طویل متعدد اشارے کے نتائج کی توثیق کی ضرورت ہوتی ہے ، لہذا کسی ایک اشارے کی وجہ سے غلط سگنل سے بچا جاسکتا ہے۔
-
اعلی لچکدار، مارکیٹ کے مطابق انڈیکس پیرامیٹرز کو ایڈجسٹ کر سکتے ہیں. تیزی سے اوسط اور چینل کی حد کے پیرامیٹرز کو ایڈجسٹ کیا جا سکتا ہے، مختلف مارکیٹ کے ماحول کے لئے مناسب.
-
رجحان ٹریڈنگ اور بینڈ ٹریڈنگ کے ساتھ مل کر ◄ درمیانی قلیل مدتی اشارے رجحانات کو پکڑتے ہیں ، طویل مدتی اشارے بینڈ کی وضاحت کرتے ہیں ، مجموعی طور پر رجحانات اور الٹ حکمت عملی کے فوائد کے ساتھ ◄
-
فنڈز کے استعمال میں بہت زیادہ کارکردگی۔ فنڈز کو موثر طریقے سے استعمال کرنے اور غیر ضروری تجارت سے بچنے کے لئے صرف اس صورت میں آرڈر کریں جب متعدد اشارے کے نتائج متفق ہوں۔
اسٹریٹجک رسک
اس حکمت عملی کے کچھ خطرات بھی ہیں:
-
پیرامیٹرز کو ترتیب دینے کا خطرہ۔ حرکت پذیر اوسط کی مدت اور چینل کی حد کے پیرامیٹرز کو مناسب طریقے سے ترتیب دینے کی ضرورت ہے ، اگر مناسب طریقے سے نہیں تو یہ رجحانات کو مؤثر طریقے سے دریافت کرنے میں ناکام ہوسکتا ہے یا بہت زیادہ غلط سگنل پیدا کرسکتا ہے۔
-
ڈبل اشارے کے ساتھ تجارت کے مواقع کی لاگت میں اضافہ ہوتا ہے۔ ایک ہی اشارے کی حکمت عملی کے مقابلے میں ، کچھ تجارت کے مواقع سے محروم رہنا ممکن ہے ، بہترین نقطہ پر داخلہ اور باہر نکلنے سے قاصر ہے۔
-
اسٹاپ نقصان کی حکمت عملی کو محتاط رہنے کی ضرورت ہے۔ اس حکمت عملی میں توڑنے والے اسٹاپ نقصان کا طریقہ کار غیر ضروری نقصان کا سبب بن سکتا ہے ، اور اسٹاپ نقصان کی تناسب کو محتاط طریقے سے ترتیب دینے کی ضرورت ہے۔
-
یہ حکمت عملی زیادہ تر رجحانات کے ساتھ مارکیٹ کے ماحول کے لئے موزوں ہے.
حکمت عملی کی اصلاح کی سمت
اس حکمت عملی کو مندرجہ ذیل پہلوؤں سے بہتر بنایا جاسکتا ہے:
-
مختلف پیرامیٹرز کے مجموعے کی جانچ کریں اور بہترین پیرامیٹرز تلاش کریں۔ آپ زیادہ سے زیادہ تاریخی ڈیٹا ٹیسٹنگ کے ذریعہ بہترین پیرامیٹرز کی ترتیب تلاش کرسکتے ہیں۔
-
خود کار طریقے سے اسٹاپ نقصان کا طریقہ کار شامل کریں۔ اس کو متحرک طور پر اسٹاپ نقصان کی حد کو ایڈجسٹ کرنے کے لئے Volatility Indicator کے ساتھ جوڑا جاسکتا ہے۔
-
پیمائش کی صلاحیت کو بڑھانے کے لئے معاون فیصلے کریں۔ اہم مقامات پر پوزیشن کی حد کا تعین کرنے میں معاون ، فنڈز کے استعمال کی کارکردگی کو بہتر بنائیں۔
-
داخلے کی منطق کو بہتر بنائیں۔ لاگت کی اوسط حکمت عملی پر زیادہ غور کریں ، جس سے داخلے کا خطرہ کم ہوجائے۔
-
مشین لرننگ ماڈل کے ساتھ مل کر فیصلہ کریں۔ ماڈل کی مضبوطی اور فٹ ہونے کی خوبی کا فیصلہ کرنے کے لئے نیورل نیٹ ورکس جیسے ماڈل متعارف کروائیں۔
خلاصہ کریں۔
اس حکمت عملی کو فوری اور طویل مدتی ٹرپل اشارے کے فیصلے اور دوہری توثیق کے طریقہ کار کے ذریعے ، جعلی سگنل کو مؤثر طریقے سے روکنے ، استحکام کو بہتر بنانے کے لئے استعمال کیا جاتا ہے۔ اس کے ساتھ ساتھ رجحان ٹریڈنگ اور وقفہ ٹریڈنگ کے فوائد ، فنڈز کے استعمال کی اعلی کارکردگی ہے۔ اس میں متعدد طریقوں سے بہتری لائی جاسکتی ہے جیسے پیرامیٹرز کی اصلاح ، اسٹاپ نقصان کی اصلاح ، مقدار توانائی کے اشارے کا امتزاج ، اور یہ ایک تجویز کردہ مخلوط مقدار کی حکمت عملی ہے۔
- 1