ٹرپل سپر ٹرینڈ موونگ ایوریج بریک آؤٹ حکمت عملی
جائزہ
ٹرپل سپر ٹرینڈ میڈین لائن توڑنے کی حکمت عملی ایک عام حکمت عملی ہے جس میں ایک سے زیادہ مختلف پیرامیٹرز کی ترتیب کے ساتھ ایک سپر ٹرینڈ میڈین لائن اور defines ٹرینڈ ای ایم اے کا استعمال کیا جاتا ہے تاکہ رجحان کی سمت کی نشاندہی کی جاسکے اور تجارت کی جاسکے۔ اس حکمت عملی کا بنیادی خیال یہ ہے کہ جب کم از کم دو سپر ٹرینڈ میڈین لائنیں ڈفینس بڑے رجحان کی ای ایم اے لائن کے اوپر ایک کثیر سرخی کی حیثیت رکھتی ہیں تو کثیر سرخی قائم کی جائے۔ جب کم از کم دو سپر ٹرینڈ میڈین لائنیں ڈفینس بڑے رجحان کی ای ایم اے لائن کے نیچے ایک خالی سرخی کی حیثیت رکھتی ہیں تو کثیر سرخی قائم کی جائے۔
حکمت عملی کا اصول
یہ حکمت عملی تین مختلف پیرامیٹرز کے ساتھ ایک سپر ٹرینڈ میڈین لائن اور ایک EMA کے ذریعہ پوزیشنوں کی تعمیر اور پوزیشنوں کا فیصلہ کرتی ہے جو بڑے رجحان کی سمت کی وضاحت کرتی ہے:
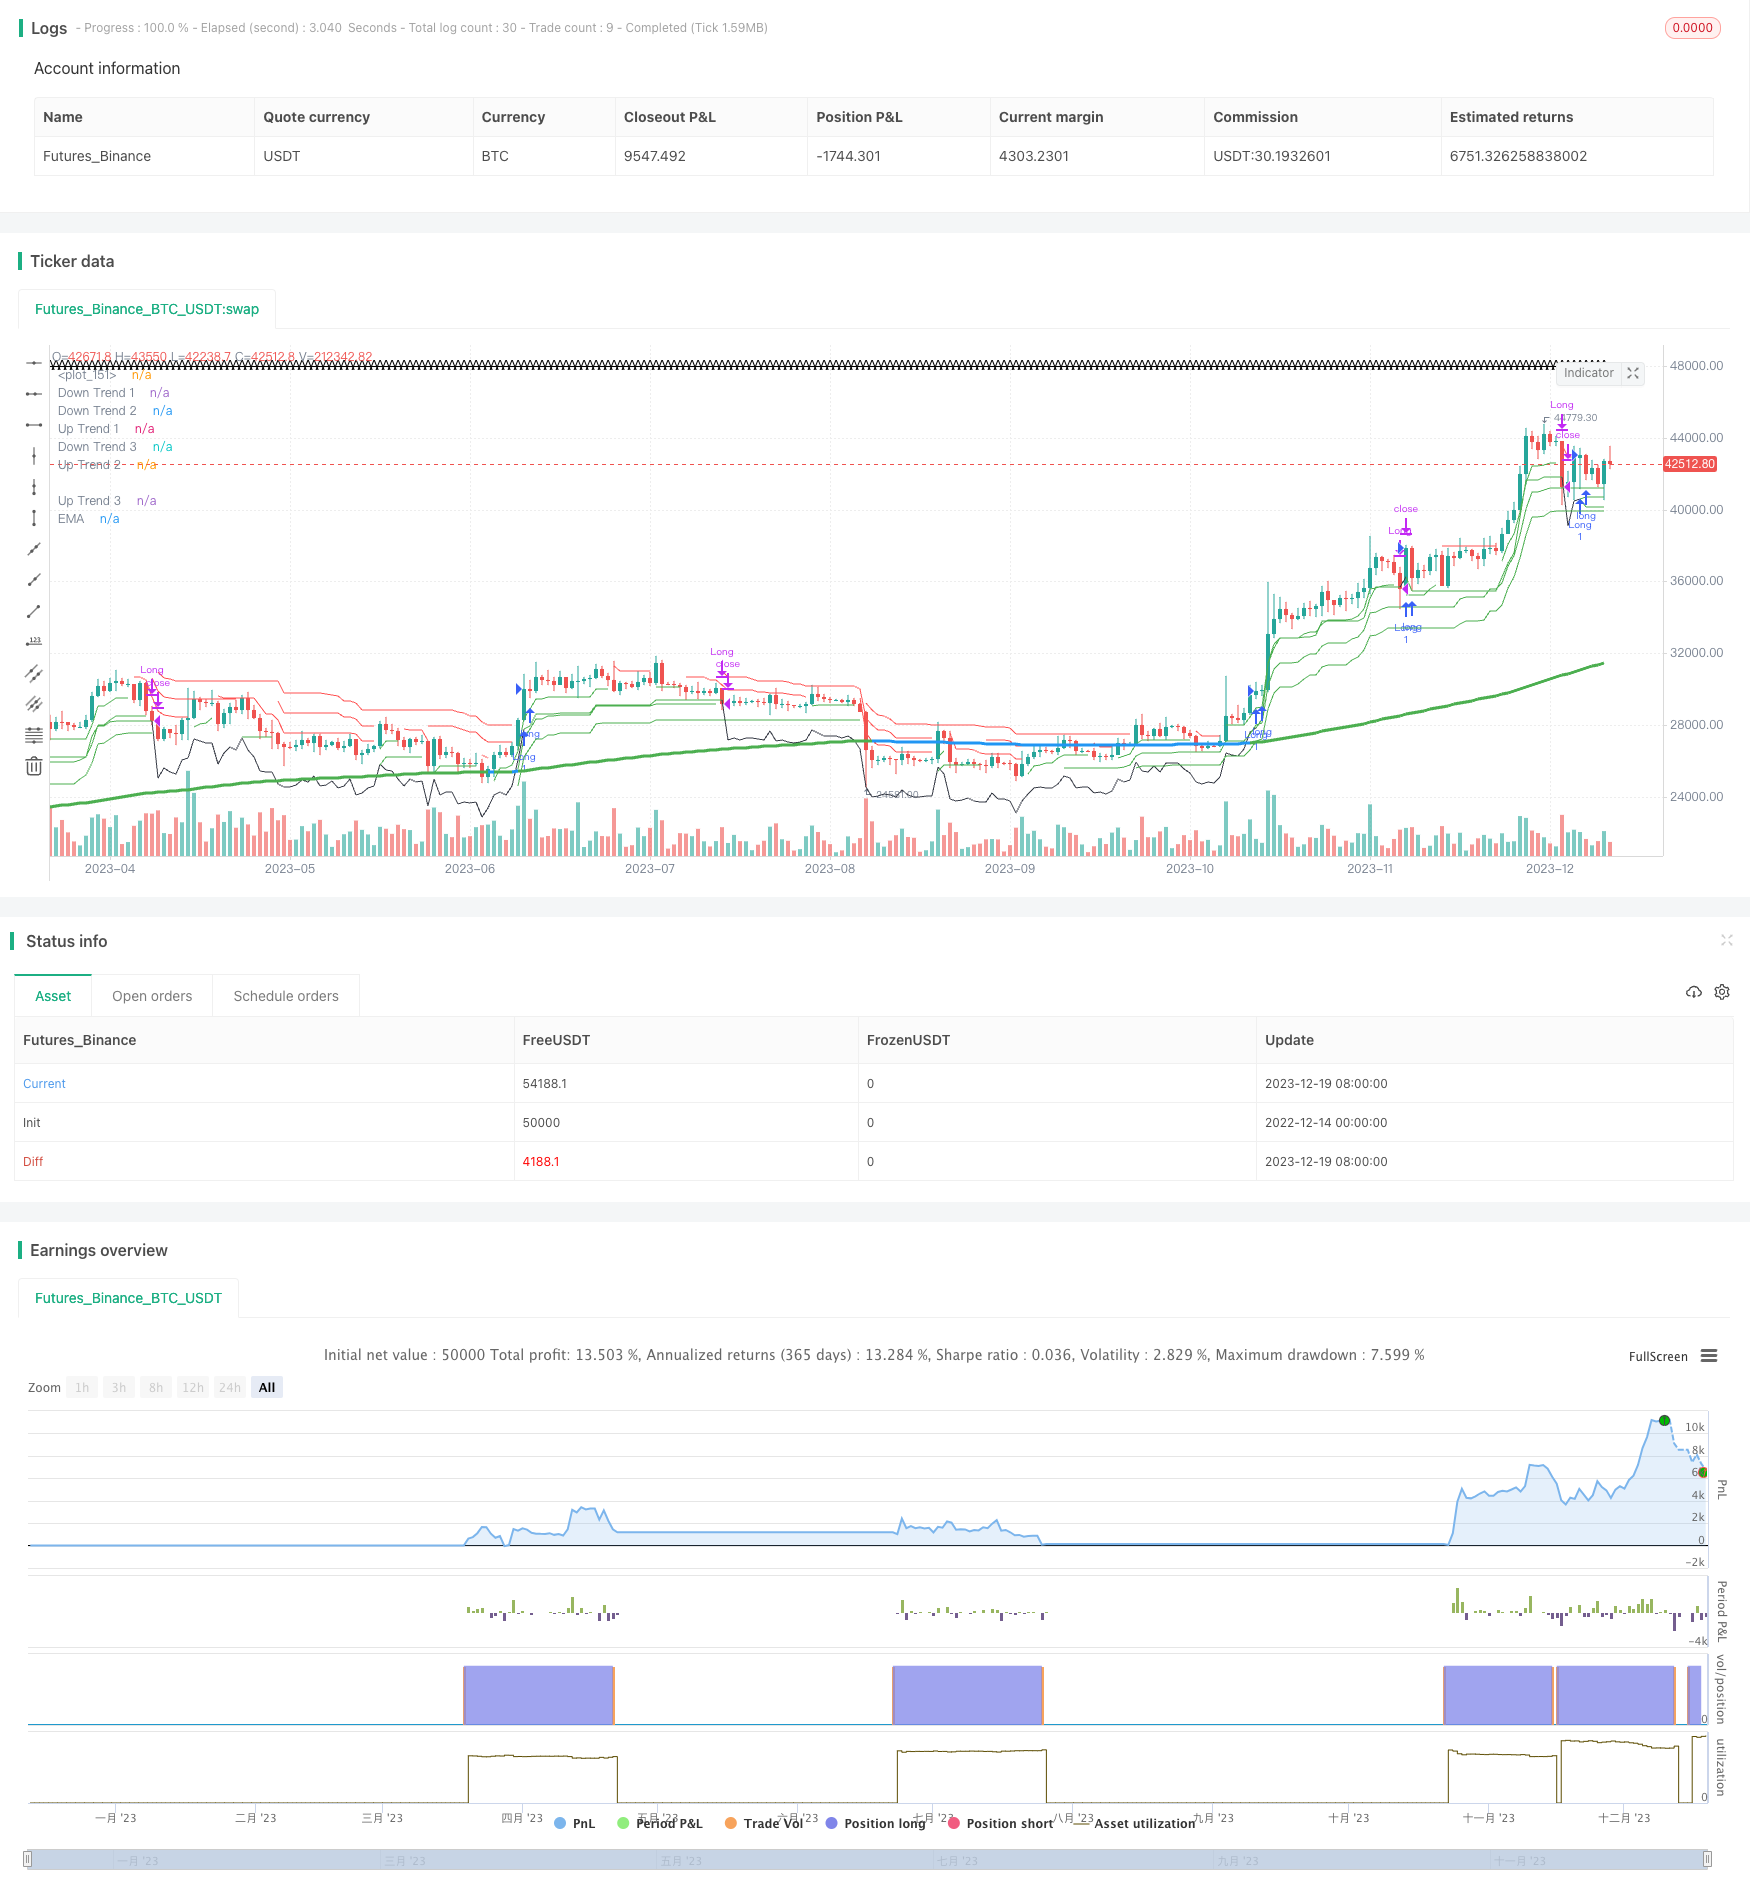
سپر ٹرینڈ 1 ، سپر ٹرینڈ 2 ، اور سپر ٹرینڈ 3 کے لئے تین سپر ٹرینڈ اوسط لائنیں ترتیب دیں۔ سبز رنگ بالترتیب بڑھتے ہوئے رجحان کو ظاہر کرتا ہے ، اور سرخ نیچے کی رجحان کو ظاہر کرتا ہے۔
ایک ای ایم اے کا تعین کرنے کے لئے ایک EMA ہموار حرکت پذیر اوسط ematrend بڑے رجحان کی وضاحت کرتا ہے ، جب تین سپر ٹرینڈ اوسط لائنیں سبھی اس EMA سے زیادہ ہوتی ہیں تو اس کی تعریف بڑے ڈسپلے کے زیادہ سر والے رجحان کے طور پر کی جاتی ہے ، اور اس کے برعکس ، اس کی تعریف خالی سر والے رجحان کے طور پر کی جاتی ہے۔
جب کم از کم دو سپر ٹرینڈ اوسط لائنیں ڈیسک میں ایک ہی وقت میں ایک ہی وقت میں دکھائی دیتی ہیں تو ، اس کی سمت 0 سے کم ہے تو اسے ایک ہی وقت میں ایک ہی وقت میں دکھایا جاتا ہے۔ جب کم از کم دو سپر ٹرینڈ اوسط لائنیں ڈیسک میں ایک ہی وقت میں ایک ہی وقت میں دکھائی دیتی ہیں تو ، اس کی سمت 0 سے زیادہ ہے تو اسے ایک ہی وقت میں خالی سر (سرخ) دکھایا جاتا ہے۔
اس کے بعد سگنل کے بعد زیادہ / خالی پوزیشن کھولیں۔
سٹاپ نقصان روکنے کی شرط مقرر کریں۔ جس میں فکسڈ سٹاپ نقصان کا خطرہ واپسی کا تناسب ہے ، یعنی نقصان کا تناسب 3 ہے۔ موبائل سٹاپ نقصان کا تعین ایک اے ٹی آر کے طور پر کیا گیا ہے۔
جب اسٹاپ نقصان یا اسٹاپ شرط ٹرگر ہوتی ہے تو پوزیشن کو صاف کریں۔
طاقت کا تجزیہ
یہ حکمت عملی مندرجہ ذیل فوائد رکھتی ہے:
ٹرپل سپر ٹرینڈ اوسط لائن کے ساتھ مل کر ای ایم اے کا استعمال کرتے ہوئے رجحان کا تعین کریں ، جو رجحان کے اشارے کو مؤثر طریقے سے پہچان سکے۔
کثیرالاضلاع کے قواعد واضح ہیں، آسانی سے سمجھنے اور لاگو کرنے کے لئے.
موبائل سٹاپ اور فکسڈ اسٹاپ سیٹ کریں تاکہ خطرے کو مؤثر طریقے سے کنٹرول کیا جاسکے۔
ضرورت کے مطابق ہائپر پیرامیٹرز کو ایڈجسٹ کریں اور حکمت عملی کو بہتر بنائیں۔
خطرے کا تجزیہ
اس حکمت عملی میں کچھ خطرات بھی ہیں:
ہائپر پیرامیٹرز کی غلط ترتیب سے اچھے تجارتی مواقع ضائع ہوسکتے ہیں۔ مختلف اے ٹی آر سائیکل ، اے ٹی آر ضرب ، ای ایم اے سائیکل پیرامیٹرز کی جانچ کی جاسکتی ہے۔
اس میں ناکامی کا امکان موجود ہے ، جس کی امکان کو کم کرنے کے لئے اس میں تبدیلی کی جاسکتی ہے۔
اسٹاپ نقصان یا اسٹاپ سیٹنگ کو بہت زیادہ نرمی سے نقصان کی امکان میں اضافہ ہوتا ہے۔ اسٹاپ نقصان کی حد کو مناسب طریقے سے تنگ کیا جانا چاہئے۔
ریٹرننگ کے اعداد و شمار میں فٹنس کے مسائل پیدا ہونے کا خدشہ ہے۔ ملٹی مارکیٹ ملٹی سائیکل ٹیسٹنگ پر توجہ دی جانی چاہئے۔
اصلاح کی سمت
اس حکمت عملی کو مندرجہ ذیل پہلوؤں سے بہتر بنایا جاسکتا ہے:
ٹیسٹ بہترین سپر پیرامیٹرز کا مجموعہ۔ آپ مختلف اے ٹی آر دوروں ، اے ٹی آر ضربوں ، ای ایم اے اوسط دوروں کو ملا کر ٹیسٹ کرسکتے ہیں تاکہ بہترین پیرامیٹرز تلاش کریں۔
تجارت کی مختلف اقسام میں اضافہ کریں۔ حکمت عملی کی افادیت کو جانچنے کے لئے مختلف اقسام جیسے اسٹاک ، ڈیجیٹل کرنسی وغیرہ شامل کی جاسکتی ہیں۔
دوسرے اشارے کے ساتھ مل کر سگنل فلٹر کریں۔ مثال کے طور پر ، رجحان کے اشارے کو غلط پڑھنے سے بچنے کے لئے آر ایس آئی ، ایم اے سی ڈی جیسے اشارے شامل کیے جاسکتے ہیں۔
نقصان کو روکنے کے طریقہ کار کو بہتر بنانا۔ نقصان کو روکنے کے طریقوں کی جانچ کی جاسکتی ہے ، یا اے ٹی آر / اتار چڑھاؤ کی شرح میں تبدیلی کی بنیاد پر۔
خلاصہ کریں۔
ٹرپل سپر ٹرینڈ میڈین لائن توڑنے کی حکمت عملی مجموعی طور پر ایک سادہ اور عملی رجحان سے باخبر رہنے کی حکمت عملی ہے۔ یہ ایک ہی وقت میں متعدد سپر ٹرینڈ میڈین لائنوں اور رجحان کا فیصلہ کرنے والے ای ایم اے کو مواقع کی کھوج اور خطرے کو مؤثر طریقے سے کنٹرول کرنے کے لئے جوڑتا ہے۔ پیرامیٹرز کی اصلاح اور قواعد کی اصلاح کے ذریعہ بہتر اثر حاصل کیا جاسکتا ہے۔ یہ حکمت عملی سمجھنے میں آسان ہے اور اس کی مثال لینے کے قابل ہے۔
/*backtest
start: 2022-12-14 00:00:00
end: 2023-12-20 00:00:00
period: 1d
basePeriod: 1h
exchanges: [{"eid":"Futures_Binance","currency":"BTC_USDT"}]
*/

// @version=5
// author=theasgard and moonshot-indicator (ms)
// year 2021
//
// This is a well knowen strategy by using 3 different Supertrends and a trend-defining EMA,
// feel free to play around with the settings, a backtest on 8h ETHUSDT pair brought some good results using
// the 233EMA and investing 75% of a 10k start capital
//
// the idea is to have at least 2 supertrnds going green above the trend-EMA to go long and exit by turning
// 2 supertrends red (idea: 1 supertrend in red could initialize a take profit)
// shorts work vice versa
// The EMA shows in green for uptrends and in red for downtrends, if it is blue no Signal will be taken because
// the 3 supertrends are not all above or below the trendline(EMA)
//
// Update 1:
// Fixed a minor input error
// Added ATR stoploss, and commented out the percentage stop loss
// Added time window to backtest
// Added exit on risk/revard is met
// This version is only buy...wait for next update adding shorts

strategy("ms hypertrender", overlay=true)

// set up 3 supertrendlines and colour the direction up/down
atrPeriod1 = input(10, "ATR Length 1")
factor1 = input.float(1.0, "ATR Factor 1", step = 0.01)
[supertrend1, direction1] = ta.supertrend(factor1, atrPeriod1)
upTrend1 = plot(direction1 < 0 ? supertrend1 : na, "Up Trend 1", color = color.green, style=plot.style_linebr)
downTrend1 = plot(direction1 < 0? na : supertrend1, "Down Trend 1", color = color.red, style=plot.style_linebr)

atrPeriod2 = input(11, "ATR Length 2")
factor2 = input.float(2.0, "ATR Factor 2", step = 0.01)
[supertrend2, direction2] = ta.supertrend(factor2, atrPeriod2)
upTrend2 = plot(direction2 < 0 ? supertrend2 : na, "Up Trend 2", color = color.green, style=plot.style_linebr)
downTrend2 = plot(direction2 < 0? na : supertrend2, "Down Trend 2", color = color.red, style=plot.style_linebr)

atrPeriod3 = input(12, "ATR Length 3")
factor3 = input.float(3.0, "ATR Factor 3", step = 0.01)
[supertrend3, direction3] = ta.supertrend(factor3, atrPeriod3)
upTrend3 = plot(direction3 < 0 ? supertrend3 : na, "Up Trend 3", color = color.green, style=plot.style_linebr)
downTrend3 = plot(direction3 < 0? na : supertrend3, "Down Trend 3", color = color.red, style=plot.style_linebr)

//set up the trend dividing EMA and color uptrend nutreal downtrend
len = input.int(233, minval=1, title="Trend-EMA Length")
src = input(close, title="Source")
offset = input.int(title="Offset", defval=0, minval=-500, maxval=500)

//general Bull or Bear Trend? Visualized by ema
ematrend = ta.ema(src, len)
generaluptrend = supertrend1 > ematrend and supertrend2 > ematrend and supertrend3 > ematrend
generaldowntrend = supertrend1 < ematrend and supertrend2 < ematrend and supertrend3 < ematrend
emacolor = if generaluptrend
    color.green
else if generaldowntrend
    color.red
else
    color.blue
plot(ematrend, title="EMA", color=emacolor, linewidth=3, offset=offset)

// Bullish? min 2 supertrends green
bullish = (direction1 < 0 and direction2 < 0) or (direction1 < 0 and direction3 < 0) or (direction2 < 0 and direction3 < 0) and generaluptrend
extremebullish = direction1 < 0 and direction2 < 0 and direction3 < 0 and generaluptrend //all 3 green

// Bearish? min 2 supertrends red
bearish = (direction1 > 0 and direction2 > 0) or (direction1 > 0 and direction3 > 0) or (direction2 > 0 and direction3 > 0) and generaldowntrend
extremebearish = direction1 > 0 and direction2 > 0 and direction3 > 0 and generaldowntrend //all 3 red

// Open Long
//plotchar(((bullish and not bullish[1]) or (extremebullish and not extremebullish[1])) and (emacolor==color.green)? close : na, title = 'Start Long', char='▲', color = #80eb34, location = location.belowbar, size = size.small)

// TP 10% Long
TP10long = ((generaluptrend and bullish[1]) or (generaluptrend and extremebullish[1])) and (direction1 > 0 or direction2 > 0 or direction3 > 0)
//plotchar(TP10long and not TP10long[1]? close : na, title = 'TP on Long', char='┼', color = #ffd000, location = location.abovebar, size = size.tiny)

// Exit Long
//plotchar(extremebearish and not extremebearish[1] or bearish and not bearish[1]? close : na, title = 'Close all Longs', char='Ꭓ', color = #ff0037, location = location.abovebar, size = size.tiny)
stopsupertrendup = if supertrend1 < supertrend2 and supertrend1 < supertrend3
    (supertrend1)
else if supertrend2 < supertrend1 and supertrend2 < supertrend3
    (supertrend2)
else if supertrend3 < supertrend1 and supertrend3 < supertrend2
    (supertrend3)
lowestLows = ta.lowest(low, 1)
// Open Short
//plotchar(((bearish and not bearish[1]) or (extremebearish and not extremebearish[1])) and (emacolor==color.red)? close : na, title = 'Start Short', char='▼', color = #0547e3, location = location.abovebar, size = size.small)

// TP 10% Short
TP10short = ((generaldowntrend and bearish[1]) or (generaldowntrend and extremebearish[1])) and (direction1 < 0 or direction2 < 0 or direction3 < 0)
//plotchar(TP10short and not TP10short[1]? close : na, title = 'TP on Short', char='┼', color = #ffd000, location = location.belowbar, size = size.tiny)

// Exit Short
//plotchar(extremebullish and not extremebullish[1] or bullish and not bullish[1]? close : na, title = 'Close all Shorts', char='Ꭓ', color = #ff0037, location = location.belowbar, size = size.tiny)
stopsupertrenddown = if supertrend1 > supertrend2 and supertrend1 > supertrend3
    (supertrend1)
else if supertrend2 > supertrend1 and supertrend2 > supertrend3
    (supertrend2)
else if supertrend3 > supertrend1 and supertrend3 > supertrend2
    (supertrend3)
highestHighs = ta.highest(high,1)
// Set stop loss level with input options (optional)
//longLossPerc = input.float(title="Long Stop Loss (%)",
//     minval=0.0, step=0.1, defval=1) * 0.01

//shortLossPerc = input.float(title="Short Stop Loss (%)",
//     minval=0.0, step=0.1, defval=1) * 0.01

// Determine stop loss price
//longStopPrice  = strategy.position_avg_price * (1 - longLossPerc)
//shortStopPrice = strategy.position_avg_price * (1 + shortLossPerc)

openlong = (extremebullish and not extremebullish[1]) and (emacolor==color.green)//(((bullish and not bullish[1]) or
openshort = (extremebearish and not extremebearish[1]) and (emacolor==color.red)//(((bearish and not bearish[1]) or
exitlong = lowestLows<(stopsupertrendup - ((stopsupertrendup / 100) * 0.1)) //(extremebearish and not extremebearish[1] or bearish and not bearish[1]) or TP10long or
exitshort = highestHighs>(stopsupertrenddown - ((stopsupertrenddown / 100) * 0.1)) //(extremebullish and not extremebullish[1] or bullish and not bullish[1]) or TP10short
//strategy.entry("buy", strategy.long, when=openlong)
//strategy.entry("sell", strategy.short, when=openshort)

//strategy.close("buy", when=exitlong)
//strategy.close("sell", when=exitshort)

// Submit exit orders based on calculated stop loss price
//if (strategy.position_size > 0)
//    strategy.exit(id="Long Stop", stop=longStopPrice)

//if (strategy.position_size < 0)
//    strategy.exit(id="Short Stop", stop=shortStopPrice)

backtest_timeframe_start = input(defval = timestamp("01 Apr 2016 13:30 +0000"), title = "Backtest Start Time")
USE_ENDTIME = input(false,title="Define the ending period for backtests (If false, will test up to most recent candle)")
backtest_timeframe_end = input(defval = timestamp("19 Mar 2021 19:30 +0000"), title = "Backtest End Time")
TARGET_PROFIT_MODE = input(false,title="Exit when Risk:Reward met")
REWARD_RATIO = input(3,title="Risk:[Reward] (i.e. 3) for exit")
// Trailing stop loss {
TSL_ON = input(true,title="Use trailing stop loss")
var entry_price = float(0)
ATR_multi_len = 26
ATR_multi = input(2, "ATR multiplier for stop loss")
ATR_buffer = ta.atr(ATR_multi_len) * ATR_multi
plotchar(ATR_buffer, "ATR Buffer", "A", location = location.top)
risk_reward_buffer = (ta.atr(ATR_multi_len) * ATR_multi) * REWARD_RATIO
take_profit_long = low > entry_price + risk_reward_buffer
take_profit_short = low < entry_price - risk_reward_buffer
var trailing_SL_buffer = float(0)
var stop_loss_price = float(0)
stop_loss_price := math.max(stop_loss_price, close - trailing_SL_buffer)
// plot TSL line
trail_profit_line_color = color.green
if strategy.position_size == 0  or not TSL_ON
    trail_profit_line_color := color.black
    stop_loss_price := close - trailing_SL_buffer
plot(stop_loss_price,color=trail_profit_line_color)
// }

if true
    buy_condition = openlong
    exit_condition = exitlong
    //ENTRY:
    if buy_condition
        if strategy.position_size == 0
            entry_price := close
            trailing_SL_buffer := ATR_buffer
            stop_loss_price := close - ATR_buffer

        msg = "entry"
        if strategy.position_size > 0
            msg := "pyramiding"
        strategy.entry("Long",strategy.long, comment=msg)

    //EXIT:
    // Case (A) hits trailing stop
    if TSL_ON and strategy.position_size > 0 and close <= stop_loss_price
        if close > entry_price
            strategy.close("Long", comment="take profit [trailing]")
        else if close <= entry_price
            strategy.close("Long", comment="stop loss")
    // Case (B) take targeted profit relative to risk
    if strategy.position_size > 0 and TARGET_PROFIT_MODE
        if take_profit_long
            strategy.close("Long", comment="take profits [risk:reward]")
    // Case (C)
    if strategy.position_size > 0 and exit_condition
        if take_profit_long
            strategy.close("Long", comment="exit[rsi]")