اتار چڑھاؤ کے اشارے اور اسٹاکسٹک اشارے پر مبنی ملٹی ٹائم فریم تجارتی حکمت عملی
جائزہ
اس حکمت عملی میں اتار چڑھاؤ کے اشارے VIX اور بے ترتیب اشارے RSI کا امتزاج کیا گیا ہے۔ مختلف ٹائم پیکیج اشارے کے مجموعے کے ذریعہ ، انتہائی موثر توڑ خرید اور اوور خرید اوور فروخت کی روک تھام کی پوزیشن حاصل کی جاسکتی ہے۔ حکمت عملی میں بہت زیادہ اصلاح کی گنجائش ہے ، جو مختلف مارکیٹ کے حالات کے مطابق ڈھال سکتی ہے۔
حکمت عملی کا اصول
VIX اتار چڑھاؤ کے اشارے کا حساب لگائیں: حالیہ 20 دن کی بلند ترین قیمت اور کم ترین قیمت کے حساب سے اتار چڑھاؤ کی شرح۔ جب اتار چڑھاؤ کی شرح اوپر کی ٹریک سے زیادہ ہو تو ، مارکیٹ میں خوف و ہراس کا اظہار کیا جاتا ہے۔ جب نیچے کی ٹریک سے کم ہو تو ، مارکیٹ میں اطمینان کا اظہار کیا جاتا ہے۔
آر ایس آئی کا حساب لگانا: پچھلے 14 دنوں میں ہونے والے اتار چڑھاو کا حساب لگانا۔ جب آر ایس آئی 70 سے زیادہ ہو تو یہ ایک خریدنے کا علاقہ ہے ، اور جب 30 سے کم ہو تو یہ ایک فروخت کا علاقہ ہے۔
دونوں اشارے کو ملا کر ، جب اتار چڑھاؤ کی شرح اوپری ٹریک یا اعلی ترین فیصد سے زیادہ ہو تو زیادہ کام کریں؛ جب RSI 70 سے زیادہ ہو تو فلیٹ پوزیشن۔
اسٹریٹجک فوائد
- مارکیٹ کے اوقات کا تجزیہ کرنے کے لئے مختلف اشارے کو یکجا کرنا۔
- مختلف ٹائم پیکیج کے اشارے ایک دوسرے کی توثیق کرتے ہیں ، جس سے فیصلہ سازی کی درستگی میں اضافہ ہوتا ہے۔
- مختلف تجارت کی اقسام کے لئے مرضی کے مطابق ایڈجسٹمنٹ پیرامیٹرز۔
خطرے کا تجزیہ
- غلط پیرامیٹرز کی ترتیب سے متعدد غلط سگنل پیدا ہوسکتے ہیں۔
- قیمتوں میں ردوبدل کو چھوڑنے کے لئے ایک ہی فلیٹ پوزیشن اشارے کا استعمال کرنا آسان ہے۔
اصلاح کی تجاویز
- مزید توثیقی اشارے شامل کریں ، جیسے اوسط لائن ، برلن بینڈ ، اور دیگر جو داخلے کے وقت کا فیصلہ کرتے ہیں۔
- مزید فلیٹ پوزیشن کے اشارے شامل کریں ، جیسے الٹ K لائن کی شکل وغیرہ۔
خلاصہ کریں۔
یہ حکمت عملی مارکیٹ کے اوقات اور خطرے کی سطح کا اندازہ لگانے کے لئے VIX اشارے کا استعمال کرتی ہے ، اور RSI اشارے کے ساتھ مل کر اوورلوڈ اور اوورلوڈ کے ناقص تجارتی مقامات کو فلٹر کرتی ہے ، تاکہ موثر اوقات میں خریدیں اور بروقت نقصان کو روکیں۔ حکمت عملی میں زیادہ سے زیادہ اصلاح کی گنجائش ہے ، جو مارکیٹ کے وسیع تر ماحول میں ڈھال سکتی ہے۔
/*backtest
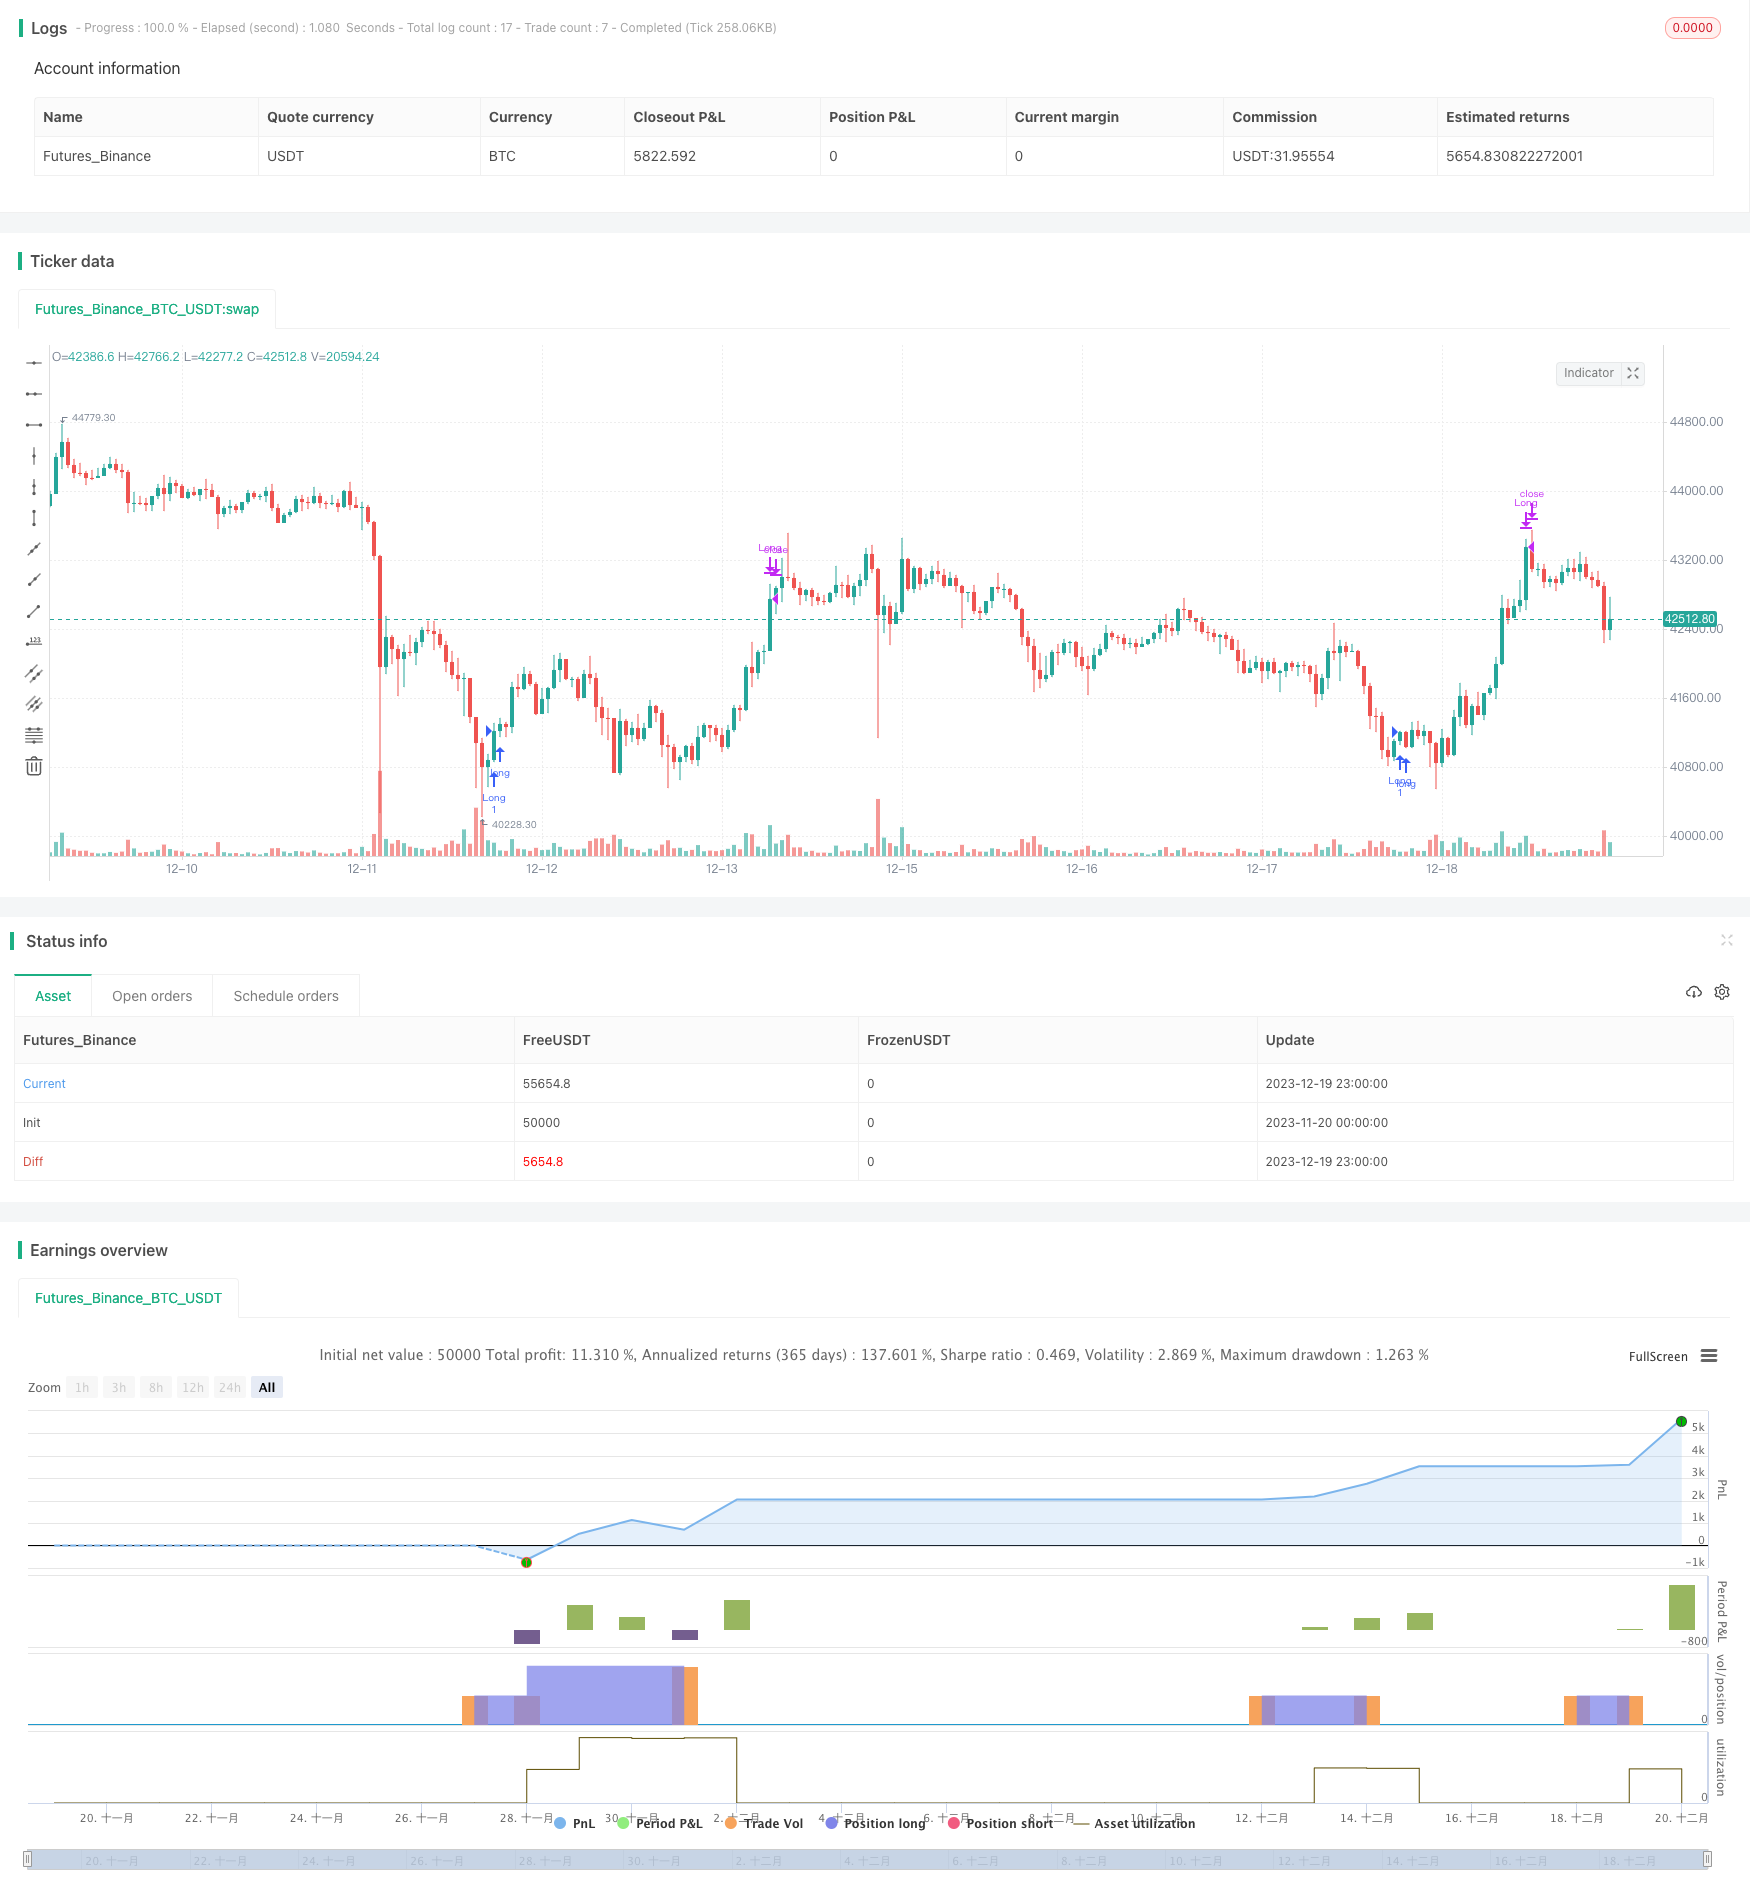
start: 2023-11-20 00:00:00
end: 2023-12-20 00:00:00
period: 1h
basePeriod: 15m
exchanges: [{"eid":"Futures_Binance","currency":"BTC_USDT"}]
*/
//@version=5
// This source code is subject to the terms of the Mozilla Public License 2.0 at https://mozilla.org/MPL/2.0/
// © timj
strategy('Vix FIX / StochRSI Strategy', overlay=true, pyramiding=9, margin_long=100, margin_short=100)
Stochlength = input.int(14, minval=1, title="lookback length of Stochastic")
StochOverBought = input.int(80, title="Stochastic overbought condition")
StochOverSold = input.int(20, title="Stochastic oversold condition")
smoothK = input(3, title="smoothing of Stochastic %K ")
smoothD = input(3, title="moving average of Stochastic %K")
k = ta.sma(ta.stoch(close, high, low, Stochlength), smoothK)
d = ta.sma(k, smoothD)
///////////// RSI
RSIlength = input.int( 14, minval=1 , title="lookback length of RSI")
RSIOverBought = input.int( 70 , title="RSI overbought condition")
RSIOverSold = input.int( 30 , title="RSI oversold condition")
RSIprice = close
vrsi = ta.rsi(RSIprice, RSIlength)
///////////// Double strategy: RSI strategy + Stochastic strategy
pd = input(22, title="LookBack Period Standard Deviation High")
bbl = input(20, title="Bolinger Band Length")
mult = input.float(2.0 , minval=1, maxval=5, title="Bollinger Band Standard Devaition Up")
lb = input(50 , title="Look Back Period Percentile High")
ph = input(.85, title="Highest Percentile - 0.90=90%, 0.95=95%, 0.99=99%")
new = input(false, title="-------Text Plots Below Use Original Criteria-------" )
sbc = input(false, title="Show Text Plot if WVF WAS True and IS Now False")
sbcc = input(false, title="Show Text Plot if WVF IS True")
new2 = input(false, title="-------Text Plots Below Use FILTERED Criteria-------" )
sbcFilt = input(true, title="Show Text Plot For Filtered Entry")
sbcAggr = input(true, title="Show Text Plot For AGGRESSIVE Filtered Entry")
ltLB = input.float(40, minval=25, maxval=99, title="Long-Term Look Back Current Bar Has To Close Below This Value OR Medium Term--Default=40")
mtLB = input.float(14, minval=10, maxval=20, title="Medium-Term Look Back Current Bar Has To Close Below This Value OR Long Term--Default=14")
str = input.int(3, minval=1, maxval=9, title="Entry Price Action Strength--Close > X Bars Back---Default=3")
//Alerts Instructions and Options Below...Inputs Tab
new4 = input(false, title="-------------------------Turn On/Off ALERTS Below---------------------" )
new5 = input(false, title="----To Activate Alerts You HAVE To Check The Boxes Below For Any Alert Criteria You Want----")
sa1 = input(false, title="Show Alert WVF = True?")
sa2 = input(false, title="Show Alert WVF Was True Now False?")
sa3 = input(false, title="Show Alert WVF Filtered?")
sa4 = input(false, title="Show Alert WVF AGGRESSIVE Filter?")
//Williams Vix Fix Formula
wvf = ((ta.highest(close, pd)-low)/(ta.highest(close, pd)))*100
sDev = mult * ta.stdev(wvf, bbl)
midLine = ta.sma(wvf, bbl)
lowerBand = midLine - sDev
upperBand = midLine + sDev
rangeHigh = (ta.highest(wvf, lb)) * ph
//Filtered Bar Criteria
upRange = low > low[1] and close > high[1]
upRange_Aggr = close > close[1] and close > open[1]
//Filtered Criteria
filtered = ((wvf[1] >= upperBand[1] or wvf[1] >= rangeHigh[1]) and (wvf < upperBand and wvf < rangeHigh))
filtered_Aggr = (wvf[1] >= upperBand[1] or wvf[1] >= rangeHigh[1]) and not (wvf < upperBand and wvf < rangeHigh)
//Alerts Criteria
alert1 = wvf >= upperBand or wvf >= rangeHigh ? 1 : 0
alert2 = (wvf[1] >= upperBand[1] or wvf[1] >= rangeHigh[1]) and (wvf < upperBand and wvf < rangeHigh) ? 1 : 0
alert3 = upRange and close > close[str] and (close < close[ltLB] or close < close[mtLB]) and filtered ? 1 : 0
alert4 = upRange_Aggr and close > close[str] and (close < close[ltLB] or close < close[mtLB]) and filtered_Aggr ? 1 : 0
//Coloring Criteria of Williams Vix Fix
col = wvf >= upperBand or wvf >= rangeHigh ? color.lime : color.gray
isOverBought = (ta.crossover(k,d) and k > StochOverBought) ? 1 : 0
isOverBoughtv2 = k > StochOverBought ? 1 : 0
filteredAlert = alert3 ? 1 : 0
aggressiveAlert = alert4 ? 1 : 0
if (filteredAlert or aggressiveAlert)
strategy.entry("Long", strategy.long)
if (isOverBought)
strategy.close("Long")