حسب ضرورت نان پینٹنگ HTF MACD MFI توسیع پذیر روبوٹ حکمت عملی
جائزہ
یہ حکمت عملی ایک انتہائی مرضی کے مطابق ہے جو MACD اور MFI اشارے کو دوبارہ نہیں بناتا ہے۔ یہ الگورتھم ٹریڈنگ روبوٹ کے لئے ایک مجموعہ حکمت عملی ہے۔ یہ رجحان اشارے اور حرکیات کے اشارے کو یکجا کرتا ہے اور متعدد فلٹرز کے ذریعہ تجارتی سگنل پیدا کرتا ہے۔
حکمت عملی کا اصول
اس حکمت عملی میں مارکیٹ کے رجحان کی سمت کا تعین کرنے کے لئے MACD اشارے کا استعمال کیا گیا ہے۔ MACD ایک رجحان سے باخبر رہنے والا متحرک اشارے ہے ، جس میں تیزی سے چلنے والی اوسط کو کم کرنے کے بعد آہستہ آہستہ چلنے والی اوسط سے MACD کالم گراف حاصل کیا جاتا ہے ، اور پھر MACD کی اشاریہ حرکت پذیری اوسط سے سگنل لائن حاصل کی جاتی ہے۔ جب تیز لائن پر سلائی سست ہوتی ہے تو خریدنے کا اشارہ ہوتا ہے ، نیچے سلائی فروخت کا اشارہ ہوتا ہے۔
اس کے علاوہ ، اس حکمت عملی میں ایم ایف آئی اشارے کا استعمال کیا گیا ہے تاکہ مارکیٹ میں اوور بیئر اور اوور سیل کی حیثیت کا اندازہ لگایا جاسکے۔ ایم ایف آئی اشارے قیمت اور حجم کی معلومات کو جوڑتے ہیں ، جس کی قیمت 0 سے 100 کے درمیان ہوتی ہے۔ ایم ایف آئی 20 سے کم ہونے پر اوور سیل زون ہوتا ہے ، اور 80 سے زیادہ ہونے پر اوور سیل زون ہوتا ہے۔
جعلی سگنل کو فلٹر کرنے کے لئے ، اس حکمت عملی میں رجحان فلٹر اور آر ایس آئی فلٹر بھی شامل ہیں۔ جب قیمت بڑھتی ہوئی رجحان کے تحت ہوتی ہے اور آر ایس آئی حد سے کم ہوتی ہے تو خریدنے کا اشارہ پیدا ہوتا ہے۔
اسٹریٹجک فوائد
- متعدد اشارے کو جوڑ کر ، مارکیٹ کی حالت کا جامع اندازہ لگائیں ، جیت کی شرح میں اضافہ کریں
- فلٹرنگ میکانزم شامل کریں ، جعلی سگنل سے بچیں ، غیر ضروری لین دین کو کم کریں
- مختلف اقسام کے پیرامیٹرز اور فلٹرز کو مختلف اقسام اور تجارتی ترجیحات کے مطابق اپنی مرضی کے مطابق ترتیب دیا جاسکتا ہے
- دستی ٹریڈنگ کے لئے استعمال کیا جا سکتا ہے یا پروگرام ٹریڈنگ کے لئے الگورتھم روبوٹ سے منسلک کیا جا سکتا ہے
اسٹریٹجک خطرات اور حل
غلط اشارے پیرامیٹرز کی ترتیب جھوٹے سگنل پیدا کرنے کے لئے آسان ہے
مختلف پیرامیٹرز کی جانچ کر سکتے ہیں، بہترین پیرامیٹرز کا مجموعہ منتخب کریں
کثیر قسم کے پیرامیٹرز کو قبول نہیں کیا گیا ہے، الگ الگ ٹیسٹ اور اصلاح کی ضرورت ہے
ٹرانزیکشن کی کثرت سے ٹرانزیکشن کی لاگت اور سلائڈ پوائنٹ کے خطرے میں اضافہ ہوسکتا ہے
ایڈجسٹ فلٹرز جو ٹرانزیکشن کی تعدد کو کم کرتے ہیں
لاگت پر قابو پانے پر توجہ دیں
حکمت عملی کی اصلاح کی سمت
- طویل اعداد و شمار کے دورانیے کی جانچ ، پیرامیٹرز کی استحکام کا اندازہ لگانا
- مختلف اشارے پیرامیٹرز کے مجموعے کی کوشش کریں
- معیاری وزن کو بہتر بنانا اور حکمت عملی میں استحکام پیدا کرنا
- مزید فلٹرز شامل کریں اور غیر ضروری ٹرانزیکشنز کو کم کریں
خلاصہ کریں۔
یہ حکمت عملی ایک انتہائی تخصیص بخش رجحانات کی پیروی کرنے والی حکمت عملی ہے ، جس میں رجحانات اور متحرک اشارے کے ساتھ مل کر مارکیٹ کی حالت کا اندازہ لگایا جاتا ہے ، اور فلٹرنگ میکانزم کے استعمال سے خطرے کو کنٹرول کیا جاتا ہے۔ یہ دستی تجارت کے لئے استعمال کیا جاسکتا ہے ، لیکن یہ الگورتھم روبوٹ سے منسلک ہے جس میں خود کار طریقے سے اعلی درجے کی پروگرامنگ کی تجارت ہوتی ہے۔ یہ حکمت عملی کا ایک ایسا نظام ہے جس کی طویل مدتی نگرانی کے قابل ہے۔
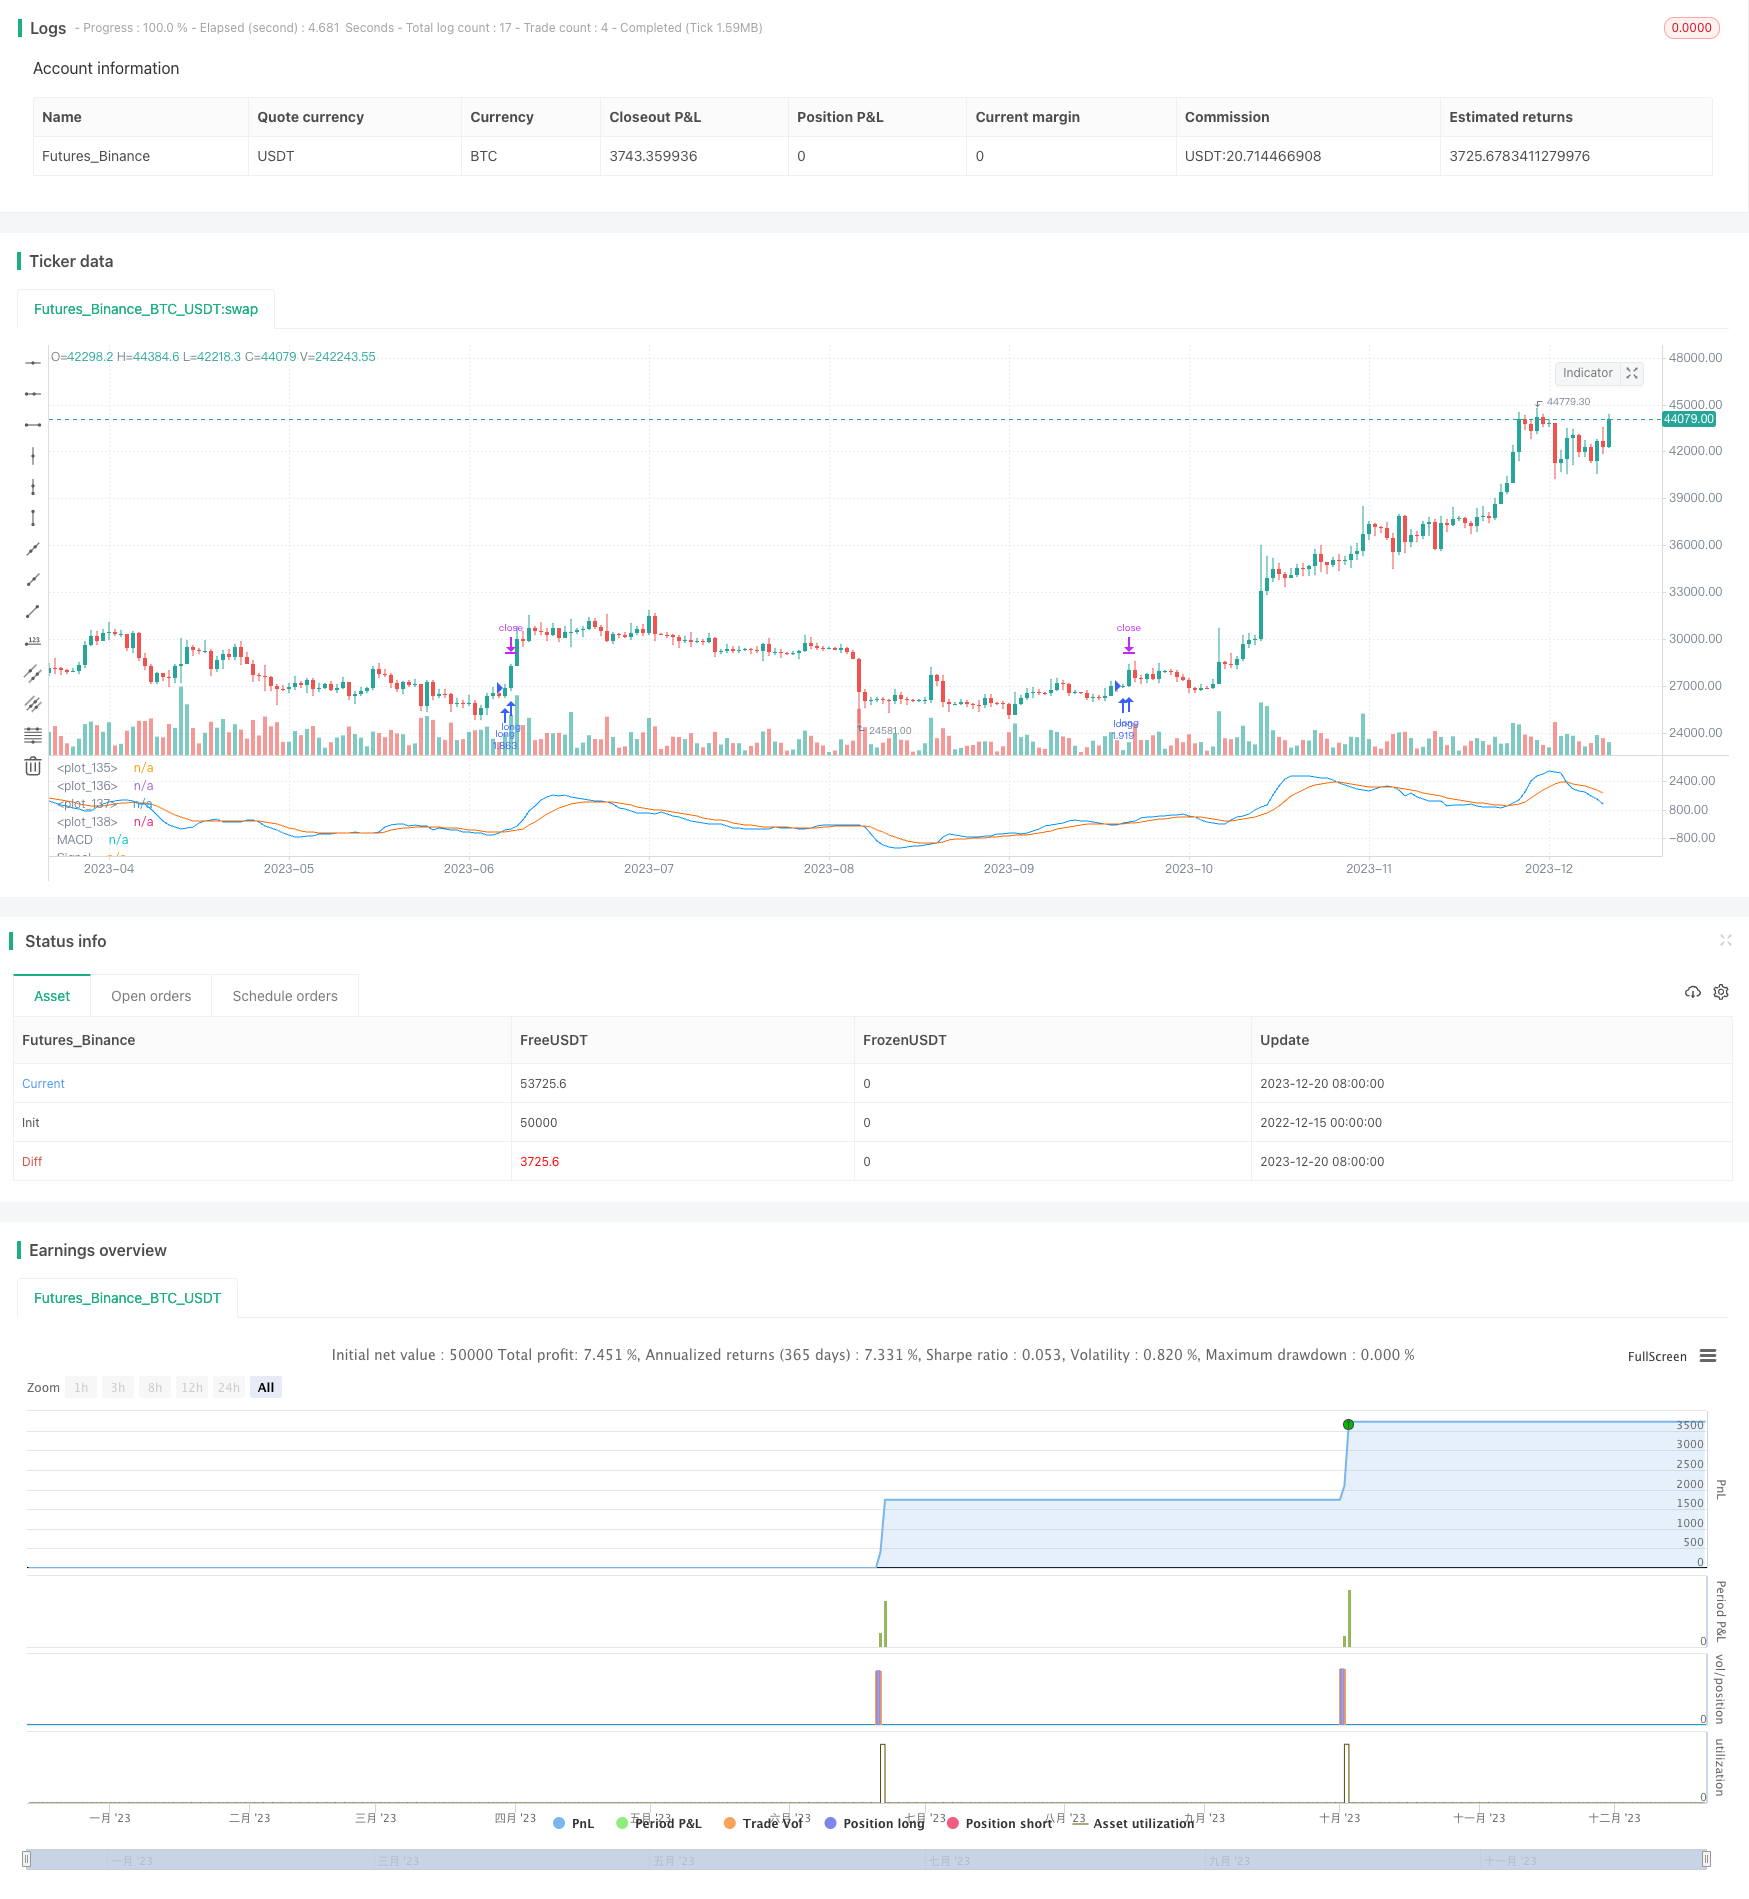
/*backtest
start: 2022-12-15 00:00:00
end: 2023-12-21 00:00:00
period: 1d
basePeriod: 1h
exchanges: [{"eid":"Futures_Binance","currency":"BTC_USDT"}]
*/

//(c) Wunderbit Trading
//Modified by Mauricio Zuniga - Trade at your own risk
//This script was originally shared on Wunderbit website as a free open source script for the community. (https://help.wundertrading.com/en/articles/5246468-macd-mfi-trading-bot-for-ftx)
//
//WHAT THIS SCRIPT DOES:
//   This is a scalping script originally intended to be used on altorightmic bot trading.
//   This strategy is based on the trend-following momentum indicator. It includes the Money Flow index as an additional point for entry.
//HOW IT DOES IT:
//   It uses a combination of MACD and MFI indicators to create entry signals.  Parameters for each indicator have been surfaced for user configurability.
//   Take profits are fixed, but stop loss uses ATR configuration to minimize losses and close profitably.
//HOW IS MY VERSION ORIGINAL:
//   I started trying to deploy this script myself in my algorithmic tradingg but ran into some issues which I have tried to address in this version.
//   Delayed Signals : The script has been refactored to use a time frame drop down.  The higher time frame can be run on a faster chart (recommended on one minute chart for fastest signal confirmation and relay to algotrading platform.
//   Repainting Issues : All indicators have been recoded to use the security function that checks to see if the current calculation is in realtime, if it is, then it uses the previous bar for calculation.
//   If you are still experiencing repainting issues based on intended (or non intended use), please provide a report with screenshot and explanation so I can try to address.
//   Filtering :  I have added to additional filters an ABOVE EMA Filter and a BELOW RSI Filter (both can be turned on and off)
//   Customizable Long and Clos Messages : This allows someone to use the script for algorithmic trading without having to alter code.  It also means you can use one indicator for all of your different alterts required for your bots.
//HOW TO USE IT:
//   Find a pair with high volatility - I have found it works particularly well with 3L and 3S tokens for crypto. although it the limitation is that confrigurations I have found to work typically have low R/R ratio, but very high win rate and profit factor.
//   Ieally set one minute chart for bots, but you can use other charts for manual trading.  The signal will be delayed by one bar but I have found configurations that still test well.
//   Select a time frame in configuration for your indicator calculations.
//   I like ot use 5 and 15 minutes for scalping scenarios, but I am interested in hearing back from other community memebers.
//   Optimize your indicator without filters (trendFilter and RSI Filter)
//   Use the TrendFilter and RSI Filter to further refine your signals for entry.

//@version=4
strategy("Customizable HTF MACD Strategy v1.2", overlay=false, pyramiding=0, commission_type=strategy.commission.percent, commission_value=0.07, default_qty_type = strategy.percent_of_equity, default_qty_value = 100, currency = currency.USD)

openlongcomment = "Comment In Here"
closelongcomment = ""
openshortcomment = ""
closeshortcommment = ""
//RES
res = input(title="Resolution", type=input.resolution, defval="5", group="Strategy", inline="1")
comment = input(title="Open Long Comment", type=input.string, defval="",group="Strategy", inline="1")

if not(comment == "")
    openlongcomment := comment
// FUNCTIONS

Ema(src,p) =>
    ema = 0.
    sf = 2/(p+1)
    ema := nz(ema[1] + sf*(src - ema[1]),src)

Sma(src,p) => a = cum(src), (a - a[max(p,0)])/max(p,0)

Atr(p, res) =>
    atr = 0.
    highHTF = security(syminfo.tickerid, res, high[barstate.isrealtime ? 1 : 0])
    lowHTF = security(syminfo.tickerid, res, low[barstate.isrealtime ? 1 : 0])
    closeHTF = security(syminfo.tickerid, res, close[barstate.isrealtime ? 1 : 0])
    Tr = max(highHTF - lowHTF, max(abs(highHTF - closeHTF[1]), abs(lowHTF - closeHTF[1])))
    atr := nz(atr[1] + (Tr - atr[1])/p,Tr)


ribbon_period = input(39, "Period", step=1)

htfClose = security(syminfo.tickerid, res, close[barstate.isrealtime ? 1 : 0])

leadLine1 = ema(htfClose, ribbon_period)
leadLine2 = sma(htfClose, ribbon_period)

// p3 = plot(leadLine1, color= #53b987, title="EMA", transp = 50, linewidth = 1)
// p4 = plot(leadLine2, color= #eb4d5c, title="SMA", transp = 50, linewidth = 1)
// fill(p3, p4, transp = 60, color = leadLine1 > leadLine2 ? #53b987 : #eb4d5c)

//Upward Trend
UT=leadLine2 < leadLine1
DT=leadLine2>leadLine1
//FILTER LOGIC
aboveTrend = input(true, title="Use Trend", group="Filters", inline='1', type=input.bool)
TrendLength  = input(3, minval=1, title="Trend MA", group="Filters", inline='1', type=input.integer)
aboveTrendFilter = sma(htfClose,TrendLength)

useRSI = input(true, title="Use RSI", group="Filters", inline='2', type=input.bool)
RSILength  = input(34, minval=1, title="RSI Length", group="Filters", inline='2') // used to calculate RSI
belowRSIFilter  = input(50, minval=1, title="Buy Below RSI Filter", group="Filters", inline='2') // only buy if its below this RSI - doesn't seem to work as expected
rsi = rsi(htfClose,RSILength)

if not(useRSI)
    belowRSIFilter = 100
if not(aboveTrend)
    aboveTrendFilter = -1


// MACD
fast_length = input(title="Fast Length", type=input.integer, defval=7)
slow_length = input(title="Slow Length", type=input.integer, defval=23)
src = input(title="Source", type=input.source, defval=close)
signal_length = input(title="Signal Smoothing", type=input.integer, minval = 1, maxval = 50, defval = 10)
sma_source = input(title="Simple MA(Oscillator)", type=input.bool, defval=false)
sma_signal = input(title="Simple MA(Signal Line)", type=input.bool, defval=false)

// Plot colors
col_grow_above = #26A69A
col_grow_below = #FFCDD2
col_fall_above = #B2DFDB
col_fall_below = #EF5350
col_macd = #0094ff
col_signal = #ff6a00


srcHTF = security(syminfo.tickerid, res, src[barstate.isrealtime ? 1 : 0])
// Calculating
fast_ma = sma_source ? Sma(srcHTF, fast_length) : Ema(srcHTF, fast_length)
slow_ma = sma_source ? Sma(srcHTF, slow_length) : Ema(srcHTF, slow_length)

macd = fast_ma - slow_ma
signal = sma_signal ? Sma(macd, signal_length) : Ema(macd, signal_length)
hist = macd - signal

//plot(hist, title="Histogram", style=plot.style_columns, color=(hist>=0 ? (hist[1] < hist ? col_grow_above : col_fall_above) : (hist[1] < hist ? col_grow_below : col_fall_below) ), transp=0 )
plot(macd, title="MACD", color=col_macd, transp=0)
plot(signal, title="Signal", color=col_signal, transp=0)

/// MFI

MFIsource = hlc3
sourceHTF = security(syminfo.tickerid, res, MFIsource[barstate.isrealtime ? 1 : 0])
length = input(15, minval=1)
lower = input(12, minval=0, maxval=50)
upper = input(80, minval=50, maxval=100)

// DrawMFI_f=input(true, title="Draw MFI?", type=bool)
HighlightBreaches=input(true, title="Highlight Oversold/Overbought?")

volumeHTF = security(syminfo.tickerid, res, volume[barstate.isrealtime ? 1 : 0])

// MFI
upper_s = sum(volumeHTF * (change(sourceHTF) <= 0 ? 0 : sourceHTF), length)
lower_s = sum(volumeHTF * (change(sourceHTF) >= 0 ? 0 : sourceHTF), length)
mf = rsi(upper_s, lower_s)
mfp = plot(mf, color=color.new(color.gray,0), linewidth=1)
top = hline(upper, color=color.new(color.gray, 100), linewidth=1, editable=false)
bottom = hline(lower, color=color.new(color.gray,100), linewidth=1, editable=false)
hline(0, color=color.new(color.black,100), editable=false)
hline(100, color=color.new(color.black,100), editable=false)

// Breaches
b_color = (mf > upper) ? color.new(color.red,70) : (mf < lower) ? color.new(color.green,60) : na
bgcolor(HighlightBreaches ? b_color : na)

fill(top, bottom, color=color.gray, transp=75)

// TAKE PROFIT AND STOP LOSS
long_tp1_inp = input(1, title='Long Take Profit 1 %', step=0.1)/100
long_tp1_qty = input(20, title="Long Take Profit 1 Qty", step=1)

long_trailing = input(1.3, title='Trailing Stop Long', step=0.1) / 100

long_take_level_1 = strategy.position_avg_price * (1 + long_tp1_inp)

// Stop Loss
multiplier = input(2, "SL Mutiplier", minval=1, step=0.1)
ATR_period=input(40,"ATR period", minval=1, step=1)

// Strategy
entry_long=(crossover(macd,signal) or (crossover(mf,lower) and leadLine2 < leadLine1)) and rsi < belowRSIFilter and close > aboveTrendFilter
entry_price_long=valuewhen(entry_long,close,0)
//SL_floating_long = entry_price_long -( (entry_price_long)*multiplier/100)//*Atr(ATR_period,res)
//SL_floating_long = entry_price_long - multiplier*Atr(ATR_period,res)
SL_floating_long = entry_price_long - multiplier*Atr(ATR_period,res)
exit_long= close < SL_floating_long

///// BACKTEST PERIOD ///////
testStartYear = input(2018, "Backtest Start Year")
testStartMonth = input(1, "Backtest Start Month")
testStartDay = input(1, "Backtest Start Day")
testPeriodStart = timestamp(testStartYear, testStartMonth, testStartDay, 0, 0)

testStopYear = input(9999, "Backtest Stop Year")
testStopMonth = input(12, "Backtest Stop Month")
testStopDay = input(31, "Backtest Stop Day")
testPeriodStop = timestamp(testStopYear, testStopMonth, testStopDay, 0, 0)

testPeriod() =>
    time >= testPeriodStart and time <= testPeriodStop ? true : false

if testPeriod()
    if UT
        strategy.entry("long", strategy.long, when=entry_long == true, comment=openlongcomment)
    strategy.exit("TP1","long", qty_percent=long_tp1_qty, limit=long_take_level_1)
    strategy.exit("Trail stop","long",  comment=closelongcomment,  trail_points=entry_price_long * long_trailing / syminfo.mintick, trail_offset=entry_price_long * long_trailing / syminfo.mintick)
    strategy.close("long", exit_long == true,  comment=closelongcomment )