ڈوئل موونگ ایوریج کراس اوور حکمت عملی کا استعمال
جائزہ
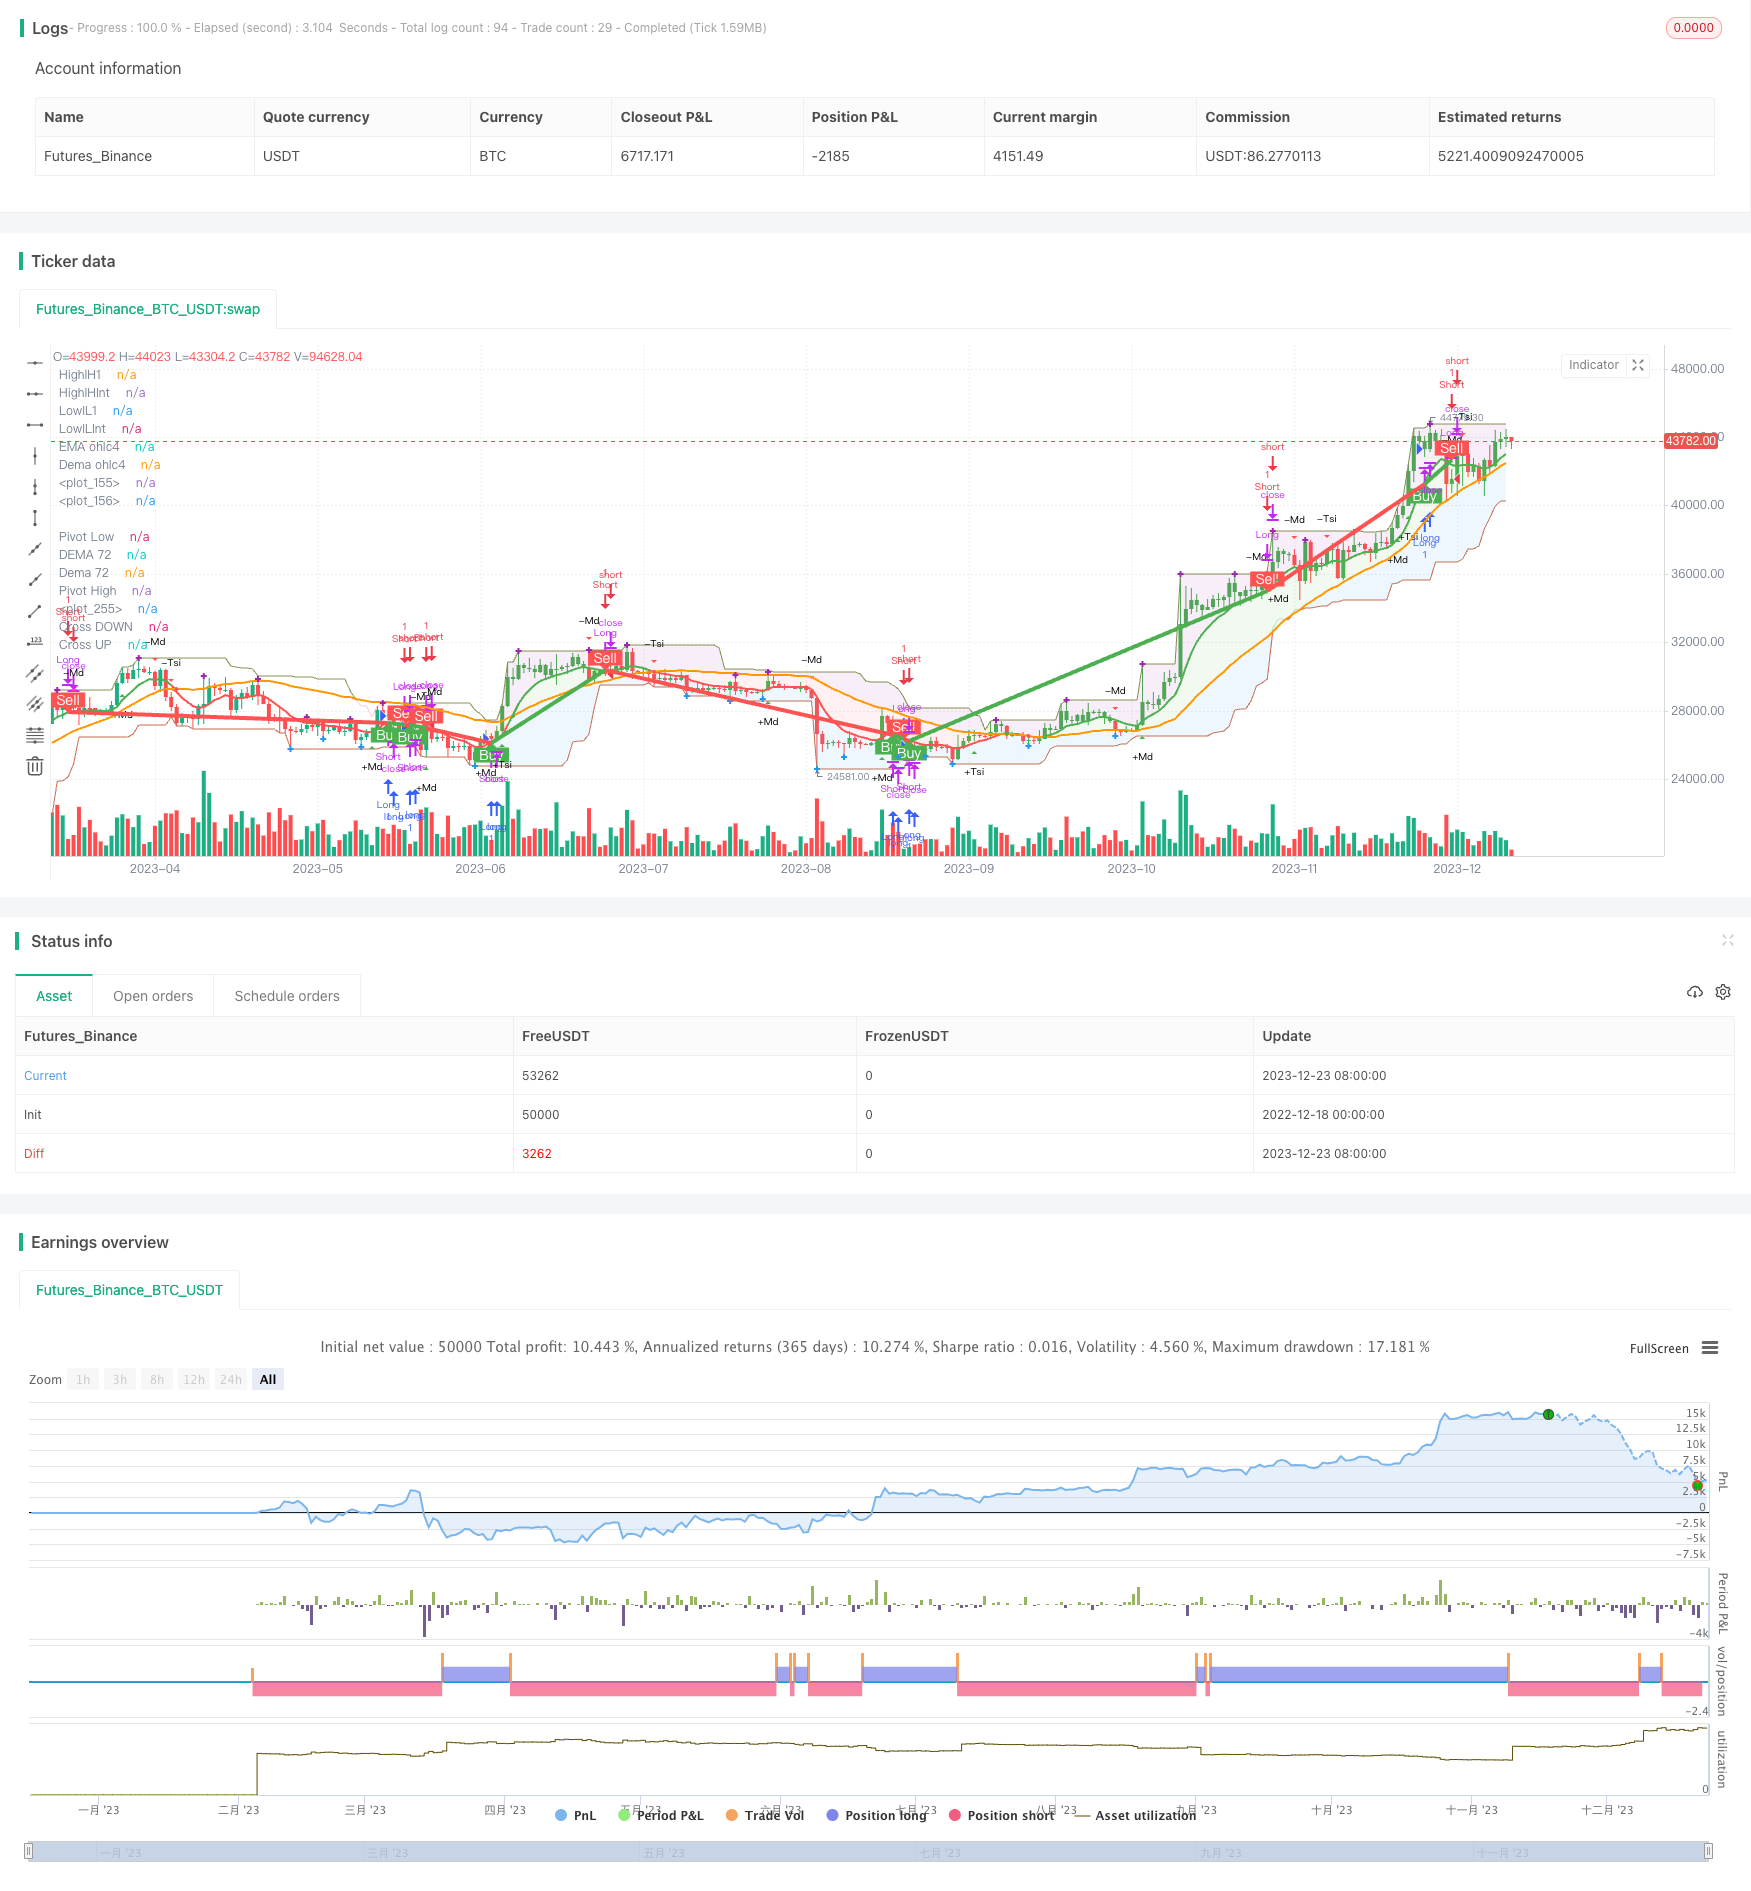
یہ ایک سادہ مقدار کی حکمت عملی ہے جس میں دوہری حرکت پذیر اوسط کو خرید اور فروخت کے سگنل کے طور پر استعمال کیا جاتا ہے۔ اس میں دو مختلف دورانیے کی ایم اے لائنیں استعمال کی جاتی ہیں ، جب ایک مختصر دورانیے کی ایم اے لائن نیچے سے طویل دورانیے کی ایم اے لائن کو عبور کرتی ہے تو خریدنے کا اشارہ پیدا کرتی ہے۔ جب ایک مختصر دورانیے کی ایم اے اوپر سے نیچے سے طویل دورانیے کی ایم اے کو عبور کرتی ہے تو بیچنے کا اشارہ پیدا کرتی ہے۔
حکمت عملی کا اصول
یہ حکمت عملی 8 ای ایم اے اور 72 ای ایم اے کی مدت کے قریب قیمتوں کا حساب کتاب کرکے چارٹ پر ڈرائنگ کرتی ہے۔ جب 8 ای ایم اے کے اوپر 72 ای ایم اے کی حد ہوتی ہے تو ، خریدنے کا اشارہ ہوتا ہے۔ جب 8 ای ایم اے کے نیچے 72 ای ایم اے کی حد ہوتی ہے تو ، فروخت کا اشارہ ہوتا ہے۔
اس حکمت عملی کی بنیادی مفروضہ یہ ہے کہ: مختصر مدت کے ایم اے لائن حالیہ قیمت کے رجحان اور رفتار کی نمائندگی کرتی ہے ، اور طویل مدت کے ایم اے لائن طویل مدتی رجحان کی نمائندگی کرتی ہے۔ جب مختصر ایم اے پر طویل عرصے سے ایم اے کا نشانہ بنایا جاتا ہے ، تو یہ ظاہر ہوتا ہے کہ قلیل مدتی رجحان مضبوط ہورہا ہے ، جس کی وجہ سے قیمت طویل مدتی اوسط سے تجاوز کر رہی ہے ، لہذا خرید سکتے ہیں۔ جب مختصر ایم اے کے نیچے طویل عرصے سے ایم اے کا نشانہ بنایا جاتا ہے ، تو یہ ظاہر ہوتا ہے کہ قلیل مدتی عروج ختم ہوچکا ہے اور طویل مدتی حمایت کی سطح کو توڑ دیا گیا ہے ، فروخت پر غور کیا جانا چاہئے۔
اس حکمت عملی میں ولیم٪ R اشارے کا استعمال بھی کیا گیا ہے تاکہ اوورلوڈ اوور سیل علاقوں کا تعین کیا جاسکے ، اور MACD اشارے قیمت کی نقل و حرکت کی سمت کا تعین کرنے کے لئے تجارتی فیصلے کے لئے حوالہ فراہم کریں۔ اس کے علاوہ ، حکمت عملی میں کچھ معاون اشارے بھی قائم کیے گئے ہیں جیسے ڈیما ، پیووٹس وغیرہ تجزیہ کی تحریک میں مدد کے لئے۔
طاقت کا تجزیہ
ڈبل ایم اے کراسنگ کی حکمت عملی کا سب سے بڑا فائدہ یہ ہے کہ یہ سمجھنے میں آسان ہے اور اس پر عمل درآمد کرنا آسان ہے۔ صرف دو ایم اے کے کراسنگ پر انحصار کرنے سے ، آپ کو پیچیدہ ماڈل اور پیرامیٹرز کی اصلاح کی ضرورت کے بغیر ، قواعد کے مطابق تجارتی سگنل پیدا کرنے کی ضرورت ہے۔
ایک اور فائدہ یہ ہے کہ ایم اے کراسنگ حکمت عملی رجحان سازی مارکیٹ میں بہتر کارکردگی کا مظاہرہ کرتی ہے۔ جب اسٹاک کی قیمتوں میں نمایاں طور پر اوپر یا نیچے کی طرف رجحان ہوتا ہے تو ، ایم اے کراسنگ حکمت عملی بڑے رجحان کو بہتر طور پر فائدہ اٹھانے کے لئے استعمال کرسکتی ہے۔
خطرے کا تجزیہ
ڈبل ایم اے کراسنگ حکمت عملی میں بھی کچھ خطرات موجود ہیں جن پر دھیان دینے کی ضرورت ہے۔ پہلے ، اتار چڑھاؤ والی منڈیوں میں ، ایم اے لائن کراسنگ کثرت سے ہوتی ہے ، جس سے غلط سگنل اور سلسلہ وار نقصان کا خطرہ ہوتا ہے۔ دوسرا ، ایم اے کراسنگ سگنل اکثر تاخیر کا شکار ہوتا ہے ، جو اچانک واقعات کے اثرات کو بروقت ظاہر نہیں کرسکتا ہے۔ آخر میں ، پیرامیٹرز کی ترتیب جیسے ایم اے کی مدت کی لمبائی کو تجربے سے ایڈجسٹ کرنے کی ضرورت ہے۔
دیگر اشارے کے ساتھ مل کر سگنل کی تصدیق ، ایم اے پیرامیٹرز کو بہتر بنانے ، یا رجحان میں واضح مارکیٹ آپریشن کے ذریعہ خطرے کو کم کرنے کے لئے استعمال کیا جاسکتا ہے۔ اس کے علاوہ ، اسٹاپ نقصان کی روک تھام ، پوزیشن مینجمنٹ وغیرہ بھی بہت اہم ہیں۔
اصلاح کی سمت
اس سادہ ڈبل ایم اے حکمت عملی کو مندرجہ ذیل طریقوں سے بہتر بنایا جاسکتا ہے:
- بہترین پیرامیٹرز کو تلاش کرنے کے لئے مختلف ایم اے دورانیہ پیرامیٹرز کے مجموعے کی جانچ؛
2۔ حکمت عملی کو مستحکم بنانے کے لیے دیگر اشارے جیسے MACD، KDJ وغیرہ کے ساتھ سگنل فلٹرنگ۔
ایک متحرک باہر نکلنے کا طریقہ کار قائم کریں جو صرف فکسڈ اقدار کے بجائے بہترین سٹاپ نقصان کی پوزیشنوں کو ٹریک کرے۔
مارکیٹ کی حالت کے مطابق ایڈجسٹ ایم اے سائیکل کو اپنانا ، پیرامیٹرز کو بہتر بنانا؛
اعلی درجے کی مشین سیکھنے اور گہری سیکھنے کے ماڈل کے ساتھ مل کر ، سگنل کی درستگی کو بہتر بنانے کے لئے پیش گوئی کریں۔
خلاصہ کریں۔
یہ حکمت عملی ایک سادہ ڈبل ایم اے کراسنگ حکمت عملی کے طور پر کام کرتی ہے ، اگرچہ اس میں کچھ تاخیر اور جعلی سگنل کی دشواری ہے ، لیکن یہ سمجھنے اور اس پر عمل درآمد کرنے میں آسان ہے۔ کچھ اصلاح اور ترمیم کے ساتھ ، یہ ایک بنیادی اور عملی مقدار کی تجارت کی حکمت عملی بن سکتی ہے۔
/*backtest
start: 2022-12-18 00:00:00
end: 2023-12-24 00:00:00
period: 1d
basePeriod: 1h
exchanges: [{"eid":"Futures_Binance","currency":"BTC_USDT"}]
*/

// This source code is subject to the terms of the Mozilla Public License 2.0 at https://mozilla.org/MPL/2.0/
// © DalmarSantos
//@version=4
//Entry and Exit points to TRADE ==> Pontos de Entrada e Saida de TRADE
//Functions in use ==> Funções em uso
//(1) DEMA - Double Exponential Moving Average 08/17/34/72 ==> Média Móvel Exponencial Dupla
//(2) ema() - Exponential Moving Averge 72/ochl4 ==> Média Móvel Exponencial
//(3) plot()
//(4) barcolor()
//(5) cross()
//(6) pivots()
//(7) William R% Md
//(8) Maximum and Minimum Value
//(9) fill()
//(10) macd() - Moving Average Convergence Divergence
//(11) tsi() - Trading Strenght Indicator==> Índice de Força Real (IFR)
//(12) Buy and Sell TRADE Points
//(13) Strategy Buy and Sell TRADE Points
strategy("[DS]Entry_Exit_TRADE.V01-Strategy", overlay=true)
//variable ==> variáveis
return = input(title="Return Candels ?", type=input.integer, defval=190) //quantity of candles to analise ==> quantidade de candles para analise
//
//****************************
//Function==> Função | (1)DEMA
//****************************
//Dema 08
e1 = ema(close,8)
e2 = ema(e1,8)
dema08 = 2 * e1 - e2
//
//Dema 17
e1 := ema(close,17)
e2 := ema(e1,17)
dema17 = 2 * e1 - e2
//
//Dema 34
e1 := ema(close,34)
e2 := ema(e1,34)
dema34 = 2 * e1 - e2
//
//Dema 72
e1 := ema(close,72)
e2 := ema(e1,72)
dema72 = 2 * e1 - e2
//
//******************************
//Function==> Função | (2) ema()
//******************************
ema72 = ema(close,72)
emaOhlc4=ema(ohlc4,8)
//
//******************************
//Function==> Função | (3)plot()
//******************************
//
////Show the avareges ==> Apresenta as médias
//plot(dema17, title="DEMA 17", color=color.new(color.lime,0), linewidth=1, style=plot.style_line, transp=0, show_last=return) // Doble Exponential Moving Avarage 17
//plot(dema34, title="DEMA 34", color=color.new(color.black,0), linewidth=1, style=plot.style_line, transp=0, show_last=return) // Doble Exponential Moving Avarage 34

plot(dema72, title="DEMA 72", color=color.orange, linewidth=2, style=plot.style_line, transp=0, show_last=return) // Doble Exponential Moving Avarage 72
plot(emaOhlc4, title="EMA ohlc4", color=emaOhlc4>dema72 ? color.new(color.green,0) : color.new(color.red,0), linewidth=2, style=plot.style_line, transp=0, show_last=return) // Doble Exponential Moving Avarage 72
//
//***********************************
//Function==> Função | (4) barcolor()
//***********************************
//Show color TRADE bar if emaOhlc4>dema72 green (Buy) if not red (Red) ==> Mostra a cor da barra de TRADE se emaOhlc4>dema72 verde (Compra) se não vermelha (Venda)
barcolor(close>dema34 and close>dema72 or close>close[1]  ? color.new(color.green,0) : color.new(color.red,0), show_last=return)
//
//********************************
//Function==> Função | (5) cross()
//********************************
// Show the intersections crossing average on the graph ==> Apresenta no gráfico o local dos cruzamentos das médias
//UP ==> para CIMA
plot(crossover(emaOhlc4,dema72) ? dema72 : na, title="Cross UP", color=color.green, transp=0, style=plot.style_circles, linewidth=5, show_last=return)
//DOWM ==> para BAIXO
plot(crossunder(emaOhlc4,dema72) ? dema72 : na, title="Cross DOWN", color=color.red, transp=50, style=plot.style_circles, linewidth=5, show_last=return)
//
//********************************
//Function==> Função | (6) pivot()
//Reference: Pine Script Manual
//********************************
_Pivots	= input(title = "══════ Pivots ══════", type = input.bool, defval = false)
leftBars = input(4)
rightBars=input(4)
pivotHigh = pivothigh(leftBars, rightBars) //pivot de alta
plot(pivotHigh>ema72[rightBars] ? pivotHigh : na, title="Pivot High", style=plot.style_cross, linewidth=3, color= color.purple, transp=50, offset=-rightBars, show_last=return)
pivotLow = pivotlow(leftBars, rightBars) //pivot de baixa
plot(pivotLow<ema72[rightBars] ? pivotLow : na, title="Pivot Low", style=plot.style_cross, linewidth=3, color= color.blue, transp=50, offset=-rightBars, show_last=return)
//
//***************************************
//Function==> Função | (7) WILLIAM R% MOD
//Reference: Pine Script Manual
//***************************************
// Getting inputs
_WilliamR	= input(title = "══════ William R% Mod ══════", type = input.bool, defval = false)
SOB_William = input(title="OverBought Area", type=input.integer, defval=-7) //OverBought area ==> Area de SobreCompra
SOS_William = input(title="OverSold Area", type=input.integer, defval=-93) //OverSold area ==> Area de SobreVenda
length_William = input(17, minval=1) //interval ==> intervalo
highestHigh_William = highest(length_William) //maximum value ==> valor máximo
highestLow_William = lowest(length_William) //minumum value ==> valor mínimo
R_William = (highestHigh_William - close) / (highestHigh_William - highestLow_William) * -100
//Show the position ==> mostra a posição
//plotshape(R_William > SOS_William ? na : high, text="+R%", title="+r(+)%R Up", location=location.belowbar, color=color.green, transp=30, style=shape.triangleup, size=size.tiny, show_last=return)
//plotshape(R_William < SOB_William ? na : low, text="-R%", title="(-)%R DN", location=location.abovebar, color=color.red, transp=30, style=shape.triangledown, size=size.tiny, show_last=return)
//
// Show label with William %R value ==> Mostra a etiqueta com o valor do William %R
// The color label red is when the value arrive on OverBought Area and green on OverSold Area, be careful with these areas ==> O rótulo de cor vermelha é quando o valor chega na área de SobreCompra e verde na área de SobreVenda, cuidado com estas áreas
//
corTest=color.white
colorText = color.white
estilo = label.style_label_upper_left
textW=""
if R_William>SOB_William
    corTest := color.new(color.red,0) //vermelho escuro
    estilo := label.style_label_lower_left
    textW:="OB"

if R_William>-30 and R_William<=SOB_William
    corTest := #f5948e //vermelho intermediário
    estilo := label.style_label_lower_left

if R_William>-50 and R_William<=-30
    corTest := #f5d5d3 //vermelho claro
    colorText := color.black

if R_William>-70 and R_William<=-50
    corTest := #e7f5d3 //verde claro
    colorText := color.black

if R_William>=SOS_William and R_William<=-70
    corTest := color.lime //verde intermediario
    estilo := label.style_label_upper_left
    colorText := color.black

if R_William<SOS_William
    corTest := color.new(color.green,0) // verde escuro
    estilo := label.style_label_upper_left
    textW:="OS"
// Make a label at the high of the current bar
myLabel = label.new(x=bar_index, y=close, style= estilo, color=corTest, text=tostring(R_William,"#.#")+"% "+textW, textcolor=colorText, size=size.normal)
// Get the label text
labelText = label.get_text(id=myLabel)
// Then set the label's text to a new string that
// includes its current text
label.set_text(id=myLabel, text=labelText)
label.delete(myLabel[1])
//
//**************************************************
//Function==> Função | (8) MAXIMUM AND MINIMUM VALUE
//Reference: Pine Script Manual
//**************************************************
//Maximum High and Minimum Low close position ==> Posição Máxima e Minima de fechamento
ExtremoHigh=high+(highestHigh_William-high)
ExtremoLow=low-(low-highestLow_William)
plot(ExtremoHigh, color=color.new(color.red,70), style=plot.style_line, linewidth=1, show_last=return)
plot(ExtremoLow, color=color.new(color.green,70), style=plot.style_line, linewidth=1, show_last=return)
//Show the Extreme High and Low close position ==> Mostra a extrema posicao alta e baixa do fechamento
lH1 = 0.0
lHInt = close
lL1 = close
lLInt = close
Vr_LinhaH=0.0
Vr_LinhaL=0.0
Vr_LinhaC=0.0
if emaOhlc4<dema72
    Vr_LinhaH := high+(highestHigh_William-high)
    lH1 := Vr_LinhaH>dema72 ?  Vr_LinhaH : dema72
    lHInt:=emaOhlc4<dema72 ? dema72 : emaOhlc4
    lLInt := lHInt==emaOhlc4 ? dema72 : emaOhlc4
    Vr_LinhaL:= low-(low-highestLow_William)
    lL1 := Vr_LinhaL>lLInt ?  lLInt : Vr_LinhaL

if emaOhlc4>dema72
    Vr_LinhaH := high+(highestHigh_William-high)
    lH1 := Vr_LinhaH>dema72 ?  Vr_LinhaH : dema72
    lHInt:=dema72>emaOhlc4 ? dema72 : emaOhlc4
    lLInt := lHInt==dema72 ? emaOhlc4 : dema72
    Vr_LinhaL:= low-(low-highestLow_William)
    lL1 := Vr_LinhaL>lLInt ?  lLInt : Vr_LinhaL
//
//*******************************
//Function==> Função | (9) fill()
//Reference: Pine Script Manual
//*******************************
//Show TRADE area in red (Sell) and green (Buy) ==> Mostra a área de trade em vermelho (Venda) e verde (Compra)
Line1 = plot(emaOhlc4, title="Dema ohlc4", color=color.new(color.white,100), linewidth=1, transp=0, show_last=return)
Line2 = plot(dema72,  title="Dema 72", color=color.new(color.white,100), linewidth=1,transp=0, show_last=return)
fill(Line1, Line2, color=emaOhlc4>dema72 ? color.new(color.green,90) : color.new(color.red,90), transp=70, show_last=return)

//High area ==> Area de alta
HighlH1 = plot(lH1, title="HighlH1", color=color.green, linewidth=1, transp=90, show_last=return, style=plot.style_linebr)
HighlHInt = plot(lHInt, title="HighlHInt", color=color.green, linewidth=1, transp=100, show_last=return, style=plot.style_linebr)
fill(HighlH1, HighlHInt, color=color.new(color.purple,90),  transp=0, show_last=return)

//Low area ==> Area de baixa
LowlL1 = plot(lL1, title="LowlL1", color=color.red, linewidth=1, transp=90, show_last=return, style=plot.style_linebr)
LowlLInt = plot(lLInt, title="LowlLInt", color=color.red, linewidth=1, transp=100, show_last=return, style=plot.style_linebr)
fill(LowlL1, LowlLInt, color=color.new(color.blue,90),  transp=0, show_last=return)
//
//***************************************************************************
//Function==> Função | (10) macd() - Moving Average Convergence Divergence
//Reference: Pine Script Manual - adapted TradingView version - Dalmar Santos
//***************************************************************************
// Getting inputs
_Macd	= input(title = "═════ Macd ══════════", type = input.bool, defval = false)
fast_length_Macd = input(title="Fast Length", type=input.integer, defval=12)
slow_length_Macd = input(title="Slow Length", type=input.integer, defval=26)
src_Macd = input(title="Source", type=input.source, defval=close)
signal_length_Macd = input(title="Signal Smoothing", type=input.integer, minval = 1, maxval = 50, defval = 9)
// Calculating
fast_ma_Macd = ema(src_Macd, fast_length_Macd)
slow_ma_Macd = ema(src_Macd, slow_length_Macd)
macd_Macd = fast_ma_Macd - slow_ma_Macd
signal_Macd = ema(macd_Macd, signal_length_Macd)
hist_Macd = macd_Macd - signal_Macd
//cross Macd
MacdUp = crossover(macd_Macd,signal_Macd) ? 1 : 0
MacdDown = crossunder (macd_Macd,signal_Macd) ? 1 : 0
plotshape(MacdUp, text="+Md", title="(+)MACD UP", location=location.belowbar, color=color.green, transp=30, style=shape.triangleup, size=size.tiny, show_last=return)
plotshape(MacdDown, text="-Md", title="(-)MACD DN", location=location.abovebar, color=color.red, transp=30, style=shape.triangledown, size=size.tiny, show_last=return)
//
//*****************************************************************************************
//Function==> Função | (11) tsi() - Trading Strenght Indicator ==> Indice de Força do Trading
//Reference: Pine Script Manual - adapted TradingView version - Dalmar Santos
//*****************************************************************************************
_Tsi	= input(title = "═════ Tsi ══════════", type = input.bool, defval = false)
long_tsi = input(title="Long Length", type=input.integer, defval=72)
short_tsi = input(title="Short Length", type=input.integer, defval=17)
signal_tsi = input(title="Signal Length", type=input.integer, defval=17)
price_tsi = close
double_smooth(src_tsi, long_tsi, short_tsi) =>
	fist_smooth_tsi = ema(src_tsi, long_tsi)
	ema(fist_smooth_tsi, short_tsi)
pc_tsi = change(price_tsi)
double_smoothed_pc_tsi = double_smooth(pc_tsi, long_tsi, short_tsi)
double_smoothed_abs_pc_tsi = double_smooth(abs(pc_tsi), long_tsi, short_tsi)
tsi_value_tsi = 100 * (double_smoothed_pc_tsi / double_smoothed_abs_pc_tsi)
//TSI signal ==> Signal do TSI
TsiUp = crossover(tsi_value_tsi,ema(tsi_value_tsi, signal_tsi)) ? 1 : 0
TsiDown = crossunder(tsi_value_tsi,ema(tsi_value_tsi, signal_tsi)) ? 1 : 0
//Show the Position ==> Mostra a posicao
plotshape(TsiUp==1 ? low : na, text="+Tsi", title="(+)TSI Up", location=location.belowbar, color=color.green, transp=30, style=shape.triangleup, size=size.tiny, show_last=return)
plotshape(TsiDown==1 ? high : na, text="-Tsi", title="(-)TSI DN", location=location.abovebar, color=color.red, transp=30, style=shape.triangledown, size=size.tiny, show_last=return)
//
//***************************************************************************
//Function==> Função | (12) Buy and Sell TRADE Points
//Reference: Pine Script Manual - adapted TradingView version - Dalmar Santos
//***************************************************************************
//Cross Point ==> pontos de cruzamento
crossUP=crossover(emaOhlc4,dema34)
crossDN=crossunder(emaOhlc4,dema34)
//Show de Buy and Sell points ==> mostra pontos de compra e venda
tradeColor=crossUP ? color.red : crossDN ? color.green : na
//line buy or sell ==> linha de compra ou venda
plot(crossUP ? dema34 : crossDN ? dema34: na, color=tradeColor, style=plot.style_line, linewidth=4, editable=false, show_last=return)
//Buy point ==> pontos de compra
plotshape(crossUP ? dema34 : na, style=shape.labelup, location=location.absolute, text="Buy", transp=0, textcolor = color.white, color=color.green, editable=false, show_last=return)
//Sell points ==> pontos de venda
plotshape(crossDN ? dema34: na, style=shape.labeldown, location=location.absolute, text="Sell", transp=0, textcolor = color.white, color=color.red, editable=false, show_last=return)
//
//************************************************************
//Function==> Função | (13) Strategy Buy and Sell TRADE Points
//Reference: Pine Script Manual - Dalmar Santos
//************************************************************
//Start backtest year, month, day, hour, minute, second ==> Inicio do backtest ano, mês, dia, hora, minuto, segundo
start = timestamp(2021,01,01,1,00,00)
//*****************
//BUY ==> COMPRA
//*****************
if time>= start
    if crossUP
        strategy.close("Short", comment="Close Sell")
        strategy.entry("Long", strategy.long, 1, comment="Open Buy")

//*****************
//SELL ==> Venda
//*****************
    if crossDN
        strategy.close("Long", comment="Close Buy")
        strategy.entry("Short", strategy.short, 1, comment="Open Sell")