RSI اور ویٹڈ موونگ ایوریج پر مبنی حکمت عملی کی پیروی کا رجحان
جائزہ
یہ حکمت عملی دو مشہور اشارے پر مبنی ہے: نسبتا weak مضبوط اشارے ((RSI) اور وزن میں چلنے والی اوسط ((وزنی متحرک اوسط ، WMA) ، جو مارکیٹ کے رجحانات کی نشاندہی کرنے اور اس کی سمت کو ٹریک کرنے کے لئے استعمال کیا جاتا ہے۔ RSI اوور بیئر اور اوور سیل کا تعین کرنے کے لئے استعمال کیا جاتا ہے ، اور WMA قیمت کے رجحان کا تعین کرنے کے لئے استعمال کیا جاتا ہے ، دونوں کا استعمال غیر متعلقہ سگنل کو مؤثر طریقے سے فلٹر کرنے اور منافع کمانے کے امکانات کو بڑھانے کے لئے کیا جاتا ہے۔ یہ ایک درمیانی اور طویل مدتی حکمت عملی ہے ، جبکہ فنڈ مینجمنٹ کے طریقوں کے ساتھ مل کر ، منافع بخش حالات کے مطابق پوزیشن کو ایڈجسٹ کیا جاسکتا ہے۔
حکمت عملی کا اصول
RSI اشارے
RSI سب سے زیادہ مشہور اوورلوڈ اوور سیلنگ اشارے میں سے ایک ہے۔ اس کا فارمولا ہے:
\[RSI = 100 - \frac{100}{1+\frac{AvgGain}{AvgLoss}}\]
جہاں AvgGain ایک خاص دورانیے میں اختتامی قیمت کھلنے کی قیمت سے زیادہ دن کی کل تعداد کے لئے اختتامی قیمت کا مجموعہ ہے اور AvgLoss اختتامی قیمت کھلنے کی قیمت سے کم دن کی کل تعداد کے لئے اختتامی قیمت کی مطلق قیمت کا مجموعہ ہے۔
اس حکمت عملی میں آر ایس آئی کا دورانیہ 20 پر طے کیا گیا ہے ، جو رجحانات کا فیصلہ کرنے کا ایک اشارہ ہے۔ آر ایس آئی 60 سے زیادہ ہونے پر کثیر سر سگنل پیدا کرتا ہے ، اور 40 سے کم ہونے پر خالی سر سگنل پیدا کرتا ہے۔
وزن والی حرکت پذیر اوسط WMA
ڈبلیو ایم اے ایس ایم اے کے مقابلے میں حالیہ قیمتوں میں زیادہ سختی سے کام کرتا ہے۔ اس کا حساب کتاب فارمولہ ہے:
\[WMA = \frac{\sum_{i=1}^n w_i x_i}{\sum_{i=1}^n w_i}\]
w وزن ہے، i کے اضافے کے ساتھ w اشاریہ طور پر بڑھتی ہے۔ اس حکمت عملی کے لئے استعمال ہونے والا وزن فارمولا ہے:
\[w = \begin{cases} 100/(4+(n-4)*1.3), & i <= 3 \ 1.3*w, & i > 3 \end{cases}\]
اس کا مطلب یہ ہے کہ حالیہ 3 دنوں کا وزن ایک جیسا ہے ، اور اس کے بعد ہر ایک دن پہلے کے وزن میں 1.3 گنا اضافہ ہوتا ہے۔ اس طرح حالیہ قیمتوں کے اثر کو اجاگر کیا جاسکتا ہے۔
اس حکمت عملی میں، WMA کی لمبائی 20 دن ہے۔
حکمت عملی سگنل
کثیر سر سگنل: RSI > 60 اور WMA 20 دن ROC < -1
خالی سر سگنل: RSI < 40 اور WMA 20 دن ROC > 1
WMA کے 20 دن ROC کے حساب کے لئے فارمولہ یہ ہے:
\[ROC = (WMA_{آج}/WMA_{20دن پہلے} - 1) \times 100\]
اسٹریٹجک فوائد
- رجحانات کی سمت کا تعین کرنے کے لئے آر ایس آئی کا استعمال کریں اور مارکیٹ میں ہلچل سے بچنے سے بچیں
- ڈبلیو ایم اے نے حالیہ وزن میں کمی کے ذریعے اہم رجحانات کا جائزہ لیا
- آر ایس آئی اور ڈبلیو ایم اے آر او سی کے ساتھ مل کر استعمال کیا جاتا ہے تاکہ غیر متعلقہ سگنل کو مؤثر طریقے سے فلٹر کیا جاسکے
- متعدد اے ٹی آر رینڈم اسٹاپس کا استعمال کرتے ہوئے ، ٹریکنگ اسٹاپس منافع کو لچکدار طریقے سے لاک کرسکتے ہیں
- فنڈ مینجمنٹ کے طریقوں سے پوزیشن کا سائز نقصانات اور فوائد کے مطابق ایڈجسٹ کیا جاسکتا ہے ، اور خطرات پر قابو پایا جاسکتا ہے
اسٹریٹجک رسک
- غلط حکمت عملی کے پیرامیٹرز کی وجہ سے اکثر تجارت ہوسکتی ہے ، پیرامیٹرز کو بہتر بنانے کی سفارش کی جاتی ہے
- غلط سٹاپ نقصان کی ترتیب نقصان کو بڑھا سکتی ہے
- ٹرینڈ ٹریک کرنے کی حکمت عملی کے طور پر ، یہ زلزلے کے لئے موزوں نہیں ہے۔
- میکرو ماحولیاتی تبدیلیوں پر دھیان دیں ، اور اگر ضروری ہو تو دستی طور پر صفائی کریں
حکمت عملی کی اصلاح کی سمت
- RSI لمبائی، WMA لمبائی، ROC thresholds پر ٹیسٹ کریں اور بہترین پیرامیٹرز کا مجموعہ تلاش کریں
- مختلف فنڈ مینجمنٹ کے طریقوں کو آزمائیں اور پوزیشن ایڈجسٹمنٹ کے بہترین حل تلاش کریں
- مزید فلٹرنگ سگنلز کے لیے دیگر پیمائش کے معیار شامل کریں
- اسٹاپ نقصان کی حکمت عملی کے ساتھ مل کر ، انفرادی نقصان کا خطرہ کم کریں
- اسٹاپ ٹریڈنگ حکمت عملی کو بہتر بنائیں اور رجحانات میں زیادہ سے زیادہ منافع حاصل کریں
خلاصہ کریں۔
اس حکمت عملی میں آر ایس آئی اور ڈبلیو ایم اے دونوں اشارے کا استعمال کیا گیا ہے تاکہ رجحان کی سمت کا تعین کیا جاسکے۔ اس حکمت عملی میں اہم رجحانات سے فائدہ اٹھانے کے لئے درمیانی اور لمبی لائن کا استعمال کیا گیا ہے۔ فنڈ مینجمنٹ اور روک تھام کی حکمت عملی کا استعمال کرتے ہوئے خطرے پر قابو پانے کے ساتھ ساتھ ، اس میں کچھ عملی جنگ کی قیمت ہے۔ لیکن پیرامیٹرز کی ترتیب اور روک تھام کے طریقہ کار کو بہتر اثر حاصل کرنے کے لئے مسلسل جانچ اور اصلاح کی ضرورت ہے۔ سرمایہ کاروں کو مشورہ دیا جاتا ہے کہ وہ حقیقی پوڈ میں وقت کی جانچ پڑتال کریں ، جب ضروری ہو تو دستی مداخلت کریں ، ہمیشہ خطرے کو قابو میں رکھیں۔
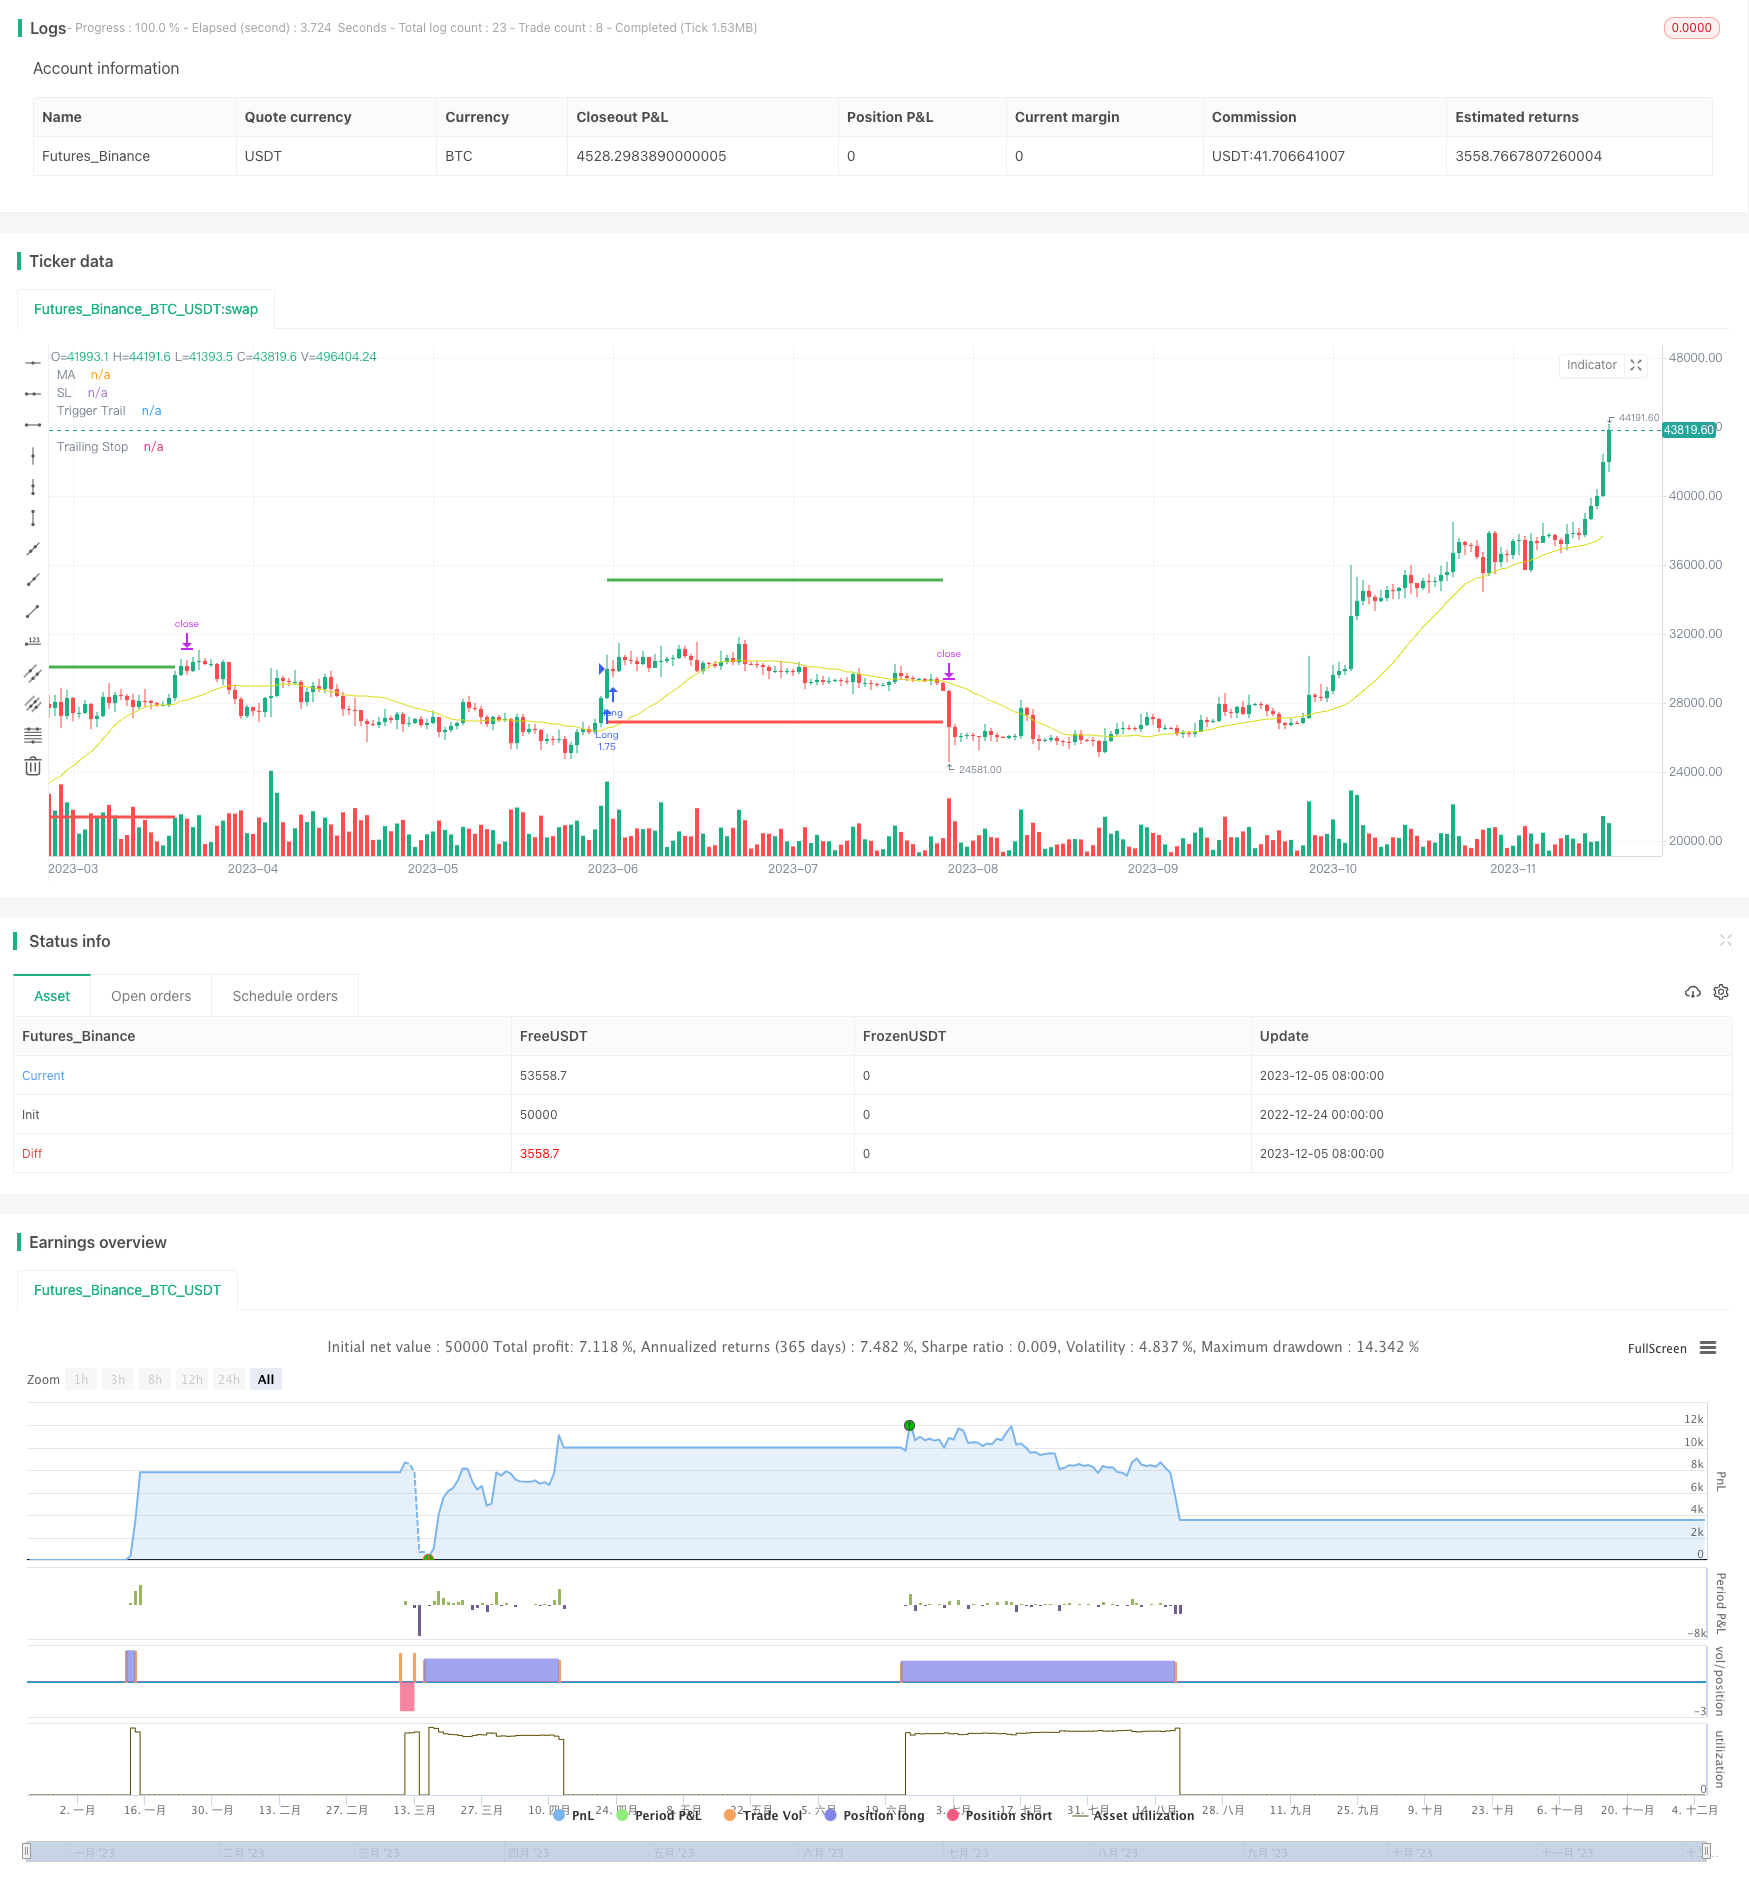
/*backtest
start: 2022-12-24 00:00:00
end: 2023-12-06 05:20:00
period: 1d
basePeriod: 1h
exchanges: [{"eid":"Futures_Binance","currency":"BTC_USDT"}]
*/

// This source code is subject to the terms of the Mozilla Public License 2.0 at https://mozilla.org/MPL/2.0/
// © gsanson66


//This code is based on RSI and a backed weighted MA
//@version=5
strategy("RSI + MA BACKTESTING", overlay=true, initial_capital=1000, default_qty_type=strategy.fixed, commission_type=strategy.commission.percent, commission_value=0.18, slippage=3)


//------------------------TOOL TIPS---------------------------//

t1 = "Choice between a Standard MA (SMA) or a backed-weighted MA (RWMA) which permits to minimize the impact of short term reversal. Default is RWMA."
t2 = "Value of RSI to send a LONG or a SHORT signal. RSI above 60 is a LONG signal and RSI below 40 is a SHORT signal."
t3 = "Rate of Change Value of selected MA to send a LONG or a SHORT signal. By default : ROC MA below -1 is a LONG signal and ROC MA above 1 is a SHORT signal"
t4 = "Threshold value to trigger trailing Take Profit. This threshold is calculated as a multiple of the ATR (Average True Range)."
t5 = "Percentage value of trailing Take Profit. This Trailing TP follows the profit if it increases, remaining selected percentage below it, but stops if the profit decreases."
t6 = "Each gain or losse (relative to the previous reference) in an amount equal to this fixed ratio will change quantity of orders."
t7 = "The amount of money to be added to or subtracted from orders once the fixed ratio has been reached."


//------------------------FUNCTIONS---------------------------//

//@function which calculate a retro weighted moving average to minimize the impact of short term reversal
rwma(source, length) =>
    sum = 0.0
    denominator = 0.0
    weight = 0.0
    weight_x = 100/(4+(length-4)*1.30)
    weight_y = 1.30*weight_x
    for i=0 to length - 1
        if i <= 3
            weight := weight_x
        else
            weight := weight_y
        sum := sum + source[i] * weight
        denominator := denominator + weight
    rwma = sum/denominator

//@function which permits the user to choose a moving average type
ma(source, length, type) =>
    switch type
        "SMA" => ta.sma(source, length)
        "RWMA" => rwma(source, length)

//@function Displays text passed to `txt` when called.
debugLabel(txt, color) =>
    label.new(bar_index, high, text = txt, color=color, style = label.style_label_lower_right, textcolor = color.black, size = size.small)

//@function which looks if the close date of the current bar falls inside the date range
inBacktestPeriod(start, end) => (time >= start) and (time <= end)


//--------------------------------USER INPUTS-------------------------------//

//Technical parameters
rsiLengthInput = input.int(20, minval=1, title="RSI Length", group="RSI Settings")
maTypeInput = input.string("RWMA", title="MA Type", options=["SMA", "RWMA"], group="MA Settings", inline="1", tooltip=t1)
maLenghtInput = input.int(20, minval=1, title="MA Length", group="MA Settings", inline="1")
rsiLongSignalValue = input.int(60, minval=1, maxval=99, title="RSI Long Signal", group="Strategy parameters", inline="3")
rsiShortSignalValue = input.int(40, minval=1, maxval=99, title="RSI Short Signal", group="Strategy parameters", inline="3", tooltip=t2)
rocMovAverLongSignalValue = input.float(-1, maxval=0, title="ROC MA Long Signal", group="Strategy parameters", inline="4")
rocMovAverShortSignalValue = input.float(1, minval=0, title="ROC MA Short Signal", group="Strategy parameters", inline="4", tooltip=t3)
//TP Activation and Trailing TP
takeProfitActivationInput = input.float(5, minval=1.0, title="TP activation in multiple of ATR", group="Strategy parameters", tooltip=t4)
trailingStopInput = input.float(3, minval=0, title="Trailing TP in percentage", group="Strategy parameters", tooltip=t5)
//Money Management
fixedRatio = input.int(defval=400, minval=1, title="Fixed Ratio Value ($)", group="Money Management", tooltip=t6)
increasingOrderAmount = input.int(defval=200, minval=1, title="Increasing Order Amount ($)", group="Money Management", tooltip=t7)
//Backtesting period
startDate = input(title="Start Date", defval=timestamp("1 Jan 2018 00:00:00"), group="Backtesting Period")
endDate = input(title="End Date", defval=timestamp("1 July 2024 00:00:00"), group="Backtesting Period")


//------------------------------VARIABLES INITIALISATION-----------------------------//

float rsi = ta.rsi(close, rsiLengthInput)
float ma = ma(close, maLenghtInput, maTypeInput)
float roc_ma = ((ma/ma[maLenghtInput]) - 1)*100
float atr = ta.atr(20)
var float trailingStopOffset = na
var float trailingStopActivation = na
var float trailingStop = na
var float stopLoss = na
var bool long = na
var bool short = na
var bool bufferTrailingStopDrawing = na
float theoreticalStopPrice = na
bool inRange = na
equity = math.abs(strategy.equity - strategy.openprofit)
strategy.initial_capital = 50000
var float capital_ref = strategy.initial_capital
var float cashOrder = strategy.initial_capital * 0.95


//------------------------------CHECKING SOME CONDITIONS ON EACH SCRIPT EXECUTION-------------------------------//

//Checking if the date belong to the range
inRange := true

//Checking performances of the strategy
if equity > capital_ref + fixedRatio
    spread = (equity - capital_ref)/fixedRatio
    nb_level = int(spread)
    increasingOrder = nb_level * increasingOrderAmount
    cashOrder := cashOrder + increasingOrder
    capital_ref := capital_ref + nb_level*fixedRatio
if equity < capital_ref - fixedRatio
    spread = (capital_ref - equity)/fixedRatio
    nb_level = int(spread)
    decreasingOrder = nb_level * increasingOrderAmount
    cashOrder := cashOrder - decreasingOrder
    capital_ref := capital_ref - nb_level*fixedRatio

//Checking if we close all trades in case where we exit the backtesting period
if strategy.position_size!=0 and not inRange
    debugLabel("END OF BACKTESTING PERIOD : we close the trade", color=color.rgb(116, 116, 116))
    strategy.close_all()
    bufferTrailingStopDrawing := false
    stopLoss := na
    trailingStopActivation := na
    trailingStop := na
    short := false
    long := false


//------------------------------STOP LOSS AND TRAILING STOP ACTIVATION----------------------------//

// We handle the stop loss and trailing stop activation
if (low <= stopLoss or high >= trailingStopActivation) and long
    if high >= trailingStopActivation
        bufferTrailingStopDrawing := true
    else if low <= stopLoss
        long := false
    stopLoss := na
    trailingStopActivation := na
if (low <= trailingStopActivation or high >= stopLoss) and short
    if low <= trailingStopActivation
        bufferTrailingStopDrawing := true
    else if high >= stopLoss
        short := false
    stopLoss := na
    trailingStopActivation := na


//-------------------------------------TRAILING STOP--------------------------------------//

// If the traling stop is activated, we manage its plotting with the bufferTrailingStopDrawing
if bufferTrailingStopDrawing and long
    theoreticalStopPrice := high - trailingStopOffset * syminfo.mintick
    if na(trailingStop)
        trailingStop := theoreticalStopPrice
    else if theoreticalStopPrice > trailingStop
        trailingStop := theoreticalStopPrice
    else if low <= trailingStop
        trailingStop := na
        bufferTrailingStopDrawing := false
        long := false
if bufferTrailingStopDrawing and short
    theoreticalStopPrice := low + trailingStopOffset * syminfo.mintick
    if na(trailingStop)
        trailingStop := theoreticalStopPrice
    else if theoreticalStopPrice < trailingStop
        trailingStop := theoreticalStopPrice
    else if high >= trailingStop
        trailingStop := na
        bufferTrailingStopDrawing := false
        short := false


//---------------------------------LONG CONDITION--------------------------//

if rsi >= 60 and roc_ma <= rocMovAverLongSignalValue and inRange and not long
    if short
        bufferTrailingStopDrawing := false
        stopLoss := na
        trailingStopActivation := na
        trailingStop := na
        short := false
    trailingStopActivation := close + takeProfitActivationInput*atr
    trailingStopOffset := (trailingStopActivation * trailingStopInput/100) / syminfo.mintick
    stopLoss := close - 3*atr
    long := true
    qty = cashOrder/close
    strategy.entry("Long", strategy.long, qty)
    strategy.exit("Exit Long", "Long", stop = stopLoss, trail_price = trailingStopActivation,
                 trail_offset = trailingStopOffset)


//--------------------------------SHORT CONDITION-------------------------------//

if rsi <= 40 and roc_ma >= rocMovAverShortSignalValue and inRange and not short
    if long
        bufferTrailingStopDrawing := false
        stopLoss := na
        trailingStopActivation := na
        trailingStop := na
        long := false
    trailingStopActivation := close - takeProfitActivationInput*atr
    trailingStopOffset := (trailingStopActivation * trailingStopInput/100) / syminfo.mintick
    stopLoss := close + 3*atr
    short := true
    qty = cashOrder/close
    strategy.entry("Short", strategy.short, qty)
    strategy.exit("Exit Short", "Short", stop = stopLoss, trail_price = trailingStopActivation,
                 trail_offset = trailingStopOffset)


//--------------------------------PLOTTING ELEMENT---------------------------------//

// Plotting of element in the graph
plotchar(rsi, "RSI", "", location.top, color.rgb(0, 214, 243))
plot(ma, "MA", color.rgb(219, 219, 18))
plotchar(roc_ma, "ROC MA", "", location.top, color=color.orange)
// Visualizer trailing stop and stop loss movement
plot(stopLoss, "SL", color.red, 3, plot.style_linebr)
plot(trailingStopActivation, "Trigger Trail", color.green, 3, plot.style_linebr)
plot(trailingStop, "Trailing Stop",  color.blue, 3, plot.style_linebr)