Bitcoin تجارتی حکمت عملی مقداری اشارے پر مبنی ہے۔
جائزہ
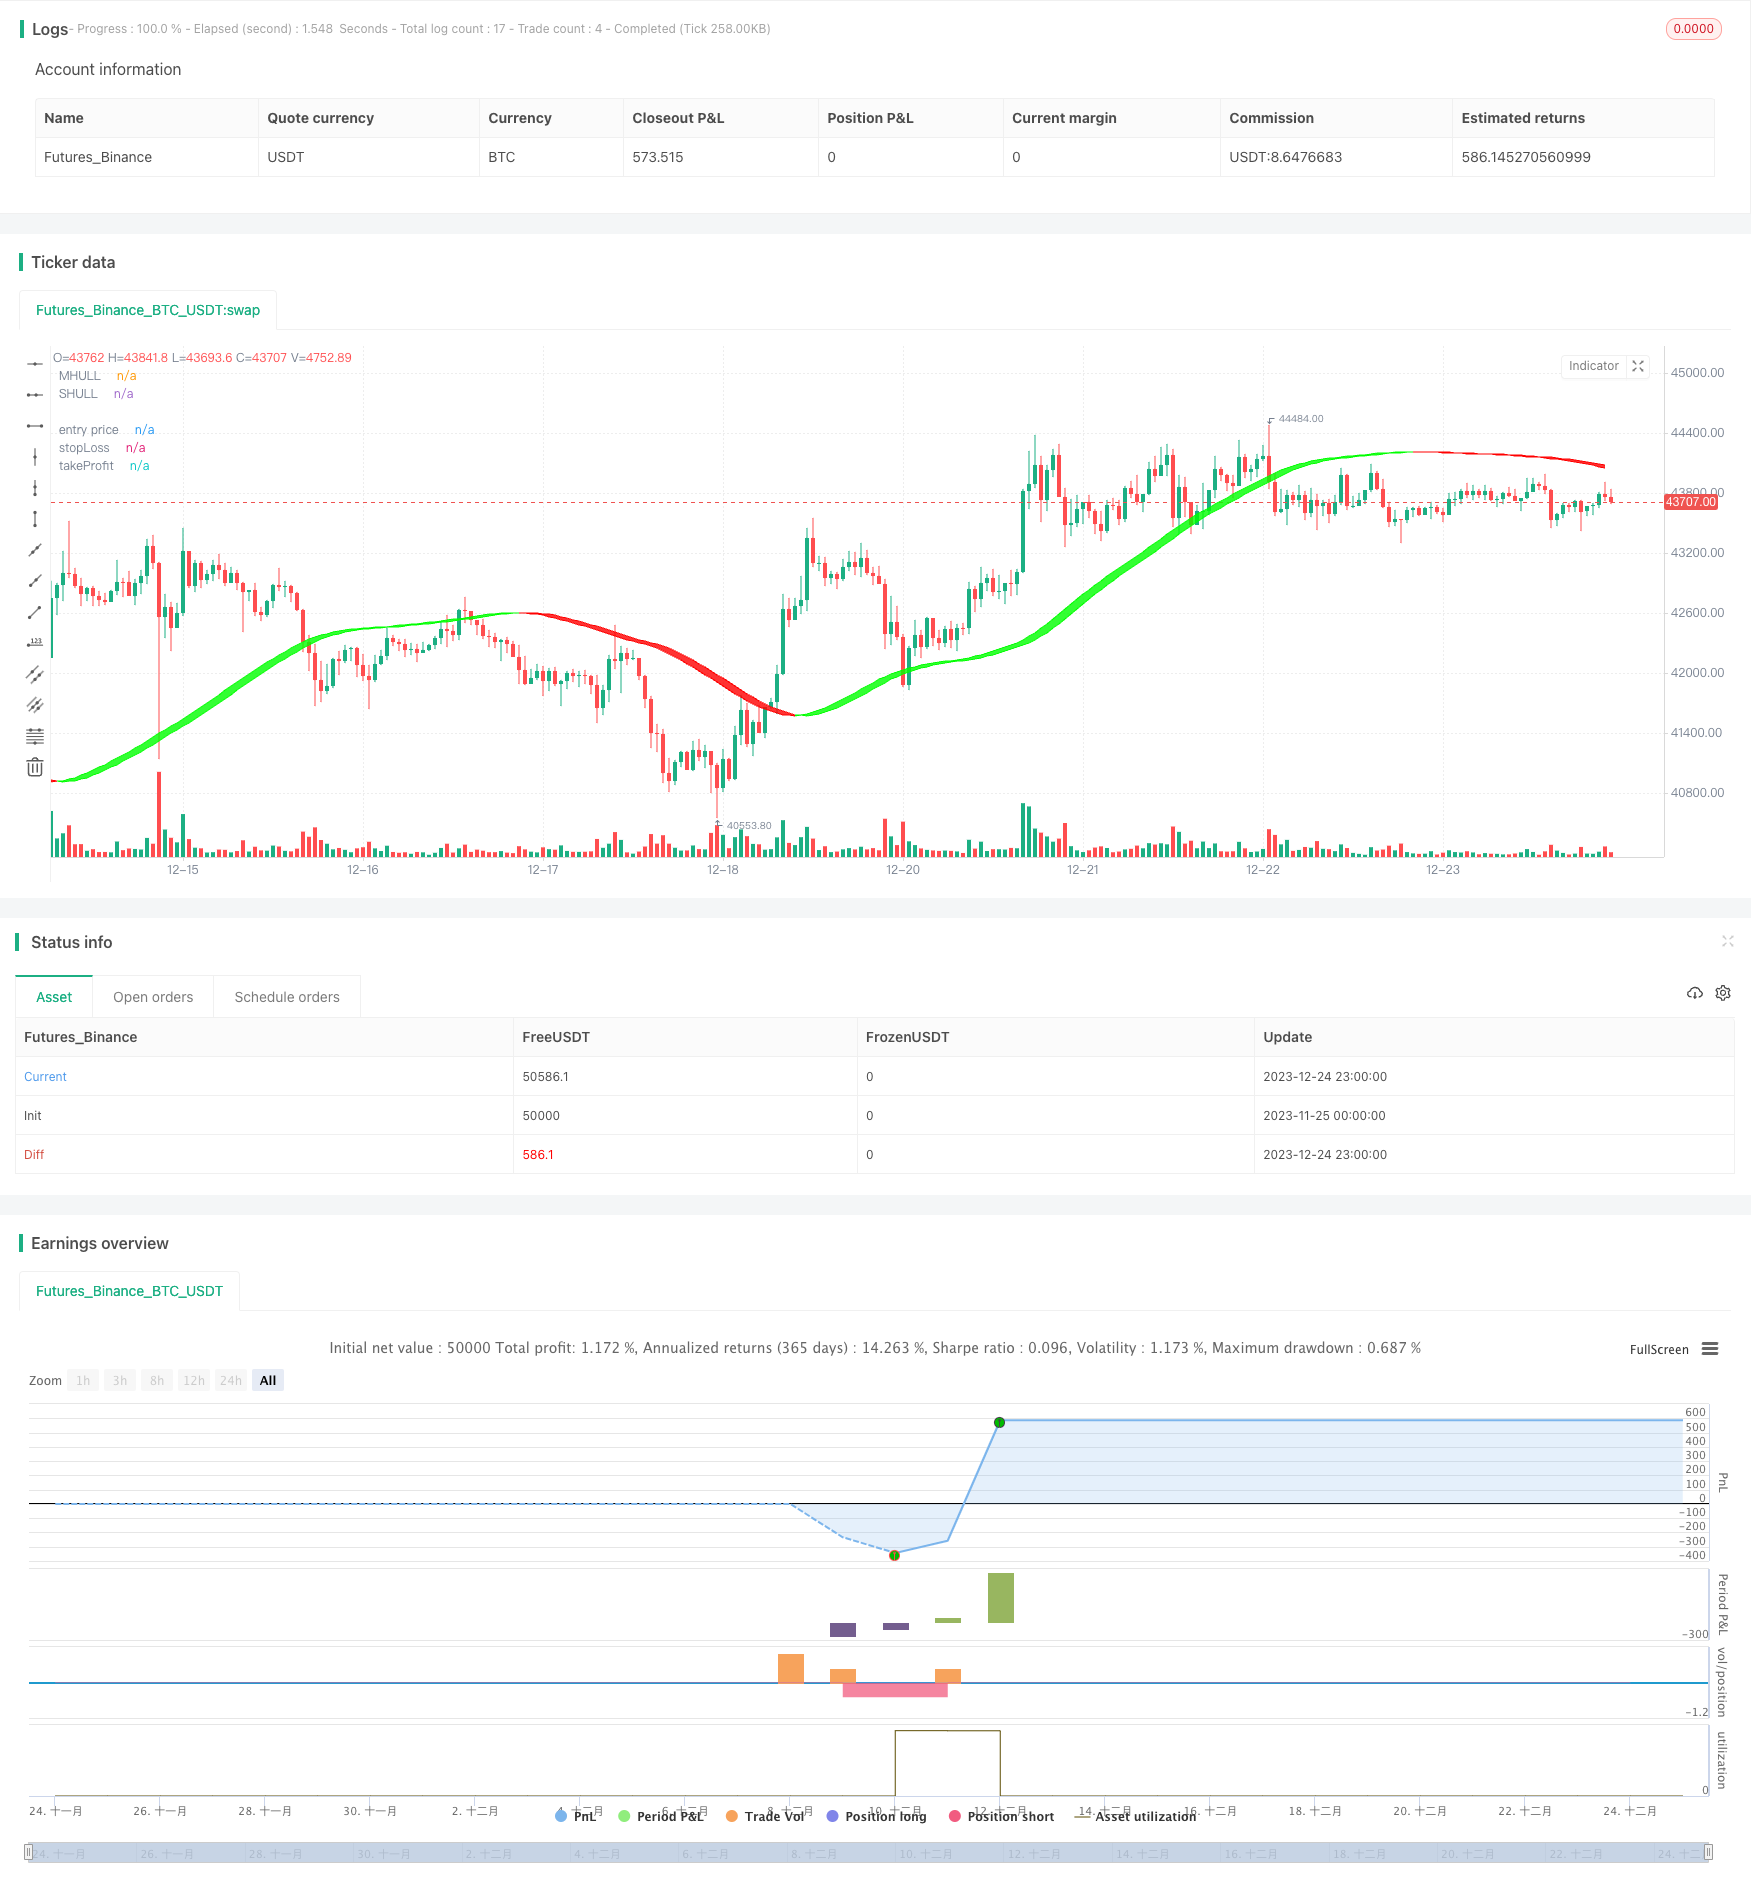
اس حکمت عملی میں بٹ کوائن کی خرید و فروخت کے وقت کا فیصلہ کرنے کے لئے متعدد مقداری اشارے استعمال کیے جاتے ہیں تاکہ خود کار طریقے سے تجارت کی جاسکے۔ اس میں بنیادی طور پر ہل اشارے ((Hull) ، نسبتا strong مضبوط اشارے ((RSI) ، برن بینڈ ((BB) اور ٹرانزیکشن حجم آسکیلیٹر ((VO)) شامل ہیں۔
حکمت عملی کا اصول
مارکیٹ میں اہم رجحانات کی سمت کا تعین کرنے کے لئے ترمیم شدہ ہل منتقل اوسط کا استعمال کریں ، جس میں برن بینڈ کے ساتھ مل کر خریدی جانے والی قیمتوں کا تعین کرنے میں معاون ہے۔
آر ایس آئی اشارے خود بخود اتار چڑھاؤ کی حد کا تعین کرنے کے لئے اوورلوڈ اور اوورلوڈ علاقوں کا فیصلہ کرنے کے لئے ٹریڈنگ سگنل بھیجتا ہے۔ ڈپلیکیٹ سگنل کی توثیق کے طور پر پیرامیٹرز کے دو سیٹ بھی ترتیب دیئے گئے ہیں۔
اس کے علاوہ ، یہ بھی کہا گیا ہے کہ اس کے نتیجے میں ، اس کی قیمتوں میں کمی واقع ہوگی۔
اسٹاپ نقصان / اسٹاپ قیمت تناسب پیرامیٹرز کے مطابق اسٹاپ نقصان کی پوزیشن کو پہلے سے طے کریں ، خطرے کا انتظام کریں۔
طاقت کا تجزیہ
ہل وکر تیزی سے رجحان کی تبدیلی کو پکڑنے کے لئے، اور برن کم از کم غلط سگنل کو کم کرنے کے لئے معاون فیصلے.
RSI اشارے پیرامیٹرز کی اصلاح کی ترتیب اور ڈپلیکیٹ سگنل کی توثیق ، زیادہ وشوسنییتا ہے۔
ٹرانزیکشن حجم اوسیلیٹر رجحان اور اشارے کے اشارے کے ساتھ مل کر غیر درست تجارت سے بچنے کے لئے.
پہلے سے طے شدہ اسٹاپ نقصان روکنے کا طریقہ انفرادی نقصانات کو خود بخود کنٹرول کرسکتا ہے ، جو مجموعی خطرے کو مؤثر طریقے سے کنٹرول کرتا ہے۔
خطرے کا تجزیہ
پیرامیٹرز کی غلط ترتیب کے نتیجے میں اعلی تجارتی تعدد یا سگنل کی خرابی کا سبب بن سکتا ہے۔
اچانک واقعات کی وجہ سے مارکیٹ میں شدید اتار چڑھاؤ ہوتا ہے تو ، اسٹاپ نقصان کو توڑ دیا جاسکتا ہے ، جس سے زیادہ نقصان ہوتا ہے۔
جب تجارت کی قسم کو دوسرے کرنسیوں میں تبدیل کیا جاتا ہے تو ، پیرامیٹرز کو دوبارہ جانچنے اور بہتر بنانے کی ضرورت ہوتی ہے۔
ٹرانزیکشن حجم کے اعداد و شمار غائب ہونے پر ، ٹرانزیکشن حجم کا اوسیلیٹر غیر فعال ہوجاتا ہے۔
اصلاح کی سمت
RSI پیرامیٹرز کے لئے زیادہ مجموعہ ٹیسٹ کریں اور بہترین پیرامیٹرز تلاش کریں۔
RSI کے ساتھ دوسرے اشارے جیسے MACD ، KD وغیرہ کو جوڑ کر ، سگنل کی درستگی کو بہتر بنائیں۔
ماڈل کی پیشن گوئی کے ماڈیول کو شامل کریں ، مارکیٹ کی سمت کا فیصلہ کرنے کے لئے مشین لرننگ کے ساتھ مل کر۔
دوسرے تجارتی اقسام کے پیرامیٹرز کے اثر کو تبدیل کرنے کے لئے ٹیسٹ۔
منافع کو زیادہ سے زیادہ کرنے کے لئے سٹاپ نقصان کو روکنے کے الگورتھم کو بہتر بنائیں۔
خلاصہ کریں۔
اس حکمت عملی میں خرید و فروخت کے وقت کا تعین کرنے کے لئے متعدد مقداری تکنیکی اشارے کا جامع استعمال کیا گیا ہے۔ پیرامیٹرز کی اصلاح ، رسک کنٹرول اور دیگر طریقوں کے ذریعہ ، بٹ کوائن کی خودکار تجارت کو حاصل کیا گیا ہے۔ اثر اچھا ہے ، لیکن مارکیٹ میں تبدیلیوں کے مطابق مستقل جانچ اور اصلاح کی ضرورت ہے۔ یہ سرمایہ کاروں کے لئے حوالہ اور معاون تجارتی فیصلے فراہم کرسکتا ہے۔
/*backtest
start: 2023-11-25 00:00:00
end: 2023-12-25 00:00:00
period: 1h
basePeriod: 15m
exchanges: [{"eid":"Futures_Binance","currency":"BTC_USDT"}]
*/


// © maxencetajet

//@version=5
strategy("Strategy Crypto", overlay=true, initial_capital=1000, default_qty_type=strategy.fixed, default_qty_value=0.5, slippage=25)

src1 = input.source(close, title="Source")
target_stop_ratio = input.float(title='Risk/Reward', defval=1.5, minval=0.5, maxval=100)

startDate = input.int(title='Start Date', defval=1, minval=1, maxval=31, group="beginning Backtest")
startMonth = input.int(title='Start Month', defval=5, minval=1, maxval=12, group="beginning Backtest")
startYear = input.int(title='Start Year', defval=2022, minval=2000, maxval=2100, group="beginning Backtest")

inDateRange = time >= timestamp(syminfo.timezone, startYear, startMonth, startDate, 0, 0)

swingHighV = input.int(7, title="Swing High", group="number of past candles")
swingLowV = input.int(7, title="Swing Low", group="number of past candles")

//Hull Suite

modeSwitch = input.string("Hma", title="Hull Variation", options=["Hma", "Thma", "Ehma"], group="Hull Suite")
length = input(60, title="Length", group="Hull Suite")
lengthMult = input(3, title="Length multiplier", group="Hull Suite")

HMA(_src1, _length) =>
    ta.wma(2 * ta.wma(_src1, _length / 2) - ta.wma(_src1, _length), math.round(math.sqrt(_length)))

EHMA(_src1, _length) =>
    ta.ema(2 * ta.ema(_src1, _length / 2) - ta.ema(_src1, _length), math.round(math.sqrt(_length)))

THMA(_src1, _length) =>
    ta.wma(ta.wma(_src1, _length / 3) * 3 - ta.wma(_src1, _length / 2) - ta.wma(_src1, _length), _length)

Mode(modeSwitch, src1, len) =>
    modeSwitch == 'Hma' ? HMA(src1, len) : modeSwitch == 'Ehma' ? EHMA(src1, len) : modeSwitch == 'Thma' ? THMA(src1, len / 2) : na

_hull = Mode(modeSwitch, src1, int(length * lengthMult))
HULL = _hull
MHULL = HULL[0]
SHULL = HULL[2]

hullColor = HULL > HULL[2] ? #00ff00 : #ff0000

Fi1 = plot(MHULL, title='MHULL', color=hullColor, linewidth=1, transp=50)
Fi2 = plot(SHULL, title='SHULL', color=hullColor, linewidth=1, transp=50)
fill(Fi1, Fi2, title='Band Filler', color=hullColor, transp=40)

//QQE MOD

RSI_Period = input(6, title='RSI Length', group="QQE MOD")
SF = input(5, title='RSI Smoothing', group="QQE MOD")
QQE = input(3, title='Fast QQE Factor', group="QQE MOD")
ThreshHold = input(3, title='Thresh-hold', group="QQE MOD")

src = input(close, title='RSI Source', group="QQE MOD")

Wilders_Period = RSI_Period * 2 - 1

Rsi = ta.rsi(src, RSI_Period)
RsiMa = ta.ema(Rsi, SF)
AtrRsi = math.abs(RsiMa[1] - RsiMa)
MaAtrRsi = ta.ema(AtrRsi, Wilders_Period)
dar = ta.ema(MaAtrRsi, Wilders_Period) * QQE

longband = 0.0
shortband = 0.0
trend = 0

DeltaFastAtrRsi = dar
RSIndex = RsiMa
newshortband = RSIndex + DeltaFastAtrRsi
newlongband = RSIndex - DeltaFastAtrRsi
longband := RSIndex[1] > longband[1] and RSIndex > longband[1] ? math.max(longband[1], newlongband) : newlongband
shortband := RSIndex[1] < shortband[1] and RSIndex < shortband[1] ? math.min(shortband[1], newshortband) : newshortband
cross_1 = ta.cross(longband[1], RSIndex)
trend := ta.cross(RSIndex, shortband[1]) ? 1 : cross_1 ? -1 : nz(trend[1], 1)
FastAtrRsiTL = trend == 1 ? longband : shortband

length1 = input.int(50, minval=1, title='Bollinger Length', group="QQE MOD")
mult = input.float(0.35, minval=0.001, maxval=5, step=0.1, title='BB Multiplier', group="QQE MOD")
basis = ta.sma(FastAtrRsiTL - 50, length1)
dev = mult * ta.stdev(FastAtrRsiTL - 50, length1)
upper = basis + dev
lower = basis - dev
color_bar = RsiMa - 50 > upper ? #00c3ff : RsiMa - 50 < lower ? #ff0062 : color.gray

QQEzlong = 0
QQEzlong := nz(QQEzlong[1])
QQEzshort = 0
QQEzshort := nz(QQEzshort[1])
QQEzlong := RSIndex >= 50 ? QQEzlong + 1 : 0
QQEzshort := RSIndex < 50 ? QQEzshort + 1 : 0

RSI_Period2 = input(6, title='RSI Length', group="QQE MOD")
SF2 = input(5, title='RSI Smoothing', group="QQE MOD")
QQE2 = input(1.61, title='Fast QQE2 Factor', group="QQE MOD")
ThreshHold2 = input(3, title='Thresh-hold', group="QQE MOD")

src2 = input(close, title='RSI Source', group="QQE MOD")

Wilders_Period2 = RSI_Period2 * 2 - 1

Rsi2 = ta.rsi(src2, RSI_Period2)
RsiMa2 = ta.ema(Rsi2, SF2)
AtrRsi2 = math.abs(RsiMa2[1] - RsiMa2)
MaAtrRsi2 = ta.ema(AtrRsi2, Wilders_Period2)
dar2 = ta.ema(MaAtrRsi2, Wilders_Period2) * QQE2
longband2 = 0.0
shortband2 = 0.0
trend2 = 0

DeltaFastAtrRsi2 = dar2
RSIndex2 = RsiMa2
newshortband2 = RSIndex2 + DeltaFastAtrRsi2
newlongband2 = RSIndex2 - DeltaFastAtrRsi2
longband2 := RSIndex2[1] > longband2[1] and RSIndex2 > longband2[1] ? math.max(longband2[1], newlongband2) : newlongband2
shortband2 := RSIndex2[1] < shortband2[1] and RSIndex2 < shortband2[1] ? math.min(shortband2[1], newshortband2) : newshortband2
cross_2 = ta.cross(longband2[1], RSIndex2)
trend2 := ta.cross(RSIndex2, shortband2[1]) ? 1 : cross_2 ? -1 : nz(trend2[1], 1)
FastAtrRsi2TL = trend2 == 1 ? longband2 : shortband2

QQE2zlong = 0
QQE2zlong := nz(QQE2zlong[1])
QQE2zshort = 0
QQE2zshort := nz(QQE2zshort[1])
QQE2zlong := RSIndex2 >= 50 ? QQE2zlong + 1 : 0
QQE2zshort := RSIndex2 < 50 ? QQE2zshort + 1 : 0

hcolor2 = RsiMa2 - 50 > ThreshHold2 ? color.silver : RsiMa2 - 50 < 0 - ThreshHold2 ? color.silver : na

Greenbar1 = RsiMa2 - 50 > ThreshHold2
Greenbar2 = RsiMa - 50 > upper

Redbar1 = RsiMa2 - 50 < 0 - ThreshHold2
Redbar2 = RsiMa - 50 < lower

//Volume Oscillator

var cumVol = 0.
cumVol += nz(volume)
if barstate.islast and cumVol == 0
    runtime.error("No volume is provided by the data vendor.")
shortlen = input.int(5, minval=1, title = "Short Length", group="Volume Oscillator")
longlen = input.int(10, minval=1, title = "Long Length", group="Volume Oscillator")
short = ta.ema(volume, shortlen)
long = ta.ema(volume, longlen)
osc = 100 * (short - long) / long

//strategy

enterLong   =  '    {  "message_type": "bot",  "bot_id": 4635591,  "email_token": "25byourtefcodeuufyd2-43314-ab98-bjorg224",  "delay_seconds": 1}  ' //start long deal

ExitLong    =  '    {  "message_type": "bot",  "bot_id": 4635591,  "email_token": "25byourtefcodeuufyd2-43314-ab98-bjorg224",  "delay_seconds": 0,  "action": "close_at_market_price"}  ' // close long deal market

enterShort  =  '    {  "message_type": "bot",  "bot_id": 4635690,  "email_token": "25byourtefcodeuufyd2-43314-ab98-bjorg224",  "delay_seconds": 1}  ' // start short deal

ExitShort   =  '    {  "message_type": "bot",  "bot_id": 4635690,  "email_token": "25byourtefcodeuufyd2-43314-ab98-bjorg224",  "delay_seconds": 0,  "action": "close_at_market_price"}  ' // close short deal market

longcondition = close > MHULL and HULL > HULL[2] and osc > 0 and Greenbar1 and Greenbar2 and not Greenbar1[1] and not Greenbar2[1]
shortcondition = close < SHULL and HULL < HULL[2] and osc > 0 and Redbar1 and Redbar2 and not Redbar1[1] and not Redbar2[1]

float risk_long = na
float risk_short = na
float stopLoss = na
float takeProfit = na
float entry_price = na

risk_long := risk_long[1]
risk_short := risk_short[1]

swingHigh = ta.highest(high, swingHighV)
swingLow = ta.lowest(low, swingLowV)

if strategy.position_size == 0 and longcondition and inDateRange
    risk_long := (close - swingLow) / close
    strategy.entry("long", strategy.long, comment="Buy", alert_message=enterLong)

if strategy.position_size == 0 and shortcondition and inDateRange
    risk_short := (swingHigh - close) / close
    strategy.entry("short", strategy.short, comment="Sell", alert_message=enterShort)

if strategy.position_size > 0

    stopLoss := strategy.position_avg_price * (1 - risk_long)
    takeProfit := strategy.position_avg_price * (1 + target_stop_ratio * risk_long)
    entry_price := strategy.position_avg_price
    strategy.exit("long exit", "long", stop = stopLoss, limit = takeProfit, alert_message=ExitLong)

if strategy.position_size < 0

    stopLoss := strategy.position_avg_price * (1 + risk_short)
    takeProfit := strategy.position_avg_price * (1 - target_stop_ratio * risk_short)
    entry_price := strategy.position_avg_price
    strategy.exit("short exit", "short", stop = stopLoss, limit = takeProfit, alert_message=ExitShort)

p_ep = plot(entry_price, color=color.new(color.white, 0), linewidth=2, style=plot.style_linebr, title='entry price')
p_sl = plot(stopLoss, color=color.new(color.red, 0), linewidth=2, style=plot.style_linebr, title='stopLoss')
p_tp = plot(takeProfit, color=color.new(color.green, 0), linewidth=2, style=plot.style_linebr, title='takeProfit')
fill(p_sl, p_ep, color.new(color.red, transp=85))
fill(p_tp, p_ep, color.new(color.green, transp=85))